

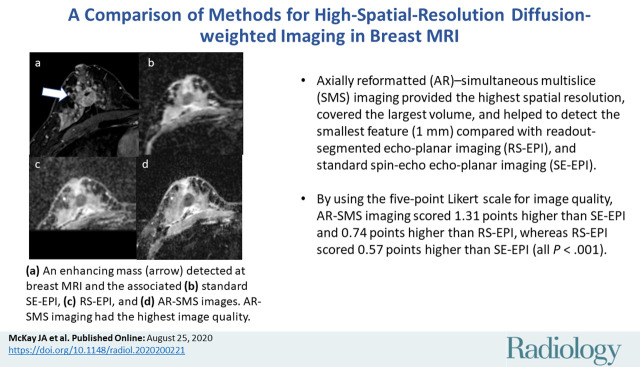
A Comparison of Methods for High-Spatial-Resolution Diffusion-weighted Imaging in Breast MRI
- PMID: 32840468
- PMCID: PMC7643813
- DOI: 10.1148/radiol.2020200221
A Comparison of Methods for High-Spatial-Resolution Diffusion-weighted Imaging in Breast MRI
Abstract
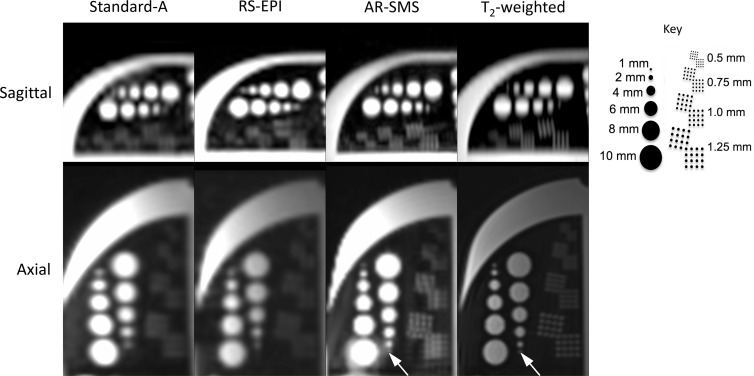
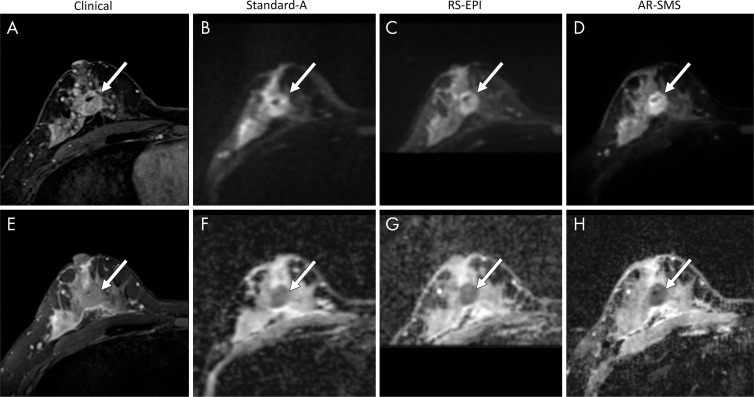
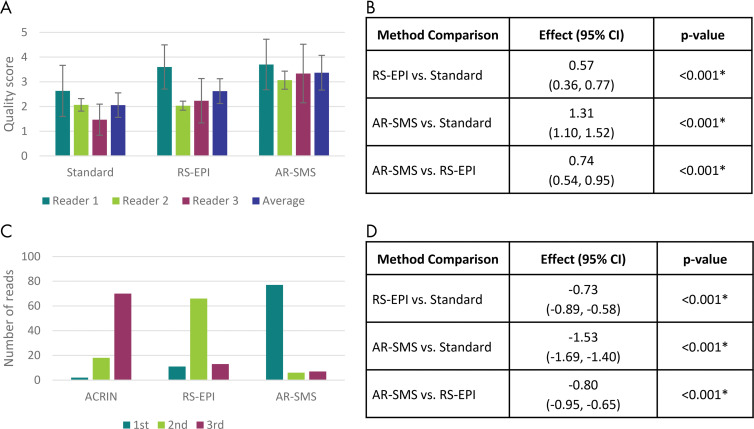
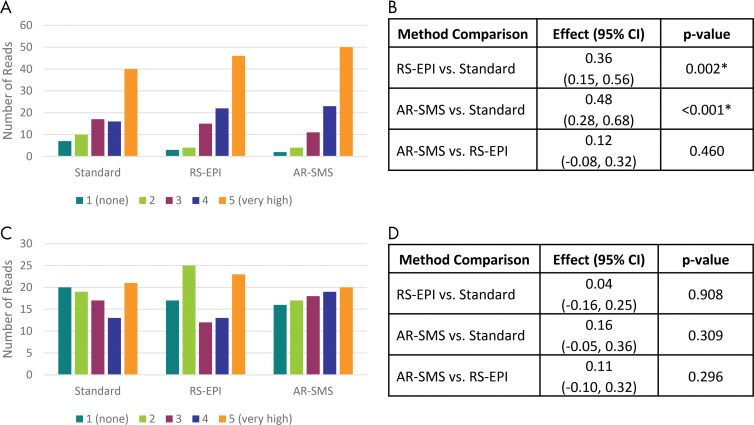
Background Diffusion-weighted imaging (DWI) shows promise in detecting and monitoring breast cancer, but standard spin-echo (SE) echo-planar DWI methods often have poor image quality and low spatial resolution. Proposed alternatives include readout-segmented (RS) echo-planar imaging and axially reformatted (AR)-simultaneous multislice (SMS) imaging. Purpose To compare the resolution and image quality of standard SE echo-planar imaging DWI with two high-spatial-resolution alternatives, RS echo-planar and AR-SMS imaging, for breast imaging. Materials and Methods In a prospective study (2016-2018), three 5-minute DWI protocols were acquired at 3.0 T, including standard SE echo-planar imaging, RS echo-planar imaging with five segments, and AR-SMS imaging with four times slice acceleration. Participants were women undergoing breast MRI either as part of a treatment response clinical trial or undergoing breast MRI for screening or suspected cancer. A commercial breast phantom was imaged for resolution comparison. Three breast radiologists reviewed images in random order, including clinical images indicating the lesion, images with b value of 800 sec/mm2, and apparent diffusion coefficient (ADC) maps from the three randomly labeled DWI methods. Readers measured the longest dimension and lesion-average ADC on three DWI methods, reported measurement confidence, and rated or ranked the quality of each image. The scores were fit to a linear mixed-effects model with intercepts for reader and subject. Results The smallest feature (1 mm) was only detectible in a phantom on images from AR-SMS DWI. Thirty lesions from 28 women (mean age, 50 years ± 13 [standard deviation]) were evaluated. On the five-point Likert scale for image quality, AR-SMS imaging scored 1.31 points higher than SE echo-planar imaging and 0.74 points higher than RS echo-planar imaging, whereas RS echo-planar imaging scored 0.57 points higher than SE echo-planar imaging (all P < .001). Conclusion The axially reformatted simultaneous multislice protocol was rated highest for image quality, followed by the readout-segmented echo-planar imaging protocol. Both were rated higher than the standard spin-echo echo-planar imaging. © RSNA, 2020 Online supplemental material is available for this article. See also the editorial by Partridge in this issue.
Figures
Comment in
-
Emerging Techniques Bring Diffusion-weighted Imaging of the Breast into Focus.Radiology. 2020 Nov;297(2):313-315. doi: 10.1148/radiol.2020203044. Epub 2020 Aug 25. Radiology. 2020. PMID: 32845215 Free PMC article. No abstract available.
References
-
- Hirano M, Satake H, Ishigaki S, Ikeda M, Kawai H, Naganawa S. Diffusion-weighted imaging of breast masses: comparison of diagnostic performance using various apparent diffusion coefficient parameters. AJR Am J Roentgenol 2012;198(3):717–722. - PubMed
Publication types
MeSH terms
Substances
Grants and funding
LinkOut - more resources
Full Text Sources
Medical
Research Materials
