Meta-Analysis
. 2020 Nov;297(2):344-351.
doi: 10.1148/radiol.2020200989. Epub 2020 Aug 25.

T2 Relaxation Times at Cardiac MRI in Healthy Adults: A Systematic Review and Meta-Analysis

Affiliations
Meta-Analysis

T2 Relaxation Times at Cardiac MRI in Healthy Adults: A Systematic Review and Meta-Analysis

Christopher A Hanson et al. Radiology. 2020 Nov.

Abstract

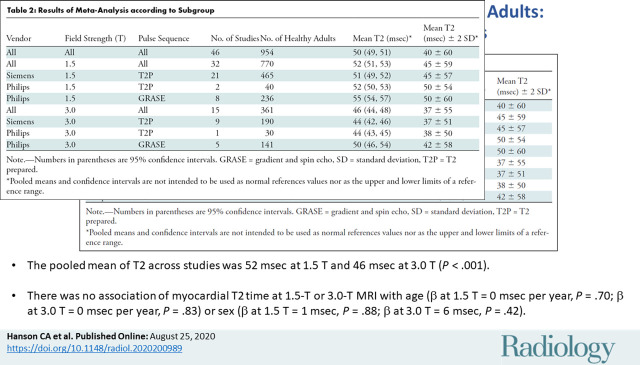
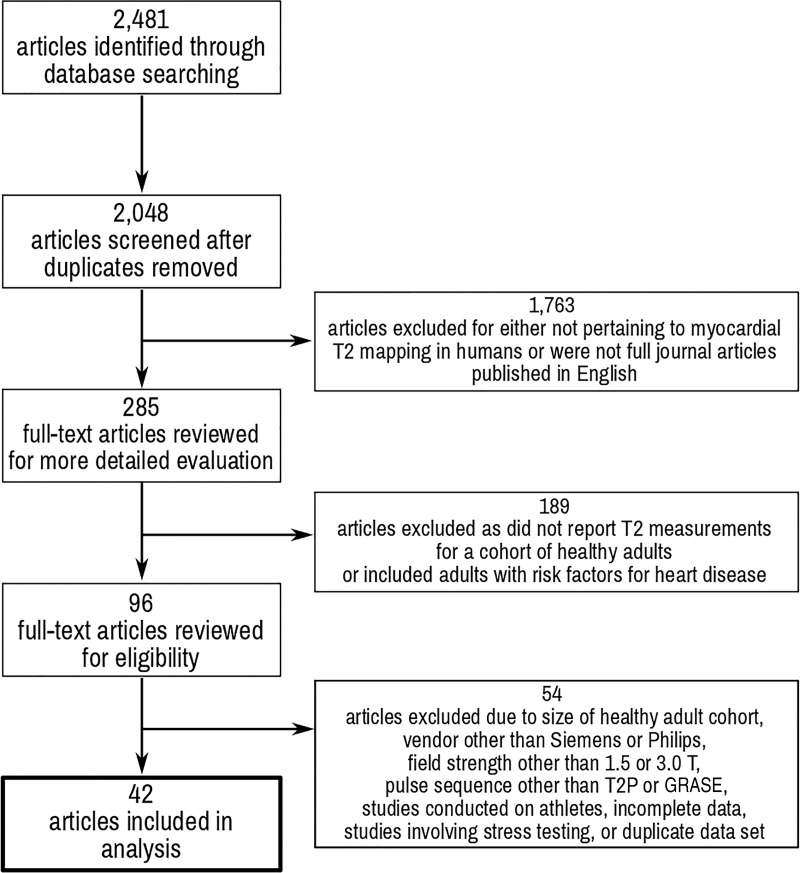
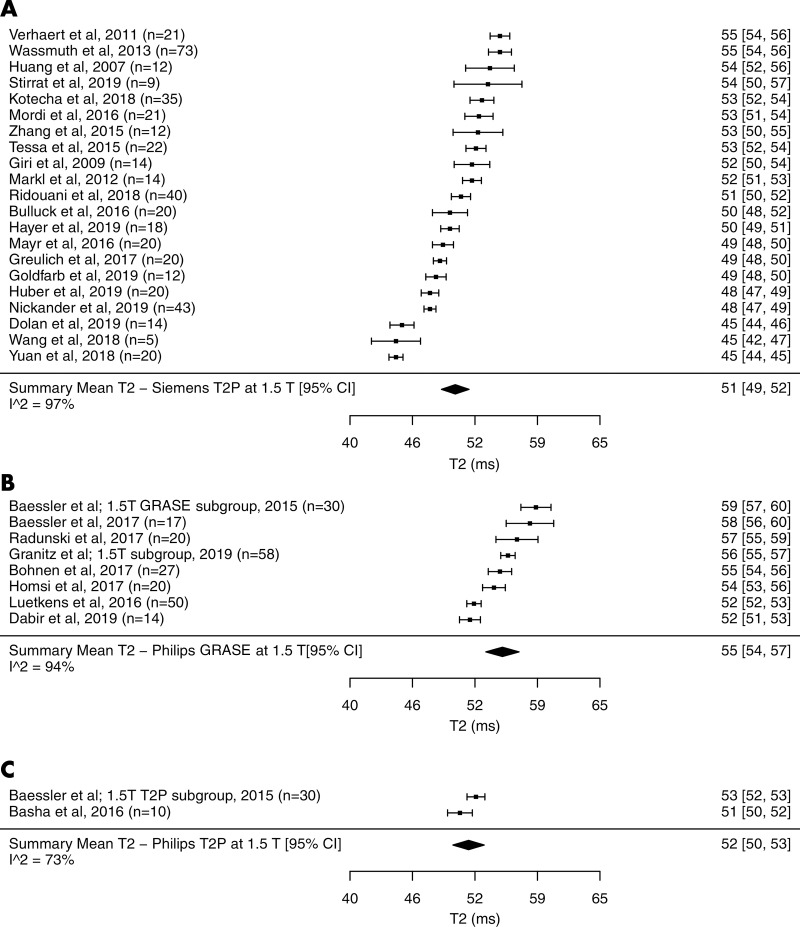
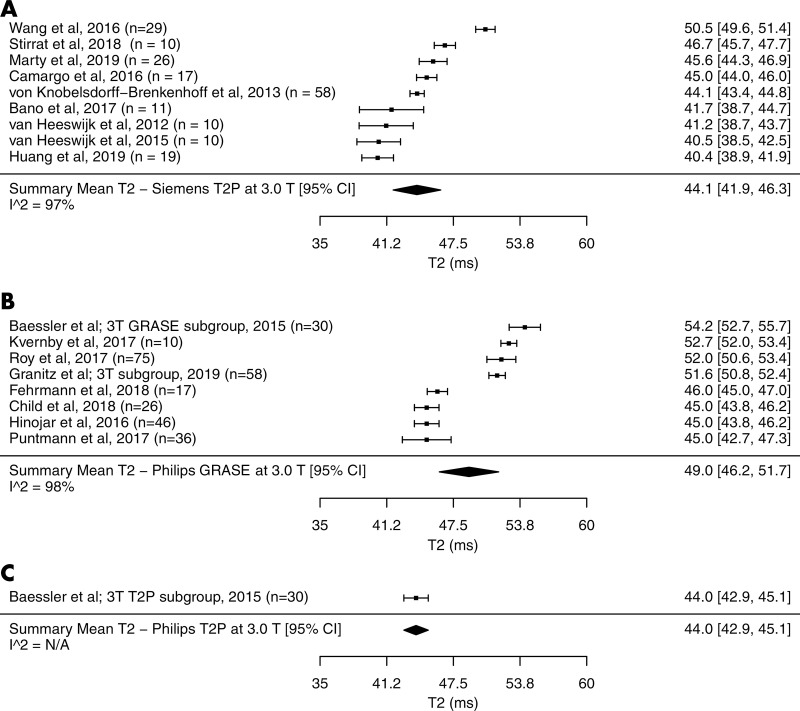
Background T2 mapping is an important cardiac MRI technique with applications in various conditions. However, a comprehensive evaluation of the T2 literature for normal values is lacking. Purpose To characterize the ranges of normal values and variability of myocardial T2 relaxation times using a systematic review and meta-analysis of the T2 literature. Materials and Methods PubMed and Cochrane Central were searched from June 2019 to January 2020 for myocardial T2 measurements in healthy adults. Studies quantifying T2 relaxation times conducted at 1.5 T or 3.0 T using gradient and spin-echo (GRASE) or T2-prepared balanced steady-state free precession sequences were included. Summary means were generated using a random-effects model. Subgroup analysis and meta-regression were performed to assess factors causing heterogeneity. Results Of the 2481 articles retrieved, 42 studies were included with 954 healthy adults (mean age, 42.4 years ± 10.5 [standard deviation]; 538 men). The pooled mean of T2 across studies was 52 msec at 1.5 T (95% confidence interval [CI]: 51 msec, 53 msec) and 46 msec at 3.0 T (95% CI: 44 msec, 48 msec) (P ≤ .001). I2 was 98% at 1.5 T and 3.0 T. Meta-regression at 1.5 T and 3.0 T identified vendor (β at 1.5 T = -4 msec [with Philips as reference], P < .001; β at 3.0 T = -5 msec, P = .02) and pulse sequence (β at 1.5 T = -5 msec [with GRASE as reference], P < .001; β at 3.0 T = -6 msec, P = .002) as significant covariates, but it did not identify any association with covariates of age (β at 1.5 T = 0 msec per year, P = .70; β at 3.0 T = 0 msec per year, P = .83) or sex (β at 1.5 T = -1 msec, P = .88; β at 3.0 T = 6 msec, P = .42). Conclusion The pooled mean of T2 relaxation times in healthy adults had marked heterogeneity across studies with field strength, vendor, and pulse sequence identified as covariates associated with T2. T2-prepared measurements were similar between vendors at each field strength. © RSNA, 2020 Online supplemental material is available for this article.


Figures

None
Graphical abstract
Preferred Items for Systematic Reviews and Meta-Analysis flowchart of study review process. GRASE = gradient and spin echo, T2P = T2 prepared.
Figure 1:
Preferred Items for Systematic Reviews and Meta-Analysis flowchart of study review process. GRASE = gradient and spin echo, T2P = T2 prepared.
Forest plots of T2 studies show T2 relaxation times at cardiac MRI at 1.5 T in healthy adults. Studies are grouped by vendor and pulse sequences. A, T2 studies performed with a Siemens scanner at 1.5 T using T2-prepared (T2P) sequence. B, T2 studies performed with a Philips scanner at 1.5 T using gradient and spin-echo sequence (GRASE). C, T2 studies performed with a Philips scanner at 1.5 T using T2P sequence. Studies with multiple subgroups are noted by author’s last name, year of publication, and number of patients in each study. CI = confidence interval.
Figure 2:
Forest plots of T2 studies show T2 relaxation times at cardiac MRI at 1.5 T in healthy adults. Studies are grouped by vendor and pulse sequences. A, T2 studies performed with a Siemens scanner at 1.5 T using T2-prepared (T2P) sequence. B, T2 studies performed with a Philips scanner at 1.5 T using gradient and spin-echo sequence (GRASE). C, T2 studies performed with a Philips scanner at 1.5 T using T2P sequence. Studies with multiple subgroups are noted by author’s last name, year of publication, and number of patients in each study. CI = confidence interval.
Forest plots of T2 studies show T2 relaxation times at cardiac MRI at 3.0 T in healthy adults. Studies are grouped by vendor and pulse sequences. A, T2 studies performed with a Siemens scanner at 3.0 T using T2-prepared (T2P) sequence, B, T2 studies performed with a Philips scanner at 3.0 T using gradient and spin-echo sequence (GRASE), C, T2 studies performed with a Philips scanner at 3.0 T using T2P sequence. Studies with multiple subgroups are noted by author’s last name, year of publication, and number of patients in each study. CI = confidence interval, N/A = not applicable.
Figure 3:
Forest plots of T2 studies show T2 relaxation times at cardiac MRI at 3.0 T in healthy adults. Studies are grouped by vendor and pulse sequences. A, T2 studies performed with a Siemens scanner at 3.0 T using T2-prepared (T2P) sequence, B, T2 studies performed with a Philips scanner at 3.0 T using gradient and spin-echo sequence (GRASE), C, T2 studies performed with a Philips scanner at 3.0 T using T2P sequence. Studies with multiple subgroups are noted by author’s last name, year of publication, and number of patients in each study. CI = confidence interval, N/A = not applicable.

References

    1. Verhaert D, Thavendiranathan P, Giri S, et al. . Direct T2 quantification of myocardial edema in acute ischemic injury. JACC Cardiovasc Imaging 2011;4(3):269–278. - PMC - PubMed
    1. Thavendiranathan P, Walls M, Giri S, et al. . Improved detection of myocardial involvement in acute inflammatory cardiomyopathies using T2 mapping. Circ Cardiovasc Imaging 2012;5(1):102–110. - PMC - PubMed
    1. Roller FC, Harth S, Schneider C, Krombach GA. T1, T2 Mapping and Extracellular Volume Fraction (ECV): Application, Value and Further Perspectives in Myocardial Inflammation and Cardiomyopathies. Rofo 2015;187(9):760–770. - PubMed
    1. Crouser ED, Ono C, Tran T, He X, Raman SV. Improved detection of cardiac sarcoidosis using magnetic resonance with myocardial T2 mapping. Am J Respir Crit Care Med 2014;189(1):109–112. - PMC - PubMed
    1. Salerno M, Kramer CM. Advances in parametric mapping with CMR imaging. JACC Cardiovasc Imaging 2013;6(7):806–822. - PMC - PubMed

Publication types