

Disease-specific phenotypes in iPSC-derived neural stem cells with POLG mutations
- PMID: 32840960
- PMCID: PMC7539330
- DOI: 10.15252/emmm.202012146
Disease-specific phenotypes in iPSC-derived neural stem cells with POLG mutations
Abstract
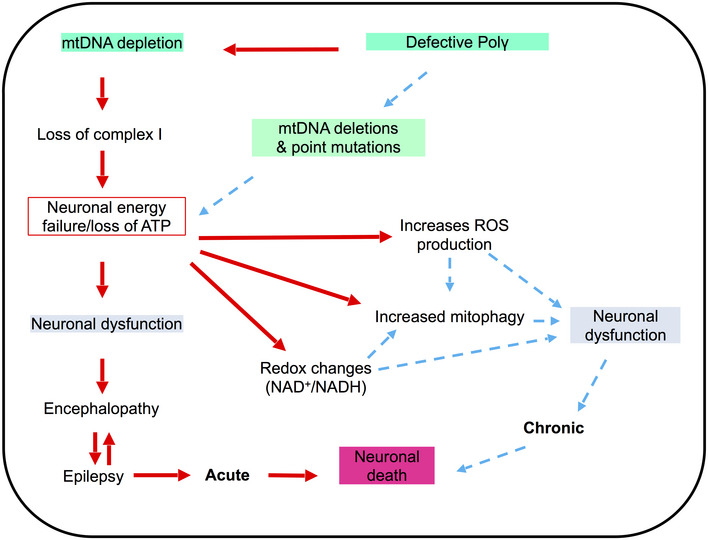
Mutations in POLG disrupt mtDNA replication and cause devastating diseases often with neurological phenotypes. Defining disease mechanisms has been hampered by limited access to human tissues, particularly neurons. Using patient cells carrying POLG mutations, we generated iPSCs and then neural stem cells. These neural precursors manifested a phenotype that faithfully replicated the molecular and biochemical changes found in patient post-mortem brain tissue. We confirmed the same loss of mtDNA and complex I in dopaminergic neurons generated from the same stem cells. POLG-driven mitochondrial dysfunction led to neuronal ROS overproduction and increased cellular senescence. Loss of complex I was associated with disturbed NAD+ metabolism with increased UCP2 expression and reduced phosphorylated SirT1. In cells with compound heterozygous POLG mutations, we also found activated mitophagy via the BNIP3 pathway. Our studies are the first that show it is possible to recapitulate the neuronal molecular and biochemical defects associated with POLG mutation in a human stem cell model. Further, our data provide insight into how mitochondrial dysfunction and mtDNA alterations influence cellular fate determining processes.
Keywords: POLG; mitochondria; mitophagy; neural stem cells; reactive oxygen species.
© 2020 The Authors. Published under the terms of the CC BY 4.0 license.
Conflict of interest statement
The authors declare that they have no conflict of interest.
Figures
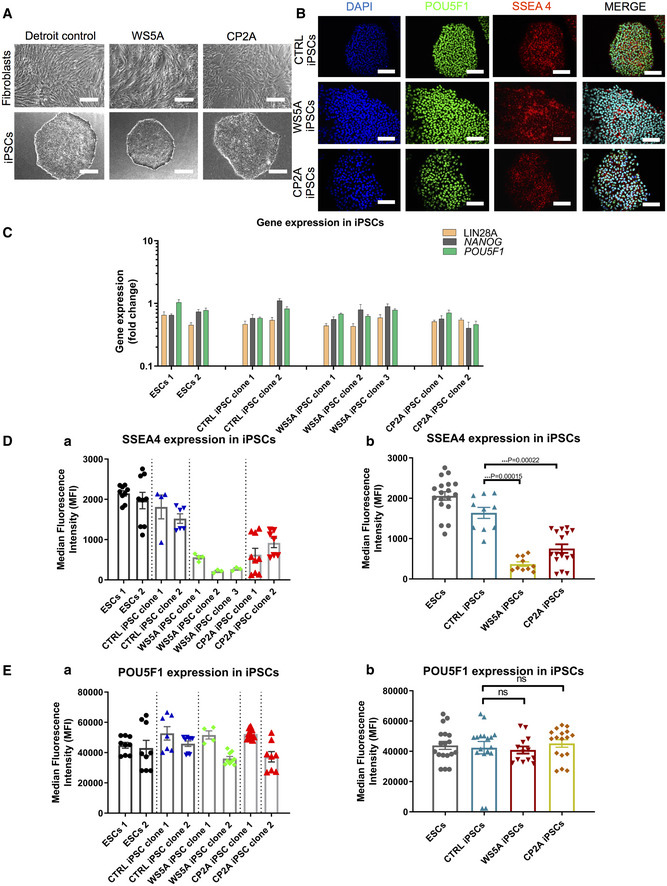
- A
Morphology on phase contrast microscopy for parental fibroblast lines (upper panel) and iPSCs (lower panel) from Detroit 551 control, WS5A, and CP2A POLG patients (scale bars, 50 μm).
- B
Immunofluorescence staining of stem cell markers POU5F1 (green) and SSEA4 (red): upper panel—Detroit 551 control iPSCs, middle panel—WS5A iPSCs, and lower panel—CP2A iPSCs (Scale bar, 100 μm). Nuclei are stained with DAPI (blue).
- C
RT‐qPCR quantification of gene expression for LIN28A, NANOG, and POU5F1 for all iPSCs from Detroit 551 control, WS5A, and CP2A POLG patients (n = 7, technical replicates per line for ESCs; n = 4, technical replicates per clone for control, WS5A, and CP2A iPSCs). The gene expression of the individual clones is assessed with fold change using the comparative ΔΔC t method by normalizing iPSCs to ESC1.
- D, E
Flow cytometric quantification of expression level of SSEA4 (D, n = 9, technical replicates per line for ESCs; n = 5, technical replicates per clone for control iPSCs; n = 3, technical replicates per clone for WS5A iPSCs, n = 8, technical replicates per clone for CP2A iPSCs) and POU5F1 (E, n = 9, technical replicates per line for ESCs; n = 5, technical replicates per clone for control iPSCs; n = 3, technical replicates per clone for WS5A iPSCs, n = 8, technical replicates per clone for CP2A iPSCs) for ESCs and iPSCs for both ESC control lines and iPSCs generated from Detroit 551 control, WS5A and CP2A fibroblasts.
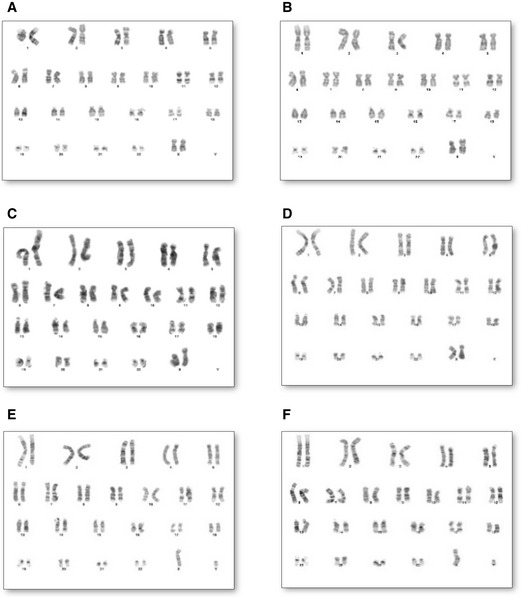
- A, C, E
Representative karyotypes for Detroit 551 control fibroblasts (A) and WS5A and CP2A POLG fibroblasts (C, E).
- B, D, F
Representative karyotypes for control iPSC line (B) and POLG iPSC lines (D, F).
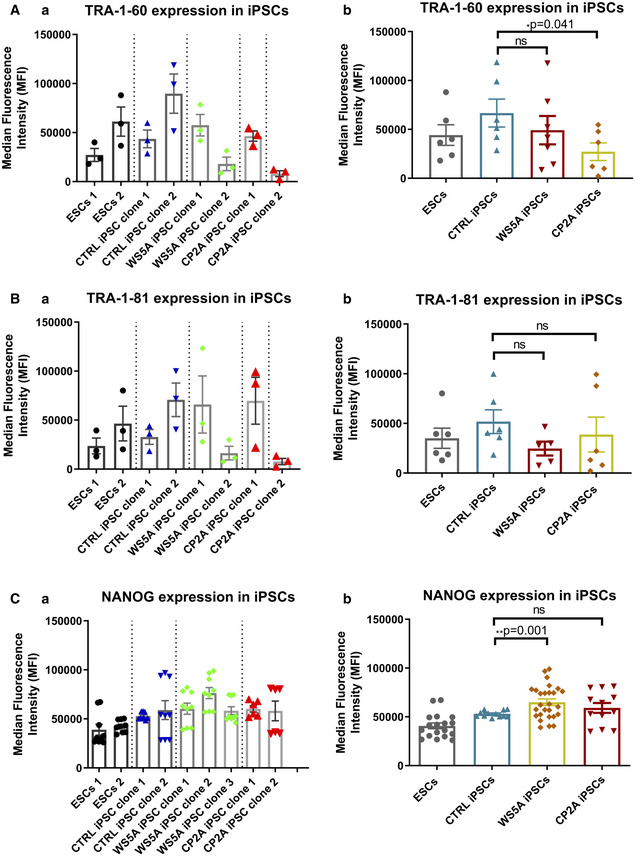
- A–C
Flow cytometric analysis of expression level of pluripotency markers TRA‐1-60 (A, n = 3, technical replicates per line/clone), TRA‐1-81 (B, n = 3, technical replicates per line/clone), and NANOG (C, n = 9, technical replicates per line/clone for ESCs, control, and WS5A iPSCs; n = 6, technical replicates per clone for CP2A iPSCs) in ESC and iPSC lines. Data are demonstrated as individual clones (left panel, a) and combination as a group for ESCs, CTRL iPSCs, and WS5A and CP2A patient lines (right panel, b).
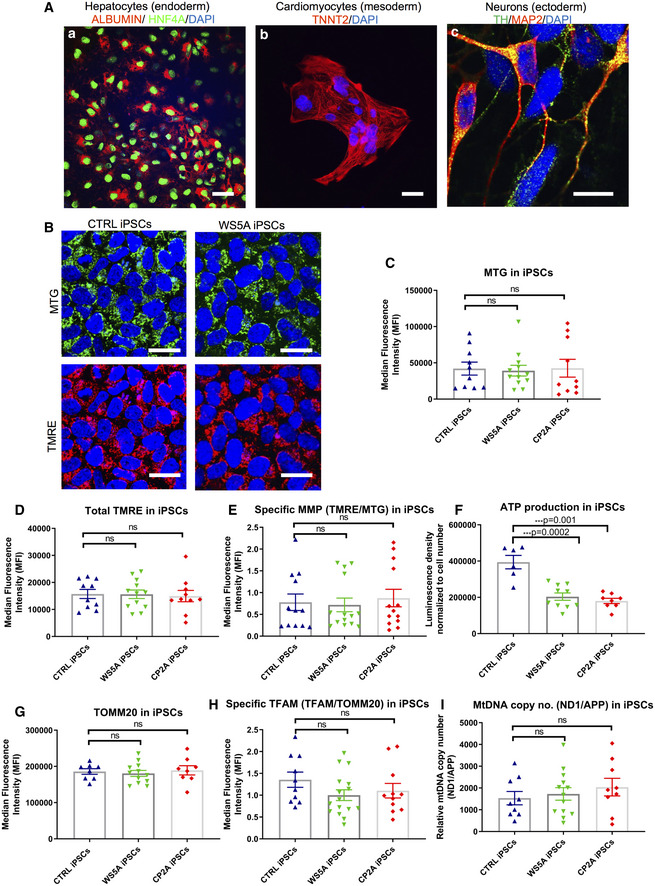
- A
Representative confocal images of iPSC lineage‐specific differentiation into germ layers of endoderm‐derived hepatocytes with positive expression of ALBUMIN (red) and HNF4A (green) (a) (scale bar, 100 μm), mesodermal‐derived cardiomyocytes with positive expression of TNNT2 (red) (b) (scale bar, 100 μm), and ectodermal‐derived dopaminergic neurons with positive expression of TH (green) and MAP2 (red) (c) (scale bar, 10 μm). Nuclei are stained with DAPI (blue).
- B
Confocal images of mitochondrial morphology for iPSC lines with co‐staining of MTG (upper panel) and TMRE (lower panel) (scale bars, 25 μm). Nuclei are stained with DAPI (blue).
- C–E
Flow cytometric analysis of iPSCs generated from Detroit 551, WS5A, and CP2A fibroblasts for mitochondrial volume (MTG) (C, n = 6, technical replicates per clone for control and CP2A; n = 5, technical replicates per clone for WS5A), total MMP (TMRE) (D, n = 6, technical replicates per clone for control and CP2A; n = 5, technical replicates per clone for WS5A) and specific MMP (E, n = 6, technical replicates per clone for control and CP2A; n = 5, technical replicates per clone for WS5A) calculated by dividing median fluorescence intensity (MFI) for total TMRE expression by MTG.
- F
Intracellular ATP production in iPSCs generated from Detroit 551, WS5A, and CP2A fibroblasts (n = 3, technical replicates per clone for control and WS5A; n = 4, technical replicates per clone for CP2A).
- G, H
Flow cytometric analysis of TOMM20 expression level (G, n = 4, technical replicates per clone) and specific TFAM level (total TFAM/TOMM20) (H, n = 4, technical replicates per clone).
- I
Relative mtDNA copy number in Detroit 551, WS5A and CP2A iPSCs by RT‐qPCR analysis using ND1 and APP (n = 5, technical replicates per clone for control; n = 5, technical replicates per clone for WS5A and CP2A). Values are presented as Log2 of the ratio between the expression values of ND1 in relation to APP.
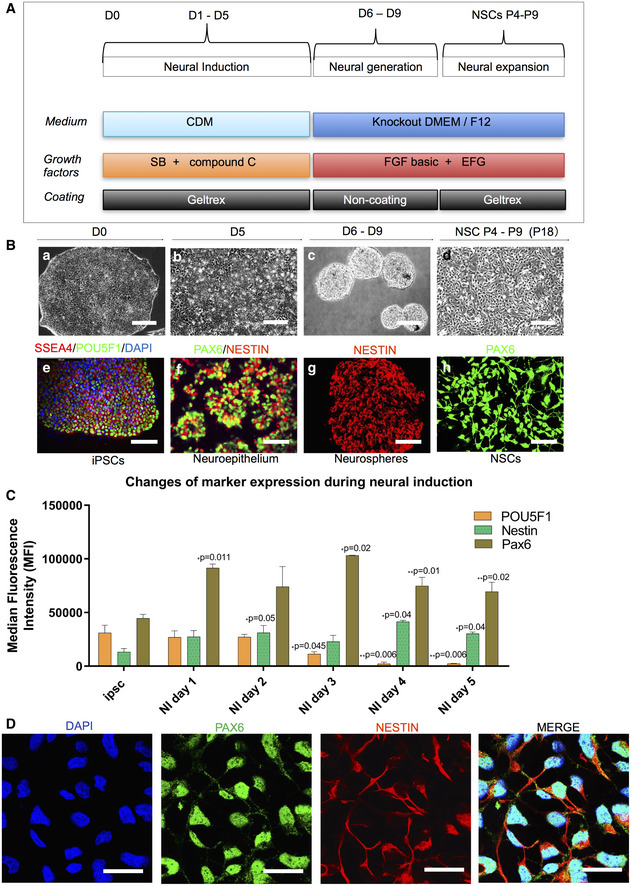
- A
Schematic of dual differentiation and seeding paradigm for NSCs via the dual SMAD protocol.
- B
Representative phase contrast images (upper panel) and immunostaining for specific stages during neural induction from iPSCs to NSCs. Upper panel displays the morphology in culture of different cell types during neural induction to NSCs from iPSCs including iPSCs (a); neuroepithelium with rosette‐like structures (b); neurospheres with defined round shapes in suspension culture (c); and NSCs in monolayers (d) (scale bars, 50 μm). Lower panel demonstrates the representative phase contrast images for the immunostaining corresponding to the specific stages in the upper panel: iPSCs with positive staining of SSEA4 (red) and POU5F1 (green) (e) (scale bar, 50 μm); neuroepithelium with rosette‐like structures with positive staining of PAX6 (green) and NESTIN (red) (f) (scale bar, 50 μm); neurospheres with positive staining of NESTIN (red) (g) (scale bar, 100 μm); NSCs with positive staining of PAX6 (green) (h) (scale bar, 50 μm).
- C
Flow cytometric assessment of stemness marker POU5F1 and NSC markers NESTIN and PAX6 during neural induction from day 0 to day 5 (n = 3, technical replicates).
- D
Representative images of the immunofluorescent labeling for NSC markers SOX2 (green) and NESTIN (red) (scale bar, 25 μm) from Detroit 551 control iPSC‐derived NSCs. Nuclei are stained with DAPI (blue).
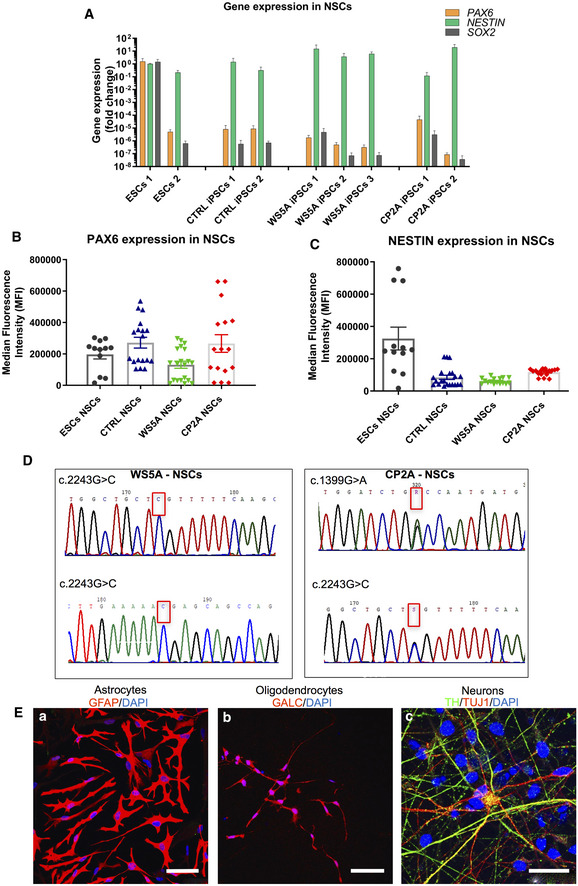
- A
Quantification of gene expression for NSC markers PAX6, NESTIN, and SOX2 for all NSCs from RT‐qPCR analysis. The expression of the neural stem cell markers is assessed with fold change using the comparative ΔΔC t method by normalizing NSCs to iPSCs (n = 3, technical replicates per ESC line or iPSC clone).
- B, C
Quantification of protein expression level for PAX6 (B, n = 6, technical replicates per line for ESCs; n = 7, technical replicates per clone for control; n = 8, technical replicates per clone for WS5A; n = 9, technical replicates per clone for CP2A) and NESTIN (C, n = 6, technical replicates per line for ESCs; n = 7, technical replicates per clone for control; n = 8, technical replicates per clone for WS5A; n = 9, technical replicates per clone for CP2A) for iPSC‐derived NSCs using flow cytometry.
- D
Sequencing chromatogram showing the homozygous c.2243G>C variation in POLG in WS5A iPSC‐derived NSCs and the heterozygous c.1399G>A and c.2243G>C variation in POLG in CP2A iPSC‐derived NSCs.
- E
Representative confocal images showing glial and neuronal lineages derived from NSCs. (a) Immunostaining of NSC‐derived astrocytes with GFAP (red) staining (scale bar, 50 μm). (b) Immunostaining of oligodendrocytes showing GALC (red)‐positive labeling (scale bar, 50 μm). (c) Dopaminergic neurons showing TH (green) and TUJ1 (red)‐positive staining (scale bar, 25 μm). Nuclei are stained with DAPI (blue).
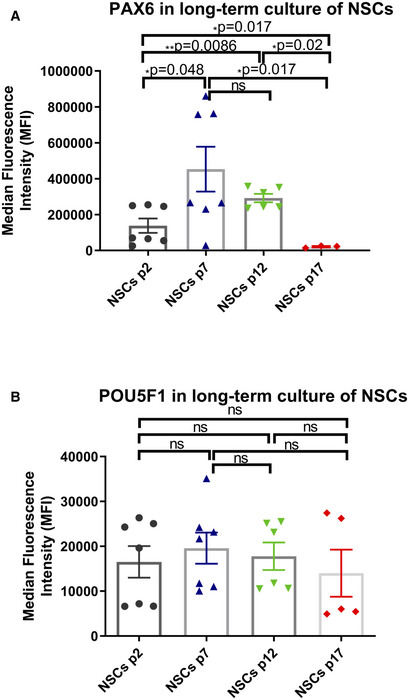
- A, B
Representative bar graphs of NSC marker PAX6 (A, n = 7, technical replicates for p2; n = 6, technical replicates for p7, 12; n = 3, technical replicates for p17) and pluripotency marker POU5F1 (B, n = 7, technical replicates for p2; n = 6, technical replicates for p7, 12; n = 3, technical replicates for p17) in different passages during long‐term NSC culture using flow cytometric analysis.
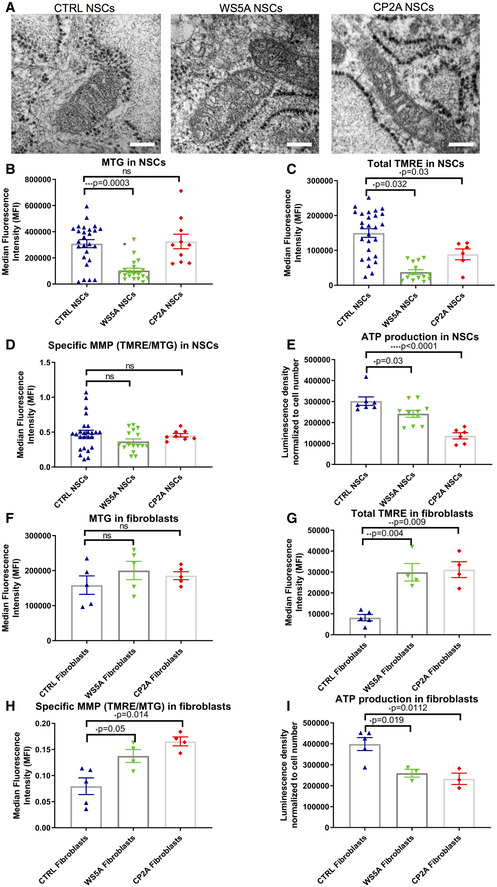
- A
Representative transmission electron microscopy images of mitochondrial structures in Detroit 551 control, WS5A, and CP2A NSCs (scale bar, 400 nm).
- B–D
Flow cytometric analysis of mitochondrial volume (MTG) (B, n = 5, technical replicates per clone), total MMP (TMRE) (C, n = 5, technical replicates per clone), and specific MMP (D, n = 5, technical replicates per clone), calculated by dividing median fluorescence intensity (MFI) for total TMRE expression by MTG in NSCs generated from control lines, WS5A, and CP2A iPSCs.
- E
Intracellular ATP production in NSCs (n = 3, technical replicates per clone).
- F–H
Flow cytometric analysis of mitochondrial volume (MTG) (F, n = 6, technical replicates for control; n = 5, technical replicates for WS5A and CP2A), total MMP (TMRE) (G, n = 5, technical replicates for control; n = 4, technical replicates for WS5A and CP2A), and specific MMP (TMRE/MTG) (H, n = 5, technical replicates for control; n = 4, technical replicates for WS5A and CP2A) in Detroit 551, WS5A, and CP2A fibroblasts.
- I
Intracellular ATP production in Detroit 551, WS5A, and CP2A fibroblasts (n = 6, technical replicates for control; n = 3, technical replicates for WS5A and CP2A).
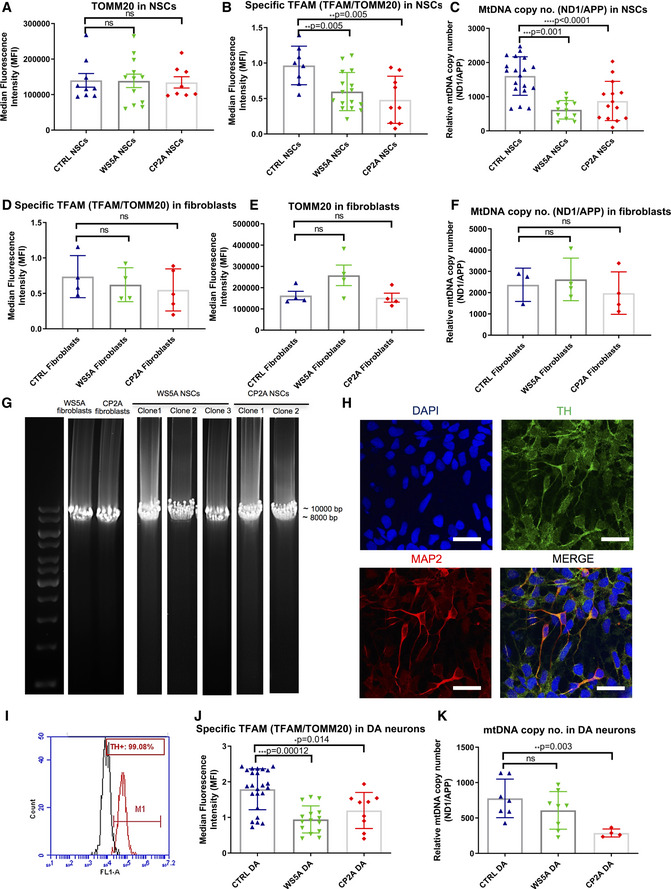
- A, B
Flow cytometric analysis of TOMM20 (A, n = 3, technical replicates per clone for control; n = 4, technical replicates per clone for WS5A and CP2A) and TFAM protein expression (B, n = 3, technical replicates per clone for control and CP2A; n = 5, technical replicates per clone for WS5A) in NSCs. Expressed as specific TFAM level (total TFAM/TOMM20).
- C
Relative mtDNA copy number analyzed by RT‐qPCR using primers and fluorogenic probes for regions of ND1 and nuclear gene APP in all NSCs (n = 4, technical replicates per clone for control; n = 5, technical replicates per clone for WS5A; n = 7, technical replicates per clone for CP2A).
- D, E
Flow cytometric analysis of TOMM20 expression level (D, n = 4, technical replicates per clone) and TFAM protein expression (E, n = 4, technical replicates for control and WS5A; n = 5, technical replicates for CP2A) in fibroblasts. Expressed as specific TFAM level (total TFAM/TOMM20).
- F
Relative mtDNA copy number analyzed by RT‐qPCR for regions of ND1 and nuclear gene APP in fibroblasts (n = 3, technical replicates for control; n = 4, technical replicates for WS5A and CP2A).
- G
Long‐PCR for detection of mtDNA deletions in NSCs and their parental fibroblasts from WS5A and CP2A patients.
- H
Representative images of confocal microscopy with immunofluorescence labeling of DA neuron‐specific marker TH (green) and neuron‐specific marker MAP2 (red) for iPSC‐derived DA neurons (scale bars, 25 μm). Nuclei are stained with DAPI (blue).
- I
Histogram of the positive cell population stained with DA marker TH in iPSC‐derived DA neurons using flow cytometric analysis.
- J
Flow cytometric measurement of specific TFAM level (total TFAM/TOMM20) in iPSC‐derived DA neurons from Detroit 551 control, WS5A, and CP2A POLG patients (n = 8, technical replicates per clone for control; n = 5, technical replicates per clone for WS5A; n = 4, technical replicates per clone for CP2A).
- K
Relative mtDNA copy number analyzed by RT‐qPCR for regions of ND1 and nuclear gene APP in all iPSC‐derived DA neurons (n = 3, technical replicates per clone).
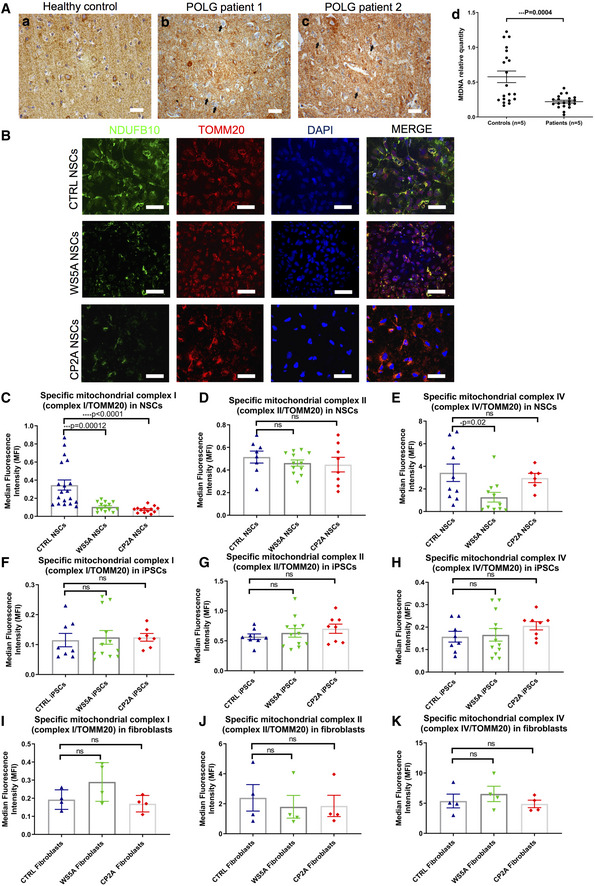
- A
Complex I immunohistochemistry in the occipital cortex of a neurologically healthy control (a) and two patients with POLG disease (b and c) (Scale bar, 20 μm). Patients have numerous complex I‐negative neurons (examples marked by arrows). (d) mtDNA relative quantification in microdissected neurons from the occipital cortex of patients with POLG diseases (n = 5) and neurologically healthy controls (n = 5). Each point represents the mean value of three technical replicates from a pooled sample of 10 neurons. For the purposes of comparison, a control sample has been arbitrarily set to one. The medians of the two groups are compared by Mann–Whitney U‐test. Data are presented as mean (horizontal bars) ± SEM (vertical bars).
- B
Representative confocal images of immunostaining for mitochondrial complex I subunit NDUFB10 (green) and TOMM20 (red) in control, WS5A, and CP2A NSCs (scale bars, 50 μm). Nuclei are stained with DAPI (blue).
- C–E
Flow cytometric measurements of mitochondrial complex I (C, n = 4, technical replicates per clone), II (D, n = 3, technical replicates per clone for control; n = 4, technical replicates per clone for WS5A and CP2A) and IV (E, n = 3, technical replicates per clone for control and CP2A; n = 4, technical replicates per clone for WS5A) protein level in iPSC‐derived NSCs. Expressed as specific complex I, II, and IV level (total complex I, II, IV level/TOMM20).
- F–H
Flow cytometric measurements of mitochondrial complex I (F, n = 4, technical replicates per clone), II (G, n = 4, technical replicates per clone) and IV (H, n = 4, technical replicates per clone) protein level in iPSCs. Expressed as specific complex I, II, and IV level.
- I–K
Flow cytometric measurements of mitochondrial complex I (I, n = 4, technical replicates), II (J, n = 4, technical replicates), and IV (K, n = 4, technical replicates) protein level in parental fibroblasts expressed as specific complex I, II, and IV level.
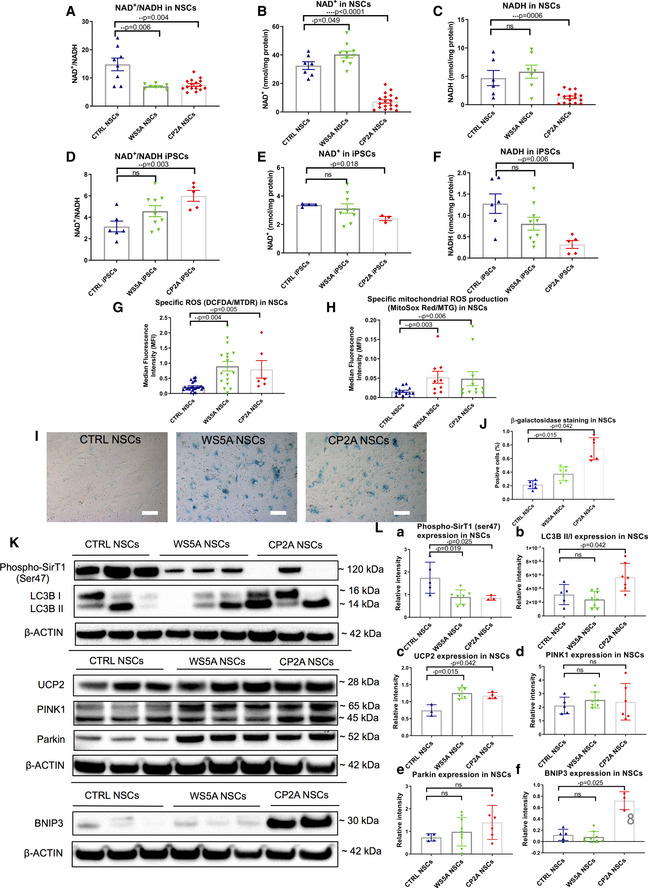
- A–C
LC‐MS-based metabolomics for quantitative measurements of NAD+/NADH ratio (A, n = 3, technical replicates per clone), NAD+ (B, n = 3, technical replicates per clone), and NADH (C, n = 3, technical replicates per clone) level in NSCs.
- D–F
LC‐MS-based metabolomics for quantitative measurement of NAD+/NADH ratio (D, n = 3, technical replicates per clone), NAD+ (E, n = 3, technical replicates per clone), and NADH (F, n = 3, technical replicates per clone) level in iPSCs.
- G
Intracellular ROS production measurements of the specific ROS level calculated by total ROS/MTDR in control, WS5A, and CP2A iPSC‐derived NSCs using DCFDA and MTDR (n = 6, technical replicates per clone for control; n = 5, technical replicates per clone for WS5A; n = 3, technical replicates per clone for CP2A).
- H
Flow cytometric measurements of mitochondrial ROS production at the specific ROS level in Detroit 551, WS5A, and CP2A iPSC‐derived NSCs calculated by total ROS (MitoSox Red)/MTG (n = 4, technical replicates per clone for control and CP2A; n = 3, technical replicates per clone for WS5A).
- I, J
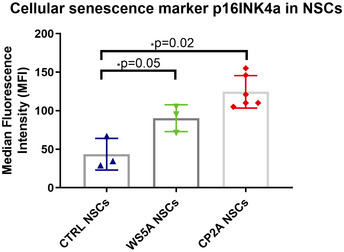
Representative images of senescence β‐galactosidase staining (scale bars, 20 μm) (I) and quantification by calculating the percentage of positively stained cells by division of the negative cells from I (J, n = 3, technical replicates per clone).
- K, L
Representative images (K) and quantification (L) for western blotting with Phospho‐SirT1 (Ser47), LC3B, UCP2, PINK1, Parkin, BNIP3, and β‐ACTIN. Three independent experiments are included.
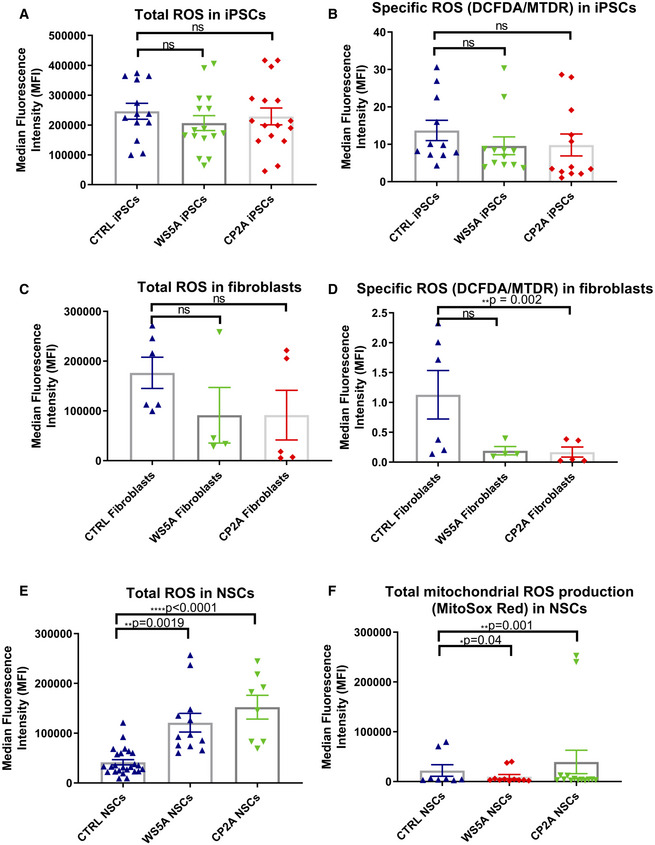
- A, B
Intracellular ROS production measurements of the total ROS (DFCDA) level (A, n = 7, technical replicates per clone for control; n = 5, technical replicates per clone for WS5A; n = 8, technical replicates per clone for CP2A) and specific ROS level (B, n = 7, technical replicates per clone for control; n = 5, technical replicates per clone for WS5A; n = 8, technical replicates per clone for CP2A) calculated by total DCFDA/MTDR in iPSCs.
- C, D
Total intracellular ROS (C, n = 6, technical replicates for control; n = 4, technical replicates for WS5A; n = 5, technical replicates for CP2A) and specific ROS (D, n = 6, technical replicates for control; n = 4, technical replicates for WS5A; n = 5, technical replicates for CP2A) production measurements in fibroblasts.
- E, F
Intracellular ROS production measurements of the total ROS level (E, n = 6, technical replicates per clone for control; n = 5, technical replicates per clone for WS5A; n = 4, technical replicates per clone for CP2A) and mitochondrial ROS level (F, n = 6, technical replicates per clone for control; n = 5, technical replicates per clone for WS5A; n = 4, technical replicates per clone for CP2A) in NSCs.
Similar articles
-
N-acetylcysteine amide ameliorates mitochondrial dysfunction and reduces oxidative stress in hiPSC-derived dopaminergic neurons with POLG mutation.Exp Neurol. 2021 Mar;337:113536. doi: 10.1016/j.expneurol.2020.113536. Epub 2020 Nov 29. Exp Neurol. 2021. PMID: 33264635
-
Deoxyribonucleoside treatment rescues EtBr-induced mtDNA depletion in iPSC-derived neural stem cells with POLG mutations.FASEB J. 2023 Sep;37(9):e23139. doi: 10.1096/fj.202300650RR. FASEB J. 2023. PMID: 37584631
-
POLG genotype influences degree of mitochondrial dysfunction in iPSC derived neural progenitors, but not the parent iPSC or derived glia.Exp Neurol. 2023 Jul;365:114429. doi: 10.1016/j.expneurol.2023.114429. Epub 2023 Apr 25. Exp Neurol. 2023. PMID: 37105450
-
A brief review on human mtDNA mutations and NRTI-associated mtDNA toxicity and mutations.Mitochondrial DNA A DNA Mapp Seq Anal. 2016 May;27(3):1685-7. doi: 10.3109/19401736.2014.958728. Epub 2014 Sep 11. Mitochondrial DNA A DNA Mapp Seq Anal. 2016. PMID: 25211089 Review.
-
Concise Review: Heteroplasmic Mitochondrial DNA Mutations and Mitochondrial Diseases: Toward iPSC-Based Disease Modeling, Drug Discovery, and Regenerative Therapeutics.Stem Cells. 2016 Apr;34(4):801-8. doi: 10.1002/stem.2292. Epub 2016 Feb 13. Stem Cells. 2016. PMID: 26850516 Review.
Cited by
-
Exploring a new mechanism between lactate and VSMC calcification: PARP1/POLG/UCP2 signaling pathway and imbalance of mitochondrial homeostasis.Cell Death Dis. 2023 Sep 7;14(9):598. doi: 10.1038/s41419-023-06113-3. Cell Death Dis. 2023. PMID: 37679327 Free PMC article.
-
Mitophagy mediated by BNIP3 and NIX protects against ferroptosis by downregulating mitochondrial reactive oxygen species.Cell Death Differ. 2024 May;31(5):651-661. doi: 10.1038/s41418-024-01280-y. Epub 2024 Mar 22. Cell Death Differ. 2024. PMID: 38519771 Free PMC article.
-
Evidence of the Cellular Senescence Stress Response in Mitotically Active Brain Cells-Implications for Cancer and Neurodegeneration.Life (Basel). 2021 Feb 17;11(2):153. doi: 10.3390/life11020153. Life (Basel). 2021. PMID: 33671362 Free PMC article. Review.
-
Characterization of mitochondrial health from human peripheral blood mononuclear cells to cerebral organoids derived from induced pluripotent stem cells.Sci Rep. 2021 Feb 25;11(1):4523. doi: 10.1038/s41598-021-84071-6. Sci Rep. 2021. PMID: 33633238 Free PMC article.
-
POLG mutations lead to abnormal mitochondrial remodeling during neural differentiation of human pluripotent stem cells via SIRT3/AMPK pathway inhibition.Cell Cycle. 2022 Jun;21(11):1178-1193. doi: 10.1080/15384101.2022.2044136. Epub 2022 Mar 17. Cell Cycle. 2022. PMID: 35298342 Free PMC article.
References
-
- Amat R, Solanes G, Giralt M, Villarroya F (2007) SIRT1 is involved in glucocorticoid‐mediated control of uncoupling protein‐3 gene transcription. J Biol Chem 282: 34066–34076 - PubMed
-
- Bellin M, Marchetto MC, Gage FH, Mummery CL (2012) Induced pluripotent stem cells: the new patient? Nat Rev Mol Cell Biol 13: 713–726 - PubMed
Publication types
MeSH terms
Substances
Grants and funding
LinkOut - more resources
Full Text Sources
