. 2020 Oct;13(5):396-405.
doi: 10.1161/CIRCGEN.120.002929. Epub 2020 Aug 25.

Spatial and Functional Distribution of MYBPC3 Pathogenic Variants and Clinical Outcomes in Patients With Hypertrophic Cardiomyopathy

Affiliations

Spatial and Functional Distribution of MYBPC3 Pathogenic Variants and Clinical Outcomes in Patients With Hypertrophic Cardiomyopathy

Adam S Helms et al. Circ Genom Precis Med. 2020 Oct.

Abstract

Background: Pathogenic variants in MYBPC3, encoding cardiac MyBP-C (myosin binding protein C), are the most common cause of familial hypertrophic cardiomyopathy. A large number of unique MYBPC3 variants and relatively small genotyped hypertrophic cardiomyopathy cohorts have precluded detailed genotype-phenotype correlations.

Methods: Patients with hypertrophic cardiomyopathy and MYBPC3 variants were identified from the Sarcomeric Human Cardiomyopathy Registry. Variant types and locations were analyzed, morphological severity was assessed, and time-event analysis was performed (composite clinical outcome of sudden death, class III/IV heart failure, left ventricular assist device/transplant, atrial fibrillation). For selected missense variants falling in enriched domains, myofilament localization and degradation rates were measured in vitro.

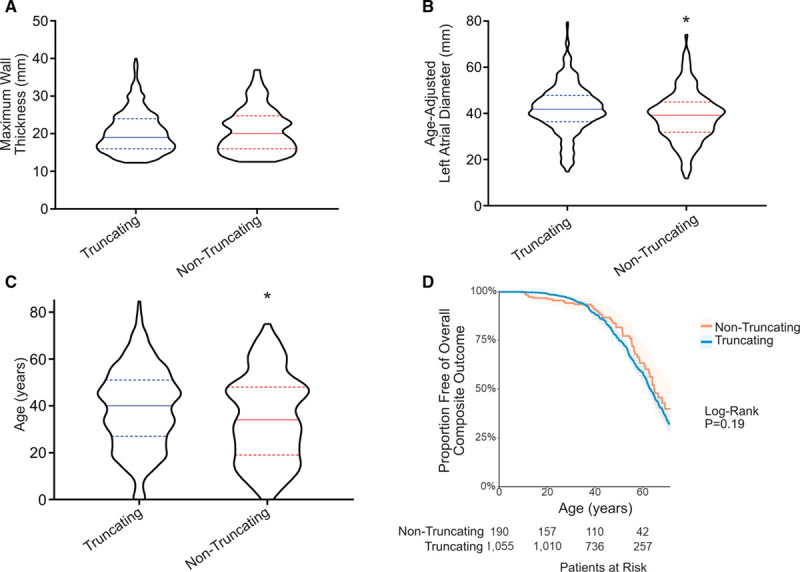
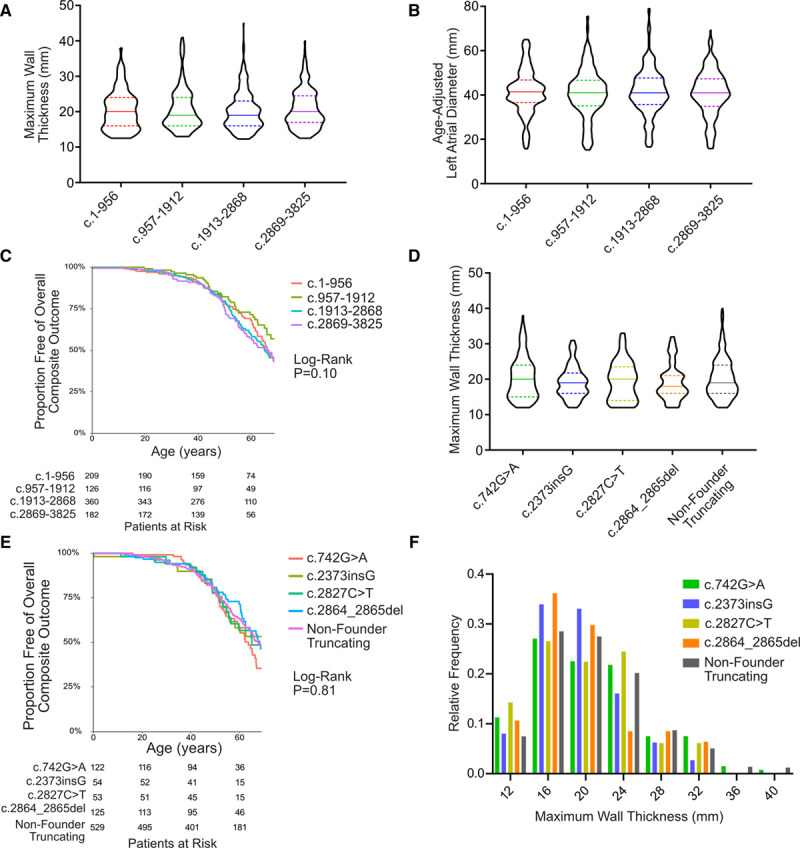
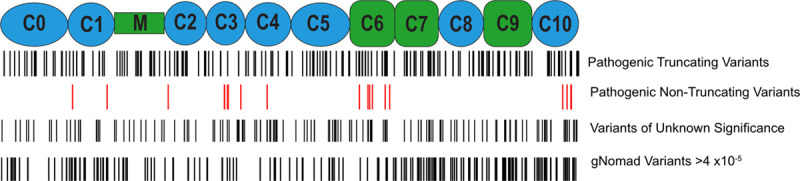
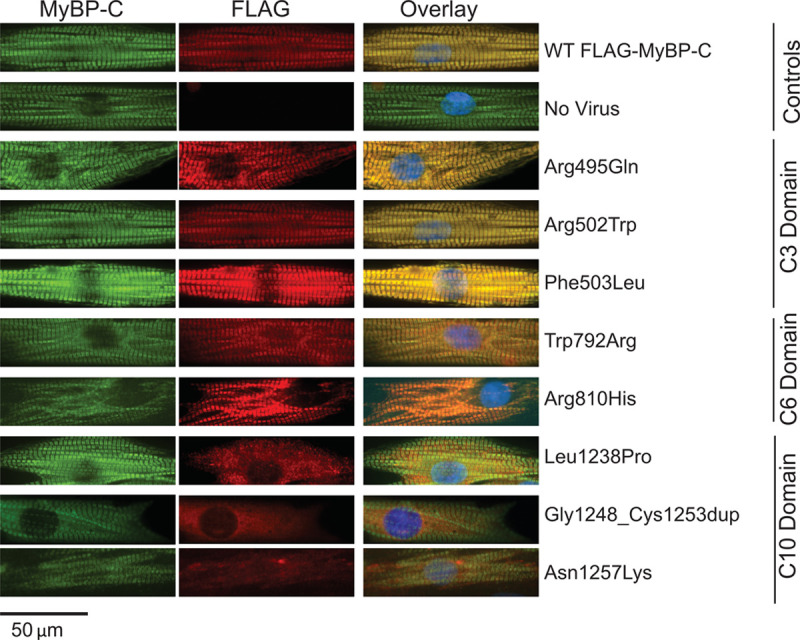
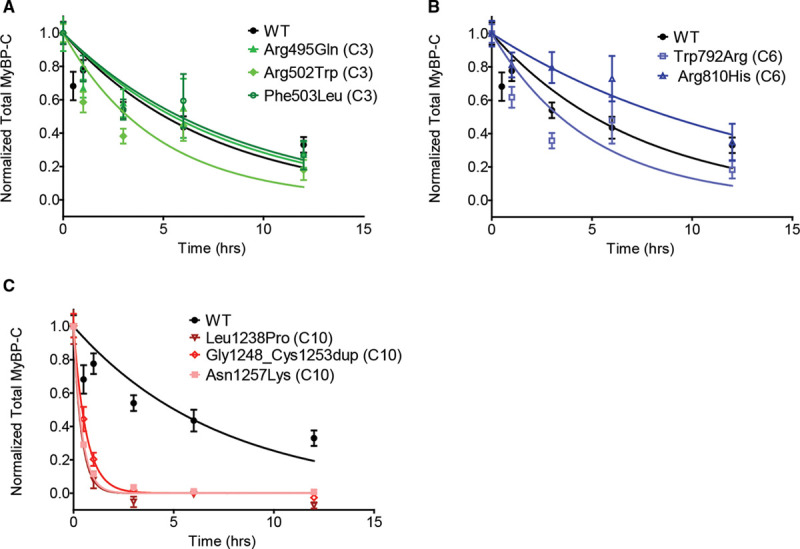
Results: Among 4756 genotyped patients with hypertrophic cardiomyopathy in Sarcomeric Human Cardiomyopathy Registry, 1316 patients were identified with adjudicated pathogenic truncating (N=234 unique variants, 1047 patients) or nontruncating (N=22 unique variants, 191 patients) variants in MYBPC3. Truncating variants were evenly dispersed throughout the gene, and hypertrophy severity and outcomes were not associated with variant location (grouped by 5'-3' quartiles or by founder variant subgroup). Nontruncating pathogenic variants clustered in the C3, C6, and C10 domains (18 of 22, 82%, P<0.001 versus Genome Aggregation Database common variants) and were associated with similar hypertrophy severity and adverse event rates as observed with truncating variants. MyBP-C with variants in the C3, C6, and C10 domains was expressed in rat ventricular myocytes. C10 mutant MyBP-C failed to incorporate into myofilaments and degradation rates were accelerated by ≈90%, while C3 and C6 mutant MyBP-C incorporated normally with degradation rate similar to wild-type.

Conclusions: Truncating variants account for 91% of MYBPC3 pathogenic variants and cause similar clinical severity and outcomes regardless of location, consistent with locus-independent loss-of-function. Nontruncating MYBPC3 pathogenic variants are regionally clustered, and a subset also cause loss of function through failure of myofilament incorporation and rapid degradation. Cardiac morphology and clinical outcomes are similar in patients with truncating versus nontruncating variants.

Keywords: actins; genotype; hypertrophic cardiomyopathy; myosin; sarcomere.


Figures

Figure 1.
Figure 1.
MYBPC3 nontruncating pathogenic variants cause similar phenotypic severity and adverse event rates as truncating variants. A, Distributions in maximum wall thickness demonstrate broad phenotypic variance and similarity between truncating and nontruncating MYBPC3 pathogenic variant groups. Data is shown in violin plots with median and interquartile range. B, Average age-adjusted left atrial diameter was smaller among nontruncating pathogenic variant carriers. C, Broad variability in disease severity is reflected by range in age of diagnosis in both MYBPC3 groups, with a modestly lower average age of diagnosis among nontruncating pathogenic variant carriers. D, Kaplan-Meier survival analysis shows no difference in the composite adverse event rate from time of birth between truncating and nontruncating pathogenic variant groups. Composite outcome consisted of first occurrence of any of the following: sudden cardiac death, resuscitated cardiac arrest, appropriate implantable cardioverter-defibrillator therapy, cardiac transplantation, left ventricle (LV) assist device implantation, LV ejection fraction <35%, or New York Heart Association class III/IV symptoms, atrial fibrillation (AF), stroke, or death.
Figure 2.
Figure 2.
MYBPC3 truncating pathogenic variants cause similar phenotypic severity regardless of variant locus or type. A and B, Truncating MYBPC3 variants were categorized by locus quartiles within the gene to examine whether N-terminal or C-terminal truncations exert different effect sizes. No difference in extent of hypertrophy (A) or left atrial diameter (B) are observed. C and D, Four founder populations within Sarcomeric Human Cardiomyopathy Registry (SHaRe) were compared with determine whether phenotypic severity is different in the setting of these 4 distinct truncating variant types (c.742G>A=exonic splice variant, c.2373insG=frameshift, c.2827C>T=nonsense, c.2864_2865del=frameshift). No difference was observed either in the variance/distribution of hypertrophy (C) or in the magnitude of hypertrophy (D).
Figure 3.
Figure 3.
Distribution of MYBPC3 pathogenic variants, variants of unknown significance, and common Genome Aggregation Database (gnomAD) variants relative to MyBP-C (myosin binding protein C) protein domains. Truncating MYBPC3 pathogenic variants are dispersed homogeneously throughout the gene, while nontruncating pathogenic variants exhibit clustering in the C3, C6, and C10 domains (18 of 22, 82%). Nontruncating variants of unknown significance are dispersed throughout the gene, as are gnomAD common variants (ie, allele frequency >4×10⁻⁵).
Figure 4.
Figure 4.
Nontruncating MyBP-C (myosin binding protein C) mutant protein localizes to the myofilament for C3 and C6 domain mutants but does not incorporate into myofilaments for C10 domain mutants. To determine whether mutant MyBP-C proteins integrate normally into the myofilaments, both FLAG-tagged control and mutant constructs were cloned into an adenoviral vector that was then used to transduce neonatal rat ventricular myocytes (NRVMs). Forty-eight hours following transduction, NRVMs were immunofluorescently labeled with an anti-MyBP-C antibody to detect both endogenous and exogenously expressed MyBP-C (left column) and an anti-FLAG antibody to detect only the transduced MyBP-C (middle column). This system achieved stable integration of FLAG-control MyBP-C into myofilaments (top row) with no FLAG signal detected without viral transduction (second row). Nontruncating mutant MyBP-C for C3 and C6 domain pathogenic variants exhibited normal myofilament integration while C10 mutant MyBP-C exhibited poor or no myofilament localization.
Figure 5.
Figure 5.
Nontruncating mutant MyBP-C (myosin binding protein C) degradation rates measured by cyclohexamide pulse chase demonstrate rapid degradation for C10 domain nontruncating mutant MyBP-C. To determine whether nontruncating MYBPC3 pathogenic variants alter protein stability, neonatal rat ventricular myocytes were transduced with adenoviral constructs expressing wild-type (WT) control and nontruncating mutant MyBP-C. Cyclohexamide was administered at 0, 30 min, 1 h, 3 h, 6 h, and 12 h to inhibit protein synthesis and MyBP-C was measured (see Methods in the Data Supplement). Data from 2 or more independent experiments performed in quadruplicate were fit to a first order exponential decay curve. The same control data (from FLAG-labeled wild-type expressed MyBP-C) is depicted on each graph (A–C). A and B, C3 and C6 mutant MyBP-C demonstrates similar degradation rates as control. C, C10 mutant MyBP-C demonstrates rapid degradation compared with control. Data is represented as mean±SEM. The calculated half-lives with 95% CIs are shown in Table 2.

References

    1. Ho CY, Day SM, Ashley EA, Michels M, Pereira AC, Jacoby D, Cirino AL, Fox JC, Lakdawala NK, Ware JS, et al. Genotype and lifetime burden of disease in hypertrophic cardiomyopathy: insights from the sarcomeric human cardiomyopathy registry (SHaRe). Circulation. 2018;138:1387–1398. doi: 10.1161/CIRCULATIONAHA.117.033200 - PMC - PubMed
    1. Previs MJ, Beck Previs S, Gulick J, Robbins J, Warshaw DM. Molecular mechanics of cardiac myosin-binding protein C in native thick filaments. Science. 2012;337:1215–1218. doi: 10.1126/science.1223602 - PMC - PubMed
    1. Previs MJ, Prosser BL, Mun JY, Previs SB, Gulick J, Lee K, Robbins J, Craig R, Lederer WJ, Warshaw DM. Myosin-binding protein C corrects an intrinsic inhomogeneity in cardiac excitation-contraction coupling. Sci Adv. 2015;1:e1400205 doi: 10.1126/sciadv.1400205 - PMC - PubMed
    1. Van Driest SL, Vasile VC, Ommen SR, Will ML, Tajik AJ, Gersh BJ, Ackerman MJ. Myosin binding protein C mutations and compound heterozygosity in hypertrophic cardiomyopathy. J Am Coll Cardiol. 2004;44:1903–1910. doi: 10.1016/j.jacc.2004.07.045 - PubMed
    1. Alfares AA, Kelly MA, McDermott G, Funke BH, Lebo MS, Baxter SB, Shen J, McLaughlin HM, Clark EH, Babb LJ, et al. Results of clinical genetic testing of 2,912 probands with hypertrophic cardiomyopathy: expanded panels offer limited additional sensitivity. Genet Med. 2015;17:880–8. doi: 10.1038/gim.2014.205 - PubMed

Publication types