. 2020 Sep 17;5(18):e139043.
doi: 10.1172/jci.insight.139043.

Epigenetic silencing of CD4 expression in nonpathogenic SIV infection in African green monkeys

Affiliations

Epigenetic silencing of CD4 expression in nonpathogenic SIV infection in African green monkeys

Joseph C Mudd et al. JCI Insight. .

Abstract

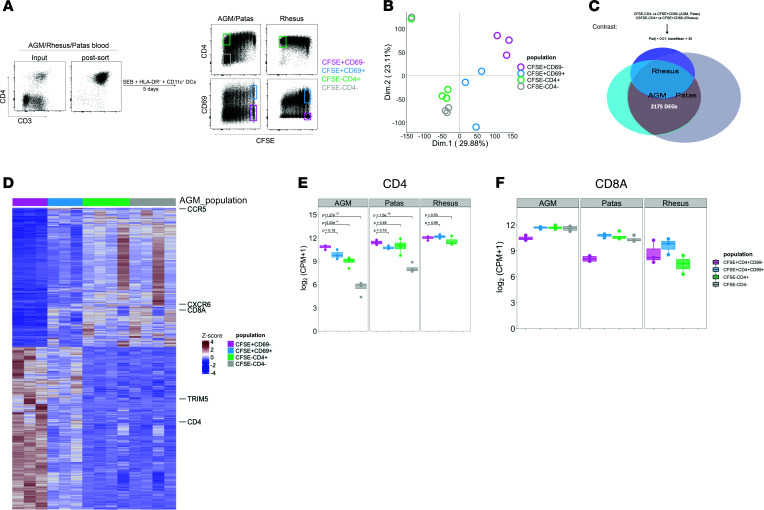
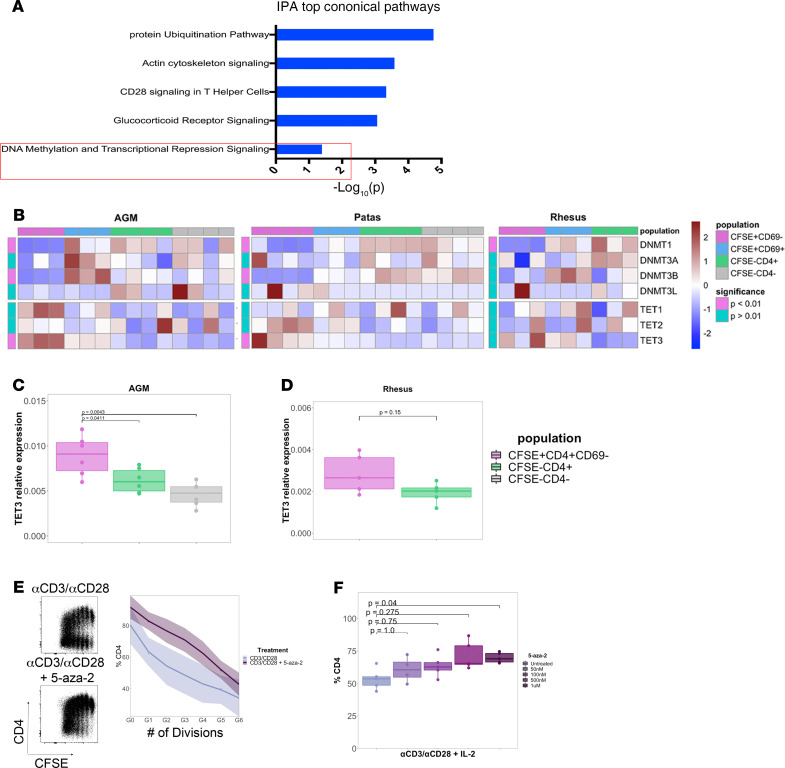
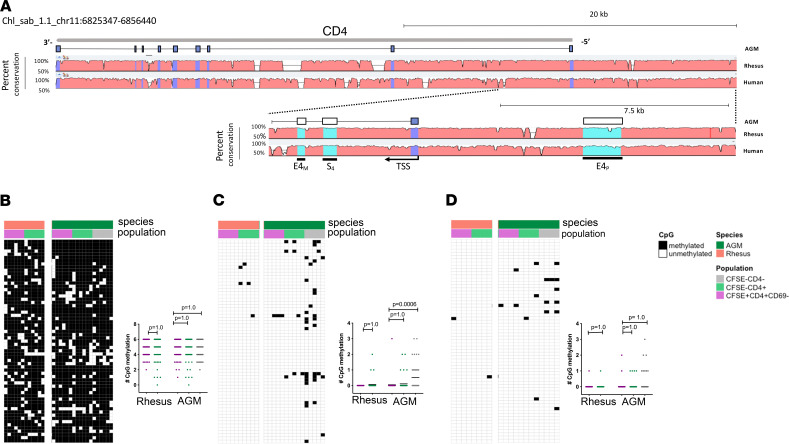
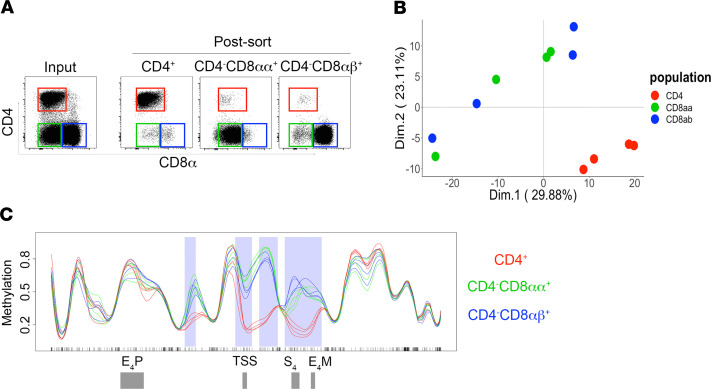
African green monkeys (AGMs) are natural hosts of SIV that postthymically downregulate CD4 to maintain a large population of CD4-CD8aa+ virus-resistant cells with Th functionality, which can result in AGMs becoming apparently cured of SIVagm infection. To understand the mechanisms of this process, we performed genome-wide transcriptional analysis on T cells induced to downregulate CD4 in vitro from AGMs and closely related patas monkeys and T cells that maintain CD4 expression from rhesus macaques. In T cells that downregulated CD4, pathway analysis revealed an atypical regulation of the DNA methylation machinery, which was reversible when pharmacologically targeted with 5-aza-2 deoxycytidine. This signature was driven largely by the dioxygenase TET3, which became downregulated with loss of CD4 expression. CpG motifs within the AGM CD4 promoter region became methylated during CD4 downregulation in vitro and were stably imprinted in AGM CD4-CD8aa+ T cells sorted directly ex vivo. These results suggest that AGMs use epigenetic mechanisms to durably silence the CD4 gene. Manipulation of these mechanisms could provide avenues for modulating SIV and HIV-1 entry receptor expression in hosts that become progressively infected with SIV, which could lead to novel therapeutic interventions aimed to reduce HIV viremia in vivo.

Keywords: AIDS/HIV; Immunology; T cells.


Conflict of interest statement

Conflict of interest: The authors have declared that no conflict of interest exists.

Figures

Figure 1
Figure 1. Uniquely regulated genes in natural host CD4+ T cells induced to downregulate CD4 in vitro.
(A) Representative flow dot plot of purified AGM, patas, or rhesus macaque CD4+ T cells that were exposed to staphylococcus enterotoxin B and HLA-DR+CD11c+ antigen-presenting cells for 5 days. (B) Principal component analysis plot of transcribed genes from AGM CFSE+CD69 (n = 3), CFSE+CD69+ (n = 3), CFSECD4+ (n = 4), CFSECD4 (n = 4) T cell populations, based on transcript counts per million (CPM), calculated by Deseq2. The numbers in parenthesis on each axis represent the percentage of variance that each principle component contributes to the data set. (C) Euler diagram of DEGs in pairwise comparisons of CFSECD4 (AGM, patas) or CFSECD4+ (Rhesus) cells versus the CFSE+CD69CD4+ population of each species. Significant DEGs were calculated by the Wald test and corrected for multiple comparisons (Benjamini-Hochberg) in Deseq2. (D) Heatmap depicting transcript counts of genes common to natural hosts yet unique from rhesus, normalized by row Z-score. Genes known to play a role in disease nonprogression are annotated. Red and blue coloring represent genes that are upregulated and downregulated, respectively. Statistical comparisons of (E) CD4 and (F) CD8A log among sorted populations of AGM, patas, and rhesus. Statistical significance was calculated by the Wald test and corrected for multiple comparisons (Benjamini-Hochberg) in Deseq2.
Figure 2
Figure 2. DNA methylation pathways contribute to CD4 gene silencing in natural hosts.
(A) Top 5 canonical pathways from Ingenuity Pathway Analysis (IPA) of genes unique to natural host cells that are induced to downregulate CD4. P values were calculated by Fisher’s exact test. (B) Heatmaps depicting transcript abundance of genes encoding for proteins involved in DNA methylation of the 3 nonhuman primate species. The scale represents transcript counts normalized by row Z-score. Red and blue coloring represents upregulated and downregulated gene expression, respectively. Comparisons of TET3 gene expression in (C) AGM (n = 6) and (D) rhesus (n = 5) relative to GAPDH assessed by real-time PCR. Statistical significance was calculated by the Mann-Whitney test. (E) Representative flow dot plot and summary data (n= 6) depicting CD4 expression on AGM CD4+ T cells stimulated with anti-CD3/CD2/CD28 microbeads and 25 U/mL IL-2 for 5 days in the presence or absence of 500 nM 5-aza-2 deoxycytidine. (F) Dose response of 5-aza-2 deoxycytidine on CD4 downregulation in AGMs (n= 5). Significance in was determined by the Mann-Whitney test with multiple comparison adjustment by Bonferroni correction.
Figure 3
Figure 3. CD4 downregulation is associated with methylation of the CD4 promoter in AGMs.
(A) Schematic representation of the CD4 locus. Top: Entire CD4 gene locus of AGM + 10,000 base pairs upstream of the transcription start site, with percentage sequence conservation to rhesus and human. Bottom: 15,000–base pair region flanking the CD4 transcription start site encompassing the proximal enhancer (E4p), first exon, silencer (S4), and maturation enhancer (E4M). Percentage sequence conservation to rhesus and human is shown. Heatmaps and summary data of CpG methylation in regions amplified within the (B) E4p, (C) transcription start site, and (D) E4p regulatory elements of CFSE+CD4+CD69, CFSECD4+, and CFSECD4 populations. Each column represents a single CpG dinucleotide found within the given region. Each row represents DNA from a single cell, totaling 63 individual clones from 3 individual animals. Significance in summary data was determined by the Mann-Whitney test with multiple comparison adjustment by Bonferroni correction.
Figure 4
Figure 4. CpG methylation patterns are stably inherited in AGM CD4CD8αα+ T cells.
(A) Representative before and after sort flow dot plots of major T cell populations from AGM splenic samples. (B) Principal component analysis plot of AGM CD4 (n = 4), CD4CD8αα+ (n = 4), CD4CD8αβ+ (n = 4) methylation profiles of CD4 locus capture region, based on CpG methylation frequency determined by Bismark bisulfite read mapper. The numbers in parentheses on each axis represent the percentage of variance that each principle component contributes to the data set. (C) CpG methylation frequency across CD4 locus capture region, depicted by genomic coordinate. Coordinates of CD4 regulatory regions are annotated on bottom track. Shaded areas represent regions of hypermethylation when compared with methylated CpG frequencies in AGM CD4 T cells. Significance was determined by Fisher’s exact test with values listed in Supplemental Table 1.

References

    1. Goldstein S, et al. Plateau levels of viremia correlate with the degree of CD4+-T-cell loss in simian immunodeficiency virus SIVagm-infected pigtailed macaques: variable pathogenicity of natural SIVagm isolates. J Virol. 2005;79(8):5153–5162. doi: 10.1128/JVI.79.8.5153-5162.2005. - DOI - PMC - PubMed
    1. Hirsch VM, et al. Induction of AIDS by simian immunodeficiency virus from an African green monkey: species-specific variation in pathogenicity correlates with the extent of in vivo replication. J Virol. 1995;69(2):955–967. doi: 10.1128/JVI.69.2.955-967.1995. - DOI - PMC - PubMed
    1. Favre D, et al. Critical loss of the balance between Th17 and T regulatory cell populations in pathogenic SIV infection. PLoS Pathog. 2009;5(2):e1000295. doi: 10.1371/journal.ppat.1000295. - DOI - PMC - PubMed
    1. Pandrea, et al. Acute loss of intestinal CD4+ T cells is not predictive of simian immunodeficiency virus virulence. J Immunol. 2007;179(5):3035–3046. doi: 10.4049/jimmunol.179.5.3035. - DOI - PMC - PubMed
    1. Jacquelin B, et al. Nonpathogenic SIV infection of African green monkeys induces a strong but rapidly controlled type I IFN response. J Clin Invest. 2009;119(12):3544–3555. doi: 10.1172/JCI40093. - DOI - PMC - PubMed

Publication types

MeSH terms