

Strategies at points of entry to reduce importation risk of COVID-19 cases and reopen travel
- PMID: 32841354
- PMCID: PMC7499710
- DOI: 10.1093/jtm/taaa141
Strategies at points of entry to reduce importation risk of COVID-19 cases and reopen travel
Abstract
Background: With more countries exiting lockdown, public health safety requires screening measures at international travel entry points that can prevent the reintroduction or importation of the severe acute respiratory syndrome-related coronavirus-2. Here, we estimate the number of cases captured, quarantining days averted and secondary cases expected to occur with screening interventions.
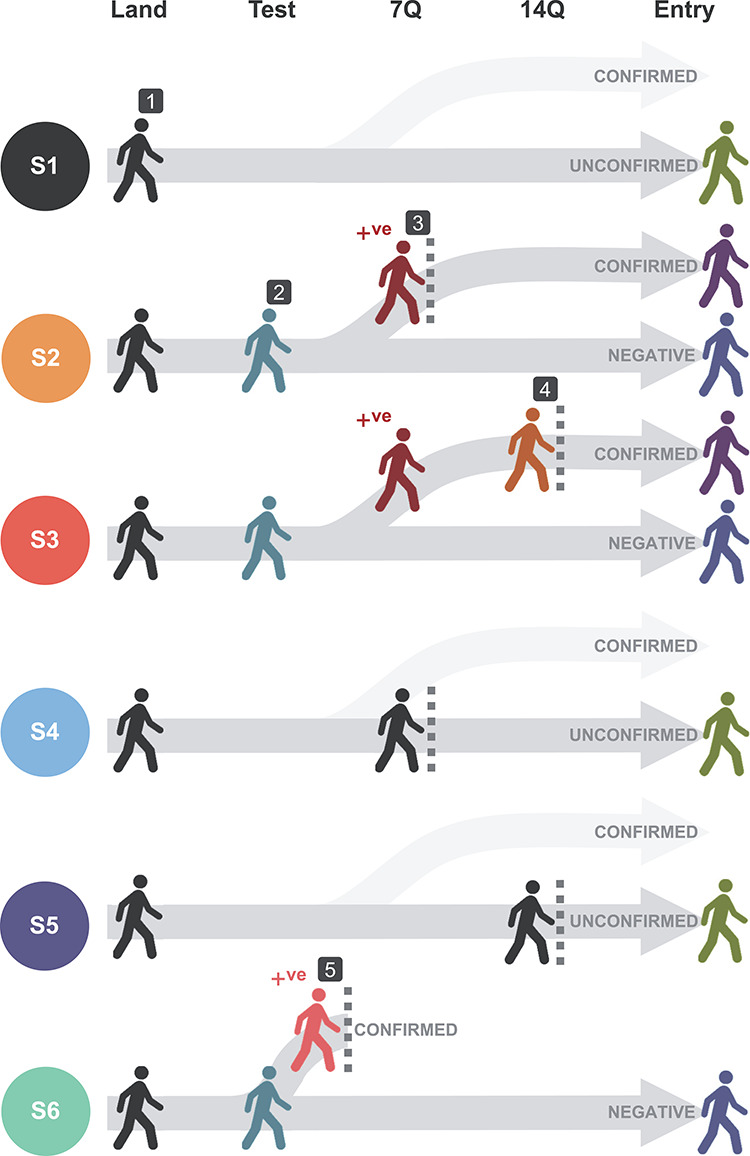
Methods: To estimate active case exportation risk from 153 countries with recorded coronavirus disease-2019 cases and deaths, we created a simple data-driven framework to calculate the number of infectious and upcoming infectious individuals out of 100 000 000 potential travellers from each country, and assessed six importation risk reduction strategies; Strategy 1 (S1) has no screening on entry, S2 tests all travellers and isolates test-positives where those who test negative at 7 days are permitted entry, S3 the equivalent but for a 14 day period, S4 quarantines all travellers for 7 days where all are subsequently permitted entry, S5 the equivalent for 14 days and S6 the testing of all travellers and prevention of entry for those who test positive.
Results: The average reduction in case importation across countries relative to S1 is 90.2% for S2, 91.7% for S3, 55.4% for S4, 91.2% for S5 and 77.2% for S6. An average of 79.6% of infected travellers are infectious upon arrival. For the top 100 exporting countries, an 88.2% average reduction in secondary cases is expected through S2 with the 7-day isolation of test-positives, increasing to 92.1% for S3 for 14-day isolation. A substantially smaller reduction of 30.0% is expected for 7-day all traveller quarantining, increasing to 84.3% for 14-day all traveller quarantining.
Conclusions: The testing and isolation of test-positives should be implemented provided good testing practices are in place. If testing is not feasible, quarantining for a minimum of 14 days is recommended with strict adherence measures in place.
Keywords: Lockdown; SARS-CoV-2; air passengers; border measures; isolation; quarantine; travel restrictions.
© International Society of Travel Medicine 2020.
Figures


References
-
- Tuite AR, Watts AG, Khan K, Bogoch II. Ebola virus outbreak in north Kivu and Ituri provinces, Democratic Republic of Congo, and the potential for further transmission through commercial air travel. J Travel Med 2019; 26:taz063. - PubMed
-
- Shanks GD. Could Ross River virus be the next Zika? J Travel Med 2019; 26:taz003. - PubMed
Publication types
MeSH terms
LinkOut - more resources
Full Text Sources
Medical
Miscellaneous
