. 2020 Sep 28;54(6):792-804.e7.
doi: 10.1016/j.devcel.2020.07.022. Epub 2020 Aug 24.

A Weak Link with Actin Organizes Tight Junctions to Control Epithelial Permeability

Affiliations

A Weak Link with Actin Organizes Tight Junctions to Control Epithelial Permeability

Brian Belardi et al. Dev Cell. .

Abstract

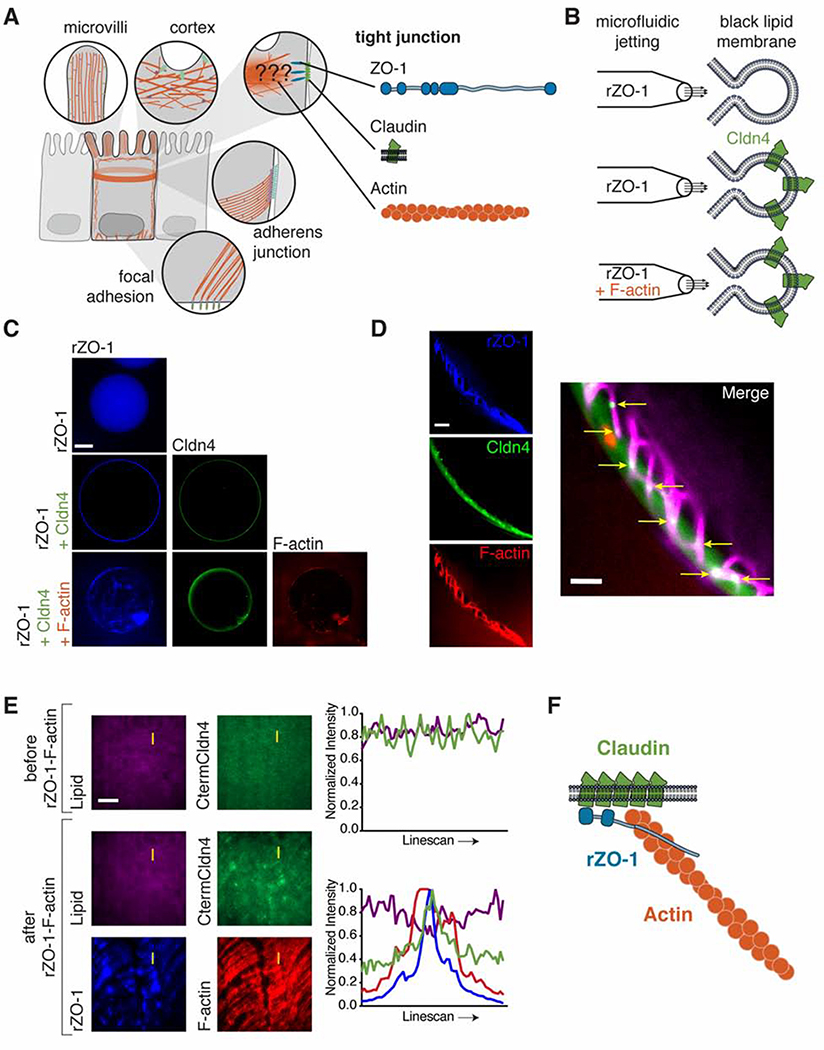
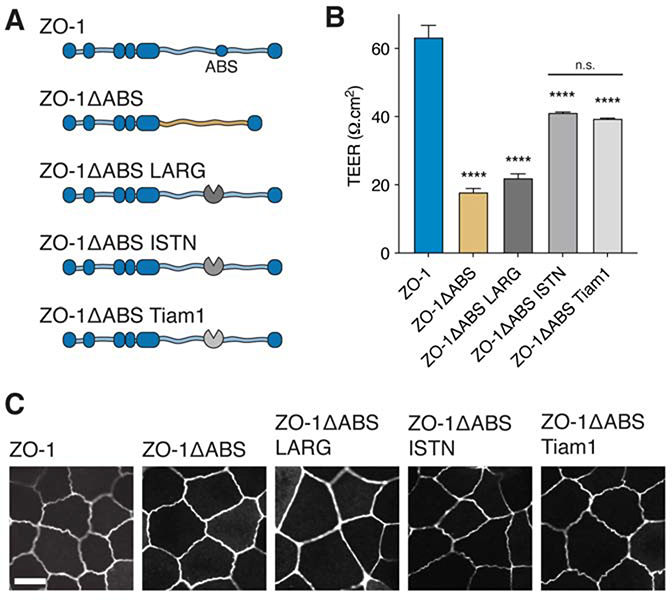
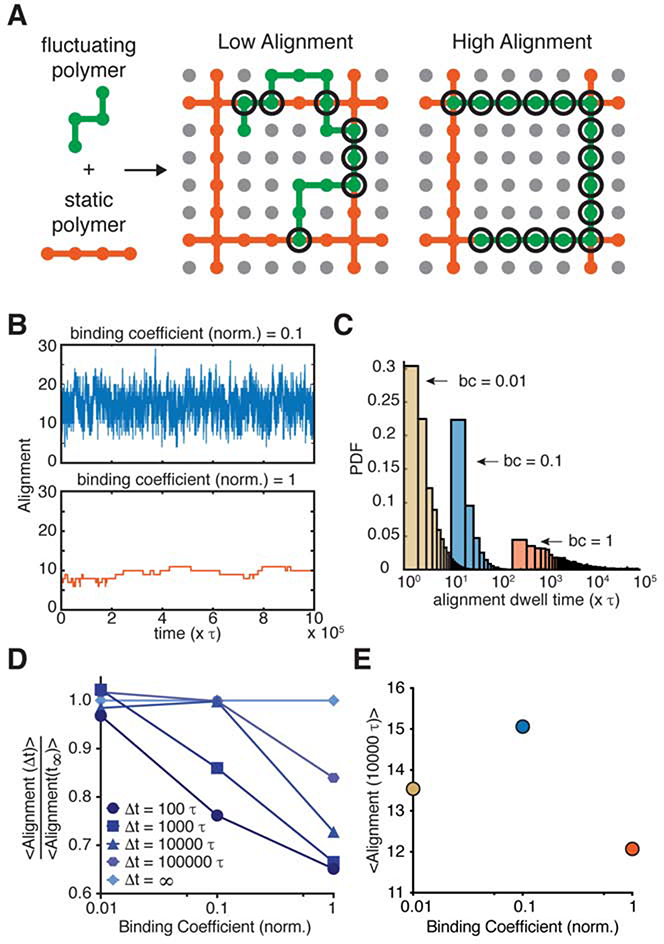
In vertebrates, epithelial permeability is regulated by the tight junction (TJ) formed by specialized adhesive membrane proteins, adaptor proteins, and the actin cytoskeleton. Despite the TJ's critical physiological role, a molecular-level understanding of how TJ assembly sets the permeability of epithelial tissue is lacking. Here, we identify a 28-amino-acid sequence in the TJ adaptor protein ZO-1, which is responsible for actin binding, and show that this interaction is essential for TJ permeability. In contrast to the strong interactions at the adherens junction, we find that the affinity between ZO-1 and actin is surprisingly weak, and we propose a model based on kinetic trapping to explain how affinity could affect TJ assembly. Finally, by tuning the affinity of ZO-1 to actin, we demonstrate that epithelial monolayers can be engineered with a spectrum of permeabilities, which points to a promising target for treating transport disorders and improving drug delivery.

Keywords: ZO-1; actin-binding proteins; apical junction complex; barrier function; cell adhesion; cytoskeleton; epithelial cells; kinetic trap; membrane organization; tight junction.


Conflict of interest statement

Declaration of Interests The authors declare no competing interests.

Figures

Figure 1.
Figure 1.. ZO-1 simultaneously engages actin and transmembrane claudins in vitro.
(A) Schematic of actin structures in polarized epithelial cells. The role of actin at TJs is still unresolved. Depicted are three TJ components that lie in and near the membrane: the plaque protein, ZO-1, which possesses binding motifs for claudins and F-actin; transmembrane claudins; and filamentous actin. (B) GUVs were jetted with either rZO-1 (top), rZO-1 and Cldn4 (middle), or rZO-1, Cldn4, and F-actin (bottom). (C) Fluorescent micrographs of jetted GUVs under the three conditions outlined in (B). Scale bar, 50 μm. (D) Fluorescent micrographs of jetted GUVs containing rZO-1, Cldn4 and F-actin. Scale bar, 2.5 μm. The yellow arrows (right) indicate positions of enrichment of Cldn4 by ZO-1-F-actin meshes. (E) Fluorescent micrographs of CtermCldn4 peptide tethered to DOPC-based supported lipids bilayers in the presence or absence of ZO-1-F-actin complexes and line scan (yellow line). Scale bar, 20 μm. (F) rZO-1 directly links the actin cytoskeleton with claudin in vitro. See also Figure S2.
Figure 2.
Figure 2.. Identification of an ABS within ZO-1’s C-terminal disordered region.
(A) Schematic of human ZO-1’s primary sequence. A search for ZO-1’s ABS was performed on a 224 amino acid portion (magenta) of ZO-1’s long C-terminal disordered region. (B) Schematic of cell-free, actin-binding assay. Segments of ZO-1 were fused to GFP and expressed using cell-free expression. F-actin binding was visualized using fluorescence microscopy. (C) Fluorescent micrographs of F-actin binding assay after expressing different segments of ZO-1’s disordered region. Scale bar, 10 μm. (D) Quantification of F-actin density from cell-free actin-binding assay for various constructs encoding different portions of the disordered region. The magenta bar highlights the full 224 amino acid region. Bars represent mean ± SD, n=3, (p-values determined using a two-sample t-test with A1–224, *** p<0.001, **** p<0.0001, n.s. p>0.05). Inset: Fluorescent micrograph of F-actin binding assay after expressing ZO-1’s ABS. Scale bar, 10 μm. (E) Fluorescent micrographs of HeLa cells expressing GFP-ABS (left). Cells were fixed and stained for F-actin using AF647-phalloidin (right). Scale bar, 20 μm. See also Figure S3.
Figure 3.
Figure 3.. ZO-1’s ABS is necessary for robust barrier function in dKO MDCK cells.
(A) Immunofluorescent micrographs of TJ proteins in wt and dKO cells. The images show lack of ZO-1 and ZO-2 in dKO cells. The localization of TJ proteins, e.g. Claudin-1 and F-actin, are altered in dKO cells. Scale bar, 10 μm. (B) TEER measurements of wildtype (wt) MDCK II cells and of CRISPR/Cas9-generated ZO-1 and ZO-2 KO cells at day 4 of confluency. Bars represent mean ± SEM (p-values determined using a multi-comparison ANOVA between each of the means, **** p<0.0001, n.s. p>0.05). N values represent biological replicates, wt (N=6), ZO-1 KO (N=4), ZO-2 KO (N=3), dKO (N=7). Barrier function was abolished for cells lacking ZO-1 and ZO-2 (dKO). (C) Schematic of ZO-1 constructs with and without ZO-1’s ABS introduced into dKO cells. (D) TEER measurements of wt and dKO cells expressing full-length ZO-1 and ZO-1ΔABS. Measurements are from day 4 of confluency. Bars represent mean ± SEM, n=4, (p-values determined using a two-sample t-test, **** p<0.0001). (E) Immunofluorescent micrographs of ZO-1, Claudin-1, and F-actin in dKO cells expressing ZO-1 and ZO-1ΔABS. No difference in localization of TJ proteins was observed between the two cell lines. Scale bar, 10 μm. See also Figure S4.
Figure 4.
Figure 4.. Engineering actin network structures at the TJ fails to restore barrier function of cells lacking ZO-1’s ABS.
(A) Schematic of ZO-1 constructs introduced into dKO cells with the actin regulators, LARG, ISTN, and Tiam1, replacing the ABS. (B) TEER measurements of dKO cells expressing ZO-1ΔABS GEF constructs. Measurements are from day 4 of confluency. Bars represent mean ± SEM, n=3, (p-values determined using a multiple comparison one-way ANOVA, p-values represent comparison with ZO-1, **** p<0.0001, n.s. p>0.05). (C) Fluorescent micrographs of ZO-1ΔABS GEF constructs show localization to the TJ membrane. Scale bar, 10 μm.
Figure 5.
Figure 5.. Weak association between ZO-1 and F-actin is required for robust epithelial barrier function.
(A) Schematic of ZO-1 constructs introduced into dKO cells with ectopic ABDs replacing the native ABS of ZO-1. (B) Fluorescent micrographs of dKO cells from day 4 of confluency expressing ZO-1ΔABS with the ABDs from the AJ protein, α-Catenin, the short peptide, Lifeact, and the tandem calponin-homology domain protein, Utrophin. All constructs localized to the TJ. Scale bar, 10 μm. (C) TEER measurements of dKO cells expressing ZO-1ΔABS with the ABDs from α-Catenin, Lifeact, and Utrophin. Measurements are from day 4 of confluency. Bars represent mean ± SEM, n=3, (p-values determined using a two-sample t-test for ZO-1 vs. ABD, * p<0.05, ** p<0.01, **** p<0.0001). (D) Representative image of cell-cell junction using 3D STORM of dKO cells expressing ZO-1. Micrograph is a projection of anti-ZO-1 single molecules in the x-y plane color coded according to their z localization. Scale bar, 500 nm. (E) Reconstructed micrograph of x-z projection of the yellow rectangle shown in (D). Scale bar, 250 nm. (F) Fluorescence profile of ZO-1 (IZO-1) vs. z position after horizontal binning of the white box shown in (E). The full-width at half maximum (FWHM) was estimated from ZO-1’s z distribution (red bar). (G) Quantification of the IZO-1 FWHM from super-resolution images of dKO cells expressing ZO-1 constructs with various ABDs. Bars represent mean ± SEM, (p-values determined using a two-sample t-test comparison with dKO + ZO-1, ** p<0.01, *** p<0.001, **** p<0.0001). Each symbol represents one cell-cell junction segment, ZO-1 (n=45), ΔABS (n=21), α-Catenin (n=39), Utrophin (n=39). (H) Schematic of ZO-1 constructs introduced into dKO cells with ectopic ABDs replacing the native ABS of ZO-1 (top). Fluorescent micrographs of ZO-1ΔABS ABD constructs in dKO cells (bottom). All constructs localized to the TJ. Scale bar, 10 μm. (I) TEER measurements of dKO cells expressing ZO-1ΔABS with ectopic ABDs replacing ZO-1’s ABS plotted vs. the affinity of the ABD for F-actin (see Table S2). Measurements are from day 4 of confluency. Symbols represent mean ± SEM, n=3. See also Figure S6.
Figure 6.
Figure 6.. High affinity interaction between two polymeric species gives rise to kinetic traps.
(A) Schematic of lattice model indicating low and high alignment between a static polymer (orange) and a fluctuating polymer (green). (B) Alignment traces of a single polymer fluctuating under two binding coefficients over time. (C) Probability density function of alignment dwell times of fluctuating polymers under various binding coefficients (bc). Dwell time refers to the number of steps that polymers remain in individual alignment configurations. (D) Normalized average alignments of fluctuating polymers under various binding coefficients at different time intervals. At short time intervals, fluctuating polymers with large binding coefficients are trapped at low alignments, suggesting that a high affinity interaction to F-actin, a large persistence length polymer, at the TJ may kinetically trap claudins, a more flexible polymer, in unfavorable configurations. (E) Average alignment of fluctuation polymers under various binding coefficients at 10,000τ. At this time interval, kinetic trapping is convolved with the total number of contacts between the two polymers, resulting in a bell-shaped curve.

References

    1. Acharya BR, Wu SK, Lieu ZZ, Parton RG, Grill SW, Bershadsky AD, Gomez GA, and Yap AS (2017). Mammalian Diaphanous 1 Mediates a Pathway for E-cadherin to Stabilize Epithelial Barriers through Junctional Contractility. Cell Rep. 18, 2854–2867. - PubMed
    1. Aijaz S, D’Atri F, Citi S, Balda MS, and Matter K (2005). Binding of GEF-H1 to the tight junction-associated adaptor cingulin results in inhibition of Rho signaling and G1/S phase transition. Dev. Cell 8, 777–786. - PubMed
    1. Beco S. de, Vaidžiulytė K, Manzi J, Dalier F, Federico F di, Cornilleau G, Dahan M, and Coppey M (2018). Optogenetic dissection of Rac1 and Cdc42 gradient shaping. Nat. Commun 9, 1–13. - PMC - PubMed
    1. Belardi B, Son S, Vahey MD, Wang J, Hou J, and Fletcher DA (2019). Claudin-4 reconstituted in unilamellar vesicles is sufficient to form tight interfaces that partition membrane proteins. J. Cell. Sci 132, jcs221556. - PMC - PubMed
    1. Bertocchi C, Wang Y, Ravasio A, Hara Y, Wu Y, Sailov T, Baird MA, Davidson MW, Zaidel-Bar R, Toyama Y, et al. (2017). Nanoscale architecture of cadherin-based cell adhesions. Nat. Cell Biol 19, 28–37. - PMC - PubMed

Publication types