. 2020 Sep 3;182(5):1295-1310.e20.
doi: 10.1016/j.cell.2020.08.012. Epub 2020 Aug 11.

Deep Mutational Scanning of SARS-CoV-2 Receptor Binding Domain Reveals Constraints on Folding and ACE2 Binding

Affiliations

Deep Mutational Scanning of SARS-CoV-2 Receptor Binding Domain Reveals Constraints on Folding and ACE2 Binding

Tyler N Starr et al. Cell. .

Abstract

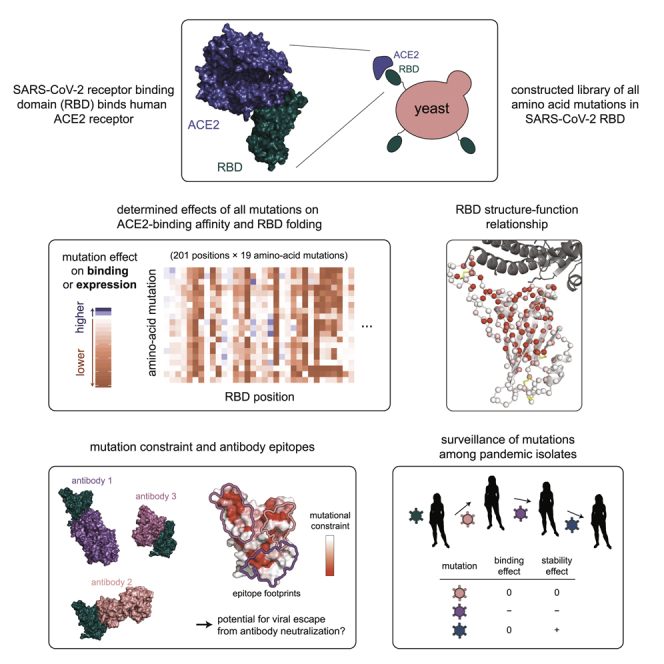
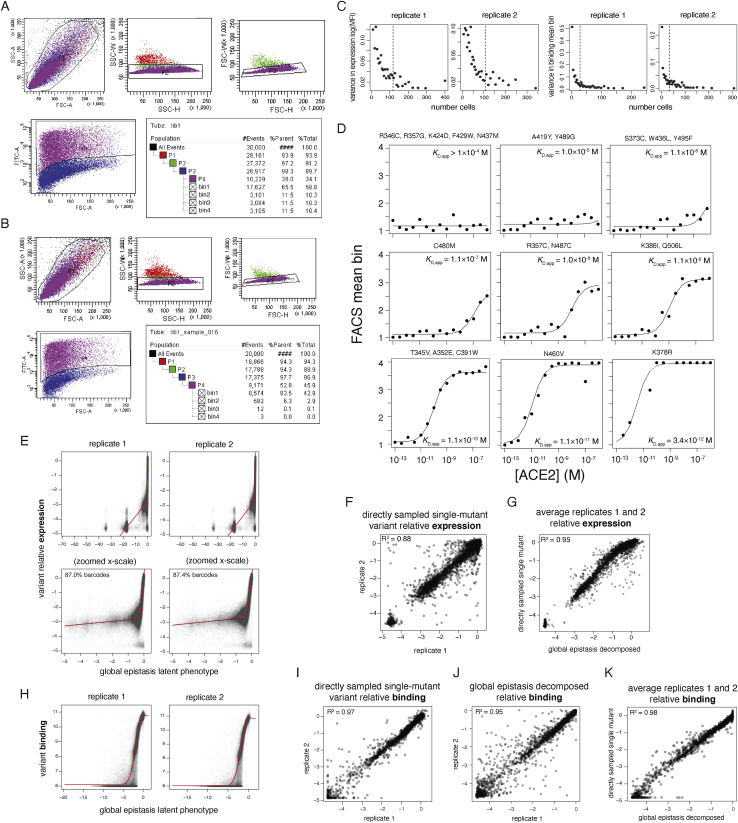
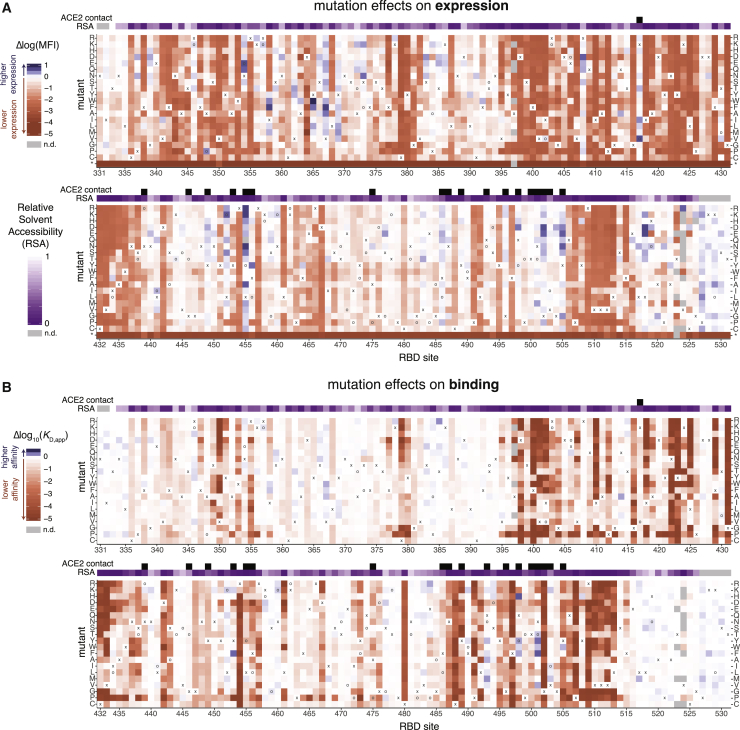
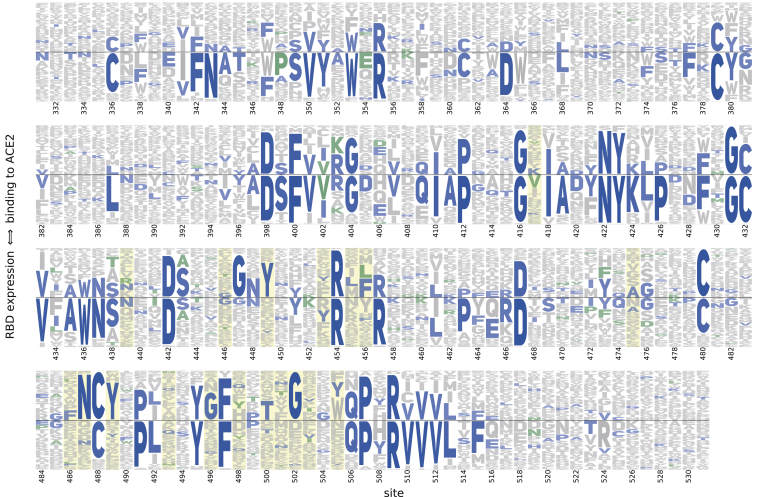
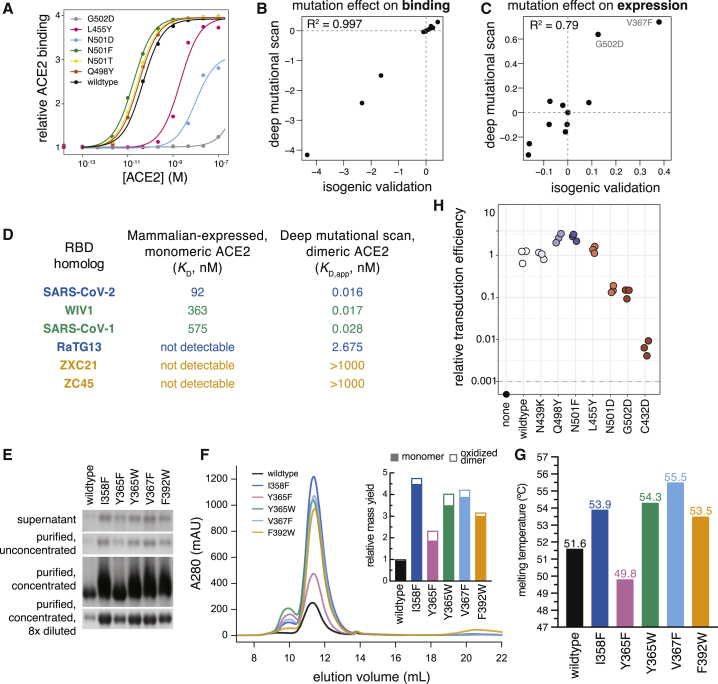
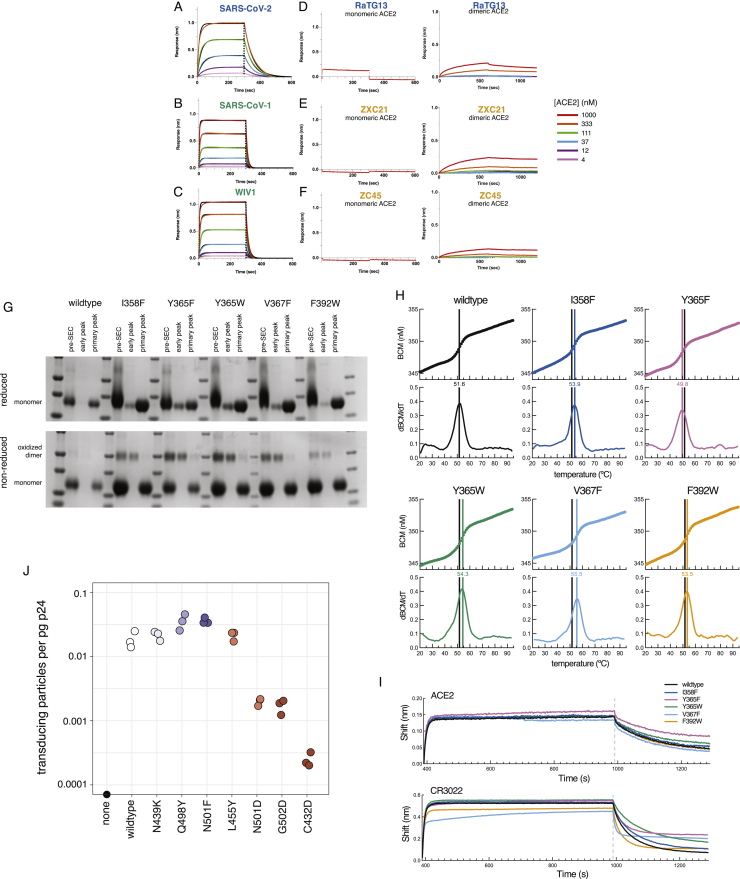
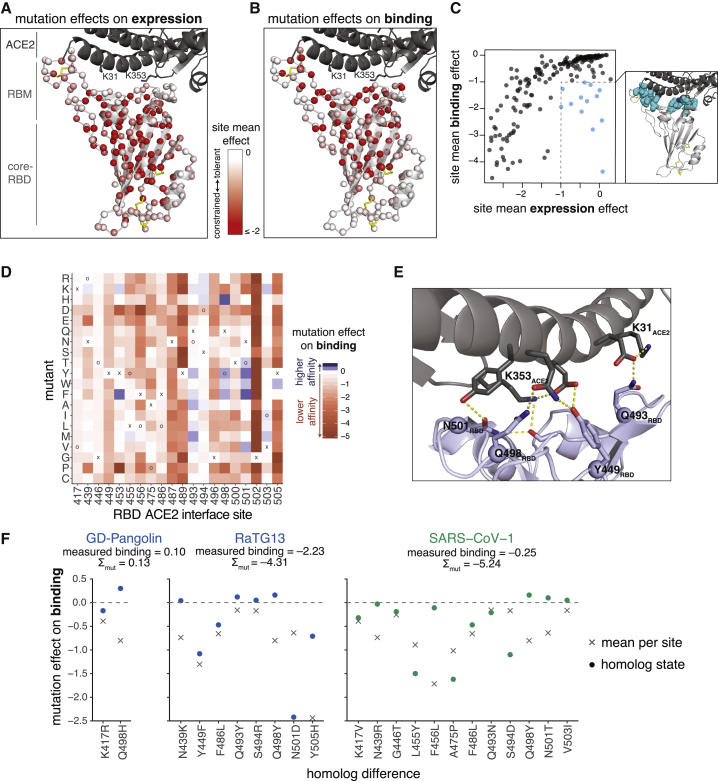
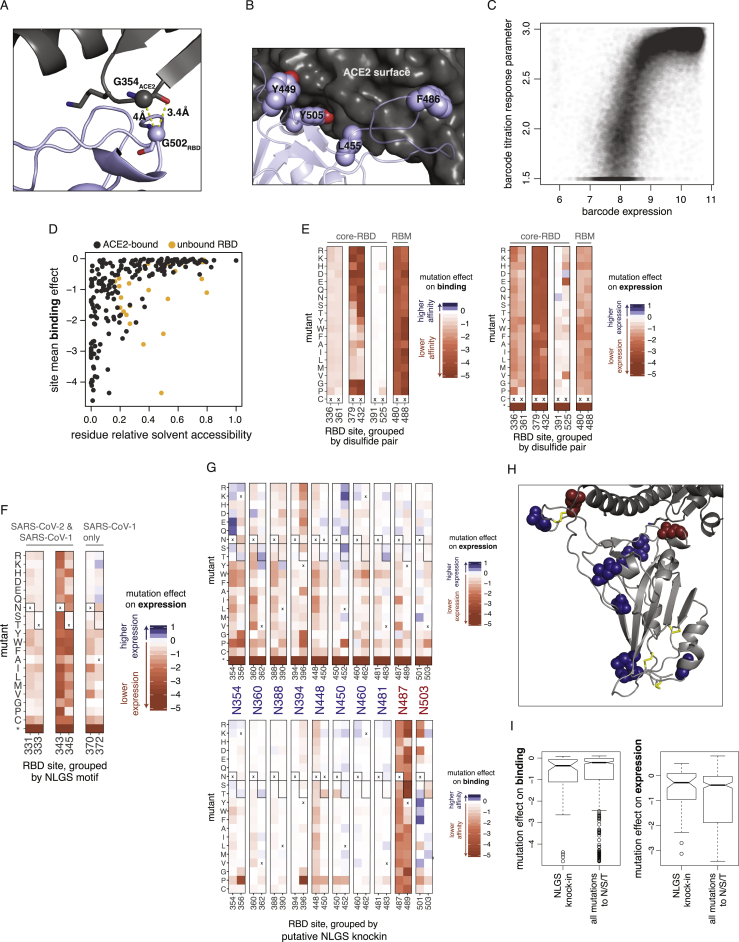
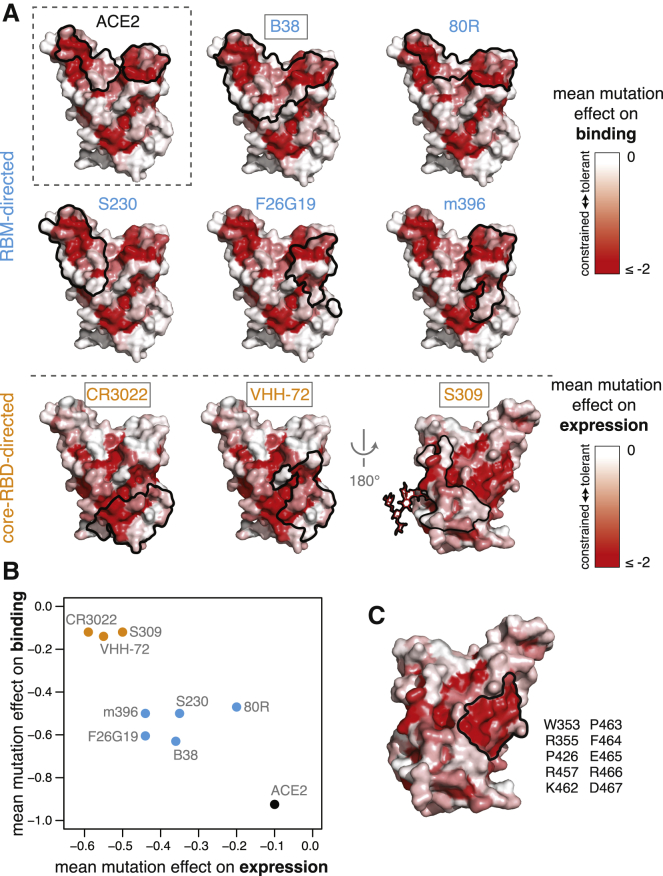
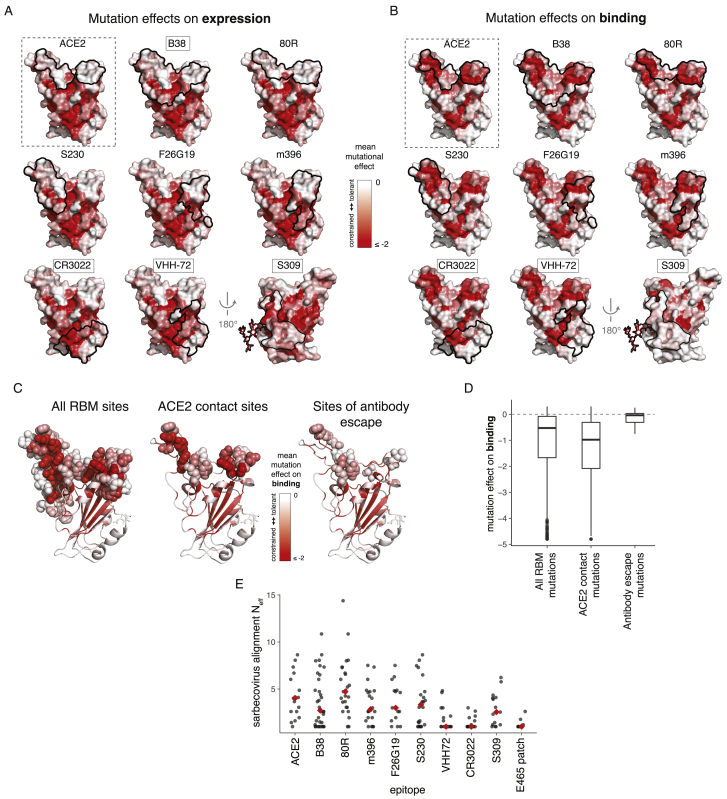
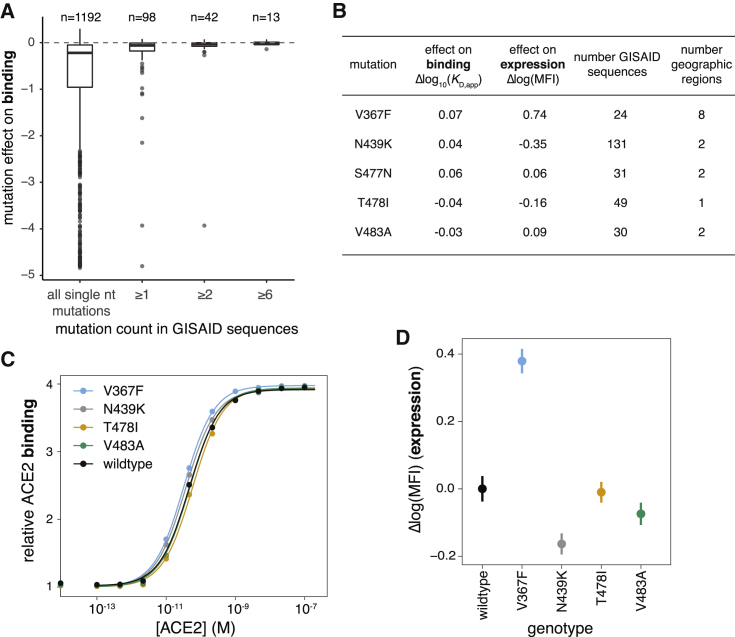
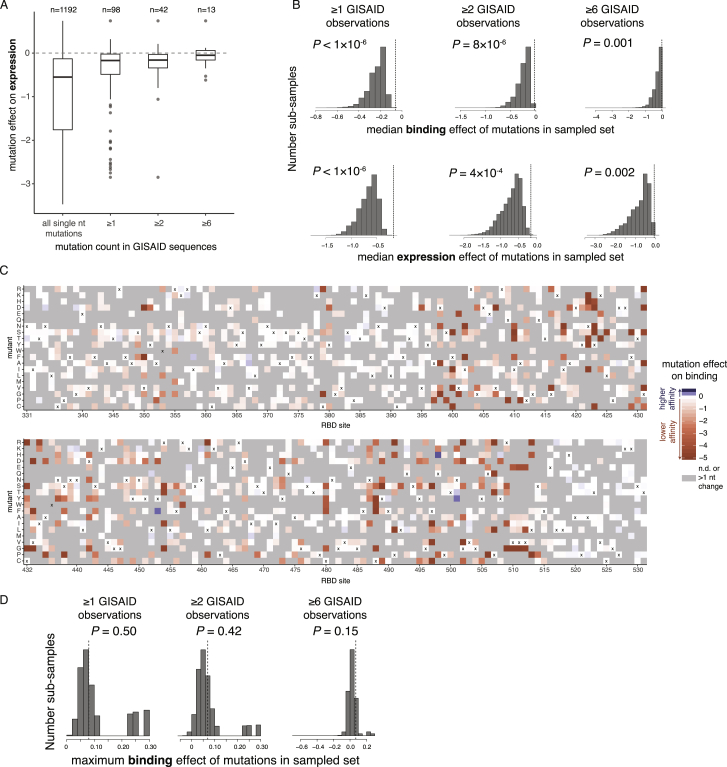
The receptor binding domain (RBD) of the SARS-CoV-2 spike glycoprotein mediates viral attachment to ACE2 receptor and is a major determinant of host range and a dominant target of neutralizing antibodies. Here, we experimentally measure how all amino acid mutations to the RBD affect expression of folded protein and its affinity for ACE2. Most mutations are deleterious for RBD expression and ACE2 binding, and we identify constrained regions on the RBD's surface that may be desirable targets for vaccines and antibody-based therapeutics. But a substantial number of mutations are well tolerated or even enhance ACE2 binding, including at ACE2 interface residues that vary across SARS-related coronaviruses. However, we find no evidence that these ACE2-affinity-enhancing mutations have been selected in current SARS-CoV-2 pandemic isolates. We present an interactive visualization and open analysis pipeline to facilitate use of our dataset for vaccine design and functional annotation of mutations observed during viral surveillance.

Keywords: ACE2; SARS-CoV-2; deep mutational scanning; receptor-binding domain.


Conflict of interest statement

Declaration of Interests N.P.K. is a co-founder, shareholder, and chair of the scientific advisory board of Icosavax, Inc.

Figures

None
Graphical abstract
Figure 1
Figure 1
Yeast Display of RBDs from SARS-CoV-2 and Related Sarbecoviruses (A) Maximum likelihood phylogeny of sarbecovirus RBDs. RBDs included in the present study are in bold colored text. Node labels indicate bootstrap support. (B) RBD yeast-surface display enables fluorescent detection of RBD expression and ACE2 binding. (C) Yeast displaying the indicated RBD were incubated with varying concentrations of human ACE2, and binding was measured via flow cytometry. Binding constants are reported as KD,app from the illustrated titration curve fits. (D) Comparison of yeast-display binding with previous measurements of the capacity of viral particles to enter ACE2-expressing cells. Relative binding is Δlog10(KD,app) measured in the current study; relative cellular entry is infection of ACE2-expressing cells by vesicular stomatitis virus (VSV) pseudotyped with spike containing the indicated RBD, reported by Letko et al. (2020) in arbitrary luciferase units relative to SARS-CoV-1 RBD; n.d., not determined.
Figure S1
Figure S1
SARS-CoV-2 RBD Mutant Libraries, Related to Figure 2 (A) Scheme of the library generation and sequencing approach. SARS-CoV-2 RBD mutant libraries were constructed in fully independent duplicates, and variants were linked to barcodes by long-read PacBio sequencing. (B) PacBio sequencing stats on duplicate SARS-CoV-2 mutant libraries. Comparison of RBD sequences among independent circular consensus sequences (CCSs) of the same barcode enables calculation of an empirical accuracy, which describes the minimal expected accuracy of the barcode:RBD linkage for barcodes with a single CCS (see STAR Methods for details). Most barcodes were represented by multiple CCSs, which further increases the accuracy of barcode:RBD linkage. (C) Statistics on mutation rates in mutant libraries. Top, average number of mutations of different types across variants in each library. Bottom, distribution of number of amino acid mutations per variant. (D, E) Mutation coverage in mutant libraries. Cumulative distribution plots (D) give the fraction of all possible amino acid mutations observed in the indicated number of variants, including all variants (left) or only variants with a single mutation (right). Minimum coverage statistics from these curves are tabulated in (E).
Figure 2
Figure 2
Deep Mutational Scanning of All Amino Acid Mutations to the SARS-CoV-2 RBD (A and B) FACS approach for deep mutational scans for expression (A) and binding (B). Cells were sorted into four bins from low to high expression or binding, with separate sorts for each ACE2 concentration. The frequency of each library variant in each bin was determined by Illumina sequencing of the barcodes of cells collected in that bin, enabling reconstruction of per-variant expression and binding phenotypes. Bin boundaries were drawn based on distributions of expression or binding for unmutated SARS-CoV-2 controls (blue), and gray shows the distribution of library variants for library replicate 1 in these bins. (C and D) Distribution of library variant phenotypes for expression (C) and binding (D), with variants classified by the types of mutations they contain. Internal control RBD homologs are indicated with vertical lines, colored by clade as in Figure 1A. Stop-codon-containing variants were purged by an RBD+ pre-sort prior to ACE2 binding measurements and so are not sampled in (D). (E and F) Correlation in single-mutant effects on expression (E) and binding (F), as determined from independent mutant library replicates. See also Figures S1 and S2 and Table S1.
Figure S2
Figure S2
Deep Mutational Scanning of the SARS-CoV-2 RBD, Related to Figure 2 (A, B) Representative sorting gates used to select cells for for expression (A) and binding (B) FACS experiments. FSC and SSC gates select for single cells (P1-P3), and FITC labeling of an RBD C-terminal epitope tag defines RBD+ gates (P4), when necessary. Tables show the nested hierarchy of sort gates, with final bins 1-4 for expression and binding shown in Figures 2A and 2B, respectively. For (A), the P4 RBD+ gate was used to enrich the library for expressing variants, which were grown up and re-induced for binding experiments as in (B). (C) Empirical estimates of variance in FACS-seq measurements. Barcodes encoding wild-type SARS-CoV-2 RBD were grouped by total cell count across sort bins, and the variance in estimates of expression mean fluorescence (left) or binding mean bin (right, corresponding to a single point in the subsequent titration curve fit) were determined. Black dashed lines indicate the median cell count for which each phenotype was measured among library genotypes. (D) Example variant-specific titration curves inferred from the deep mutational scanning experiment. Randomly selected titration curves are illustrated across the range of fit KD,app binding constants, with variant genotype listed above each panel. Because curves that were fit with KD,app between 10−4 to 10−6 were virtually indistinguishable non-responsive curves, we truncated all KD,app measurements in this range to a censored > 10−6 M cutoff. (E-K) Global epistasis models were fit to decompose single-mutant effects from variant backgrounds containing variable numbers of mutations. These models invoke an underlying latent scale on which mutations combine additively, which is linked to the experimental scale by a flexible nonlinear curve fit, which accounts for limits in dynamic range and other nonlinearities. See the STAR Methods for more details. (E, H) Global epistasis fits. Plots illustrate, for each library variant, its experimentally determined phenotype for expression (E) or binding (H) versus its latent phenotype predicted by the global epistasis model. Red lines indicate the shape of the nonlinear curve fit. For the expression global epistasis models, mutations to stop codons are fit to a latent-scale effect of approximately −16.5. The separated clusters of points toward increasingly deleterious latent scale phenotypes reflect genotypes containing 1, 2, 3, etc. nonsense mutations. (F, I) Correlation in mutation effects on expression (F) and binding (I) between replicates, for mutations that were sampled directly as single mutants with no global epistasis decomposition. (J) Correlation in mutation effects on binding between replicates, for all global-epistasis-decomposed single-mutant effect terms on the observed phenotype scale. Equivalent plot for expression is Figure 2E. (G, K) Correlation in mutation effects on expression (G) and binding (K) averaged across replicates, for directly sampled single-mutant measurements versus global-epistasis-decomposed mutation effects. For expression, global epistasis averaging of single-mutant effects across all variants (Figure 2E) improved replicate correlations beyond the directly sampled measurements (F), so global-epistasis-decomposed values were used for all single-mutant terms. For binding, directly sampled single-mutant effects (I) were better correlated than the values decomposed from global epistasis models (J), so global epistasis models were used to interpolate single-mutant measurements only for mutations that were not observed on any directly sampled single-mutant variant backgrounds.
Figure 3
Figure 3
Sequence-to-Phenotype Maps of the SARS-CoV-2 RBD (A and B) Heatmaps illustrating how all single mutations affect RBD expression (A) and ACE2-binding affinity (B). Interactive versions of these heatmaps are at https://jbloomlab.github.io/SARS-CoV-2-RBD_DMS and in Data S1. Squares are colored by mutational effect according to scale bars on the left, with red indicating deleterious mutations. The SARS-CoV-2 amino acid is indicated with an “x” and the SARS-CoV-1 amino acid, if different, is indicated with an “o”. Black boxes in top overlay indicate residues that contact ACE2 in the SARS-CoV-2 or SARS-CoV-1 crystal structures. The purple overlay represents the relative solvent accessibility (RSA) of a residue in the ACE2-bound SARS-CoV-2 crystal structure. See also Figure S3, Table S2, and Data S1.
Figure S3
Figure S3
Logo Plot Representation of Mutation Effects on Binding and Expression, Related to Figure 3 Letter height indicates preference of each site for individual amino acids with respect to ACE2 binding (height above the center line) or RBD expression (height below the center line). Blue letters indicate the unmutated SARS-CoV-2 amino acid, and, where applicable, green letters indicate differences found in SARS-CoV-1. Yellow highlights mark residues that contact ACE2 in the SARS-CoV-2 or SARS-CoV-1 crystal structures. See the STAR Methods for details of how the amino acid preferences are calculated from the experimental measurements.
Figure 4
Figure 4
Validation of Deep Mutational Scanning Measurements (A) Titration curves for select mutations that were re-cloned and validated in isogenic yeast cultures, as in Figure 1C. (B and C) Correlation in binding (B) and expression (C) effects between deep mutational scanning and isogenic yeast validations, including mutants shown in (A) and Figure 7C. (D) Comparisons of dissociation constants measured for mammalian-expressed purified RBD binding to monomeric human ACE2 (Figures S4A–S4F) and yeast displayed RBD binding to natively dimeric ACE2 from our deep mutational scan. (E–G) Validation of expression-enhancing mutations. (E and F) Expression-enhancing mutations increase soluble yield of mammalian-expressed RBD. Reducing SDS-PAGE gel of transfection supernatant and RBD protein at various stages of purification (E). Analytical size exclusion chromatography (SEC) trace of protein variants (F). Inset, relative quantitation of protein yield from SEC. Open bar reflects the relative quantity of the earlier eluting peak, which corresponds to oxidized dimer (Figure S4G). (G) Thermal stability of RBD variants. See Figure S4H for raw melting curves. (H) Effects of mutations on transduction of ACE2-expressing cells by lentiviral particles pseudotyped with a SARS-CoV-2 spike. Mutants are colored by their effects on ACE2 binding as measured in the deep mutational scan (Figure 3B). Titers that fell below the limit of detection (dashed horizontal line) are plotted on the x axis. Measurements were made in biological triplicate and reflect the integrated effects of mutations on pseudovirus production and cellular entry; transduction efficiency normalized by pseudovirus production is presented in Figure S4J and gives highly similar results. See also Figure S4.
Figure S4
Figure S4
Validation of Deep Mutational Scanning Measurements, Related to Figure 4 (A-F) Human ACE2 binds to various sarbecovirus RBDs with distinct affinities. Biolayer interferometry (BLI) binding of various concentrations of human ACE2 to the indicated RBDs immobilized at the surface of biosensors. Global fit curves are shown as black lines. The vertical dashed lines indicate the transition between association and dissociation phases. Analysis of binding to dimeric human ACE2, incorporating avidity effects, was also analyzed for the RBDs that did not bind monomeric ACE2 (D-F, right). (G) Reducing (top) and non-reducing (bottom) SDS-PAGE gels of expression-enhancing mutant RBDs illustrate that the early SEC peak (Figure 4F) is an oxidized dimer species. (H) Raw thermal melting traces for determination of non-equilibrium thermal stability, summarized in Figure 4G. Top plots show the barycentric mean (BCM) of intrinsic tryptophan fluorescence as a function of increasing temperature; bottom plots show the first derivative of BCM with respect to temperature, the maximum of which is the reported melting temperature (colored line). Black line illustrates the wild-type melting temperature, for reference. (I) BLI of immobilized mutant RBDs for binding to ACE2 (top) or CR3022 (bottom), indicating that all mutations maintain ACE2 and CR3022 binding, though kinetics of CR3022 binding may be slightly modified by some mutations. (J) Pseudovirus transduction efficiency normalized by pseudovirus yield in the transfection supernatant. p24 levels (pg/mL) in the transection supernatant were determined via ELISA. Titers of transducing units determined by flow cytometry were normalized by p24 levels in the same supernatant to calculate transducing particles per pg p24. Measurements were performed in biological triplicate, with p24 quantitation performed in technical duplicate.
Figure 5
Figure 5
Mutation Effects in the Context of RBD Structure and Implications for Sarbecovirus Evolution (A and B) Mutational constraint mapped to the SARS-CoV-2 RBD structure. A sphere at each site Cɑ is colored according to the mean effect of mutations with respect to expression (A) or binding (B), with red indicating more constraint. RBD structural features and the ACE2 K31 and K353 interaction hotspot residues are labeled. Yellow sticks indicate disulfide bridges. Interactive structure-based visualizations of these data are at https://jbloomlab.github.io/SARS-CoV-2-RBD_DMS/structures/. (C) Relationship between mutational constraint on binding and expression. The structural view shows sites that are under strong constraint for ACE2 binding but are tolerant of mutations for expression (cyan spheres). (D) Heatmap as in Figure 3B, subsetted on sites that directly contact ACE2 in the SARS-CoV-2 or SARS-CoV-1 RBD structures, plus interface site 494, which is a key site of adaptation in SARS-CoV-1. (E) RBD sites 493, 498, and 501, which have many affinity-enhancing mutations, participate in polar contact networks involving the ACE2 interaction hotspot residues K31 and K353. (F) Variation at ACE2 contact sites in sarbecovirus RBDs. Circles show the effects of individual mutations that differentiate a virus ACE2 interface from SARS-CoV-2, while x shows the mean effect of all mutations at that site. The sum of individual mutation effects at interface residues is shown, compared to the actual RBD binding relative to unmutated SARS-CoV-2. See also Figure S5.
Figure S5
Figure S5
Additional Structural Analyses of Mutation Effects, Related to Figure 5 (A, B) Structural depictions of sites exhibiting stability-binding tradeoffs. (A) RBD residue G502 requires small amino acid side chains for ACE2 binding (Figure 3B), consistent with its close proximity to G354ACE2 in the bound structure. (B) Mutations to polar residues at positions Y449, L455, F486, and Y505 would enhance expression but reduce binding, consistent with specific geometric constraints imposed by the close packing of these residues at the ACE2 surface. (C) Relationship between barcode expression and titration response plateau parameters. The correlation between mutation effects on binding and expression in Figure 5C could emerge from trivial correlation between phenotypes (e.g., yeast with higher RBD surface expression can bind more ACE2). However, our multiple-concentration titration approach should in principle remove this trivial correlation (Adams et al., 2016), because each binding phenotype is determined from a self-referenced titration curve, for which the free plateau response parameter can vary to account for different levels of saturated binding due to RBD expression (see Figure S2D). Consistent with this premise, the response parameter from the titration fit for library variants with KD,app < 10−7 (as lower-affinity titration curves do not adequately sample the titration plateau) correlates with its expression phenotype. (D) Relationship between mutational constraint on binding and residue relative solvent accessibility (RSA). Black dots indicate RSA in the full ACE2-bound RBD structure, and when sites have changes in RSA in the unbound structure, then their RSA in that structure is also shown in orange. (E) Mutation effects on binding (left) and expression (right) at disulfide cysteine residues. Details as in Figure 3. RBD sites are grouped by disulfide pair and labeled according to location in the core-RBD or RBM sub-domains. (F) Mutation effects on expression at N-linked glycosylation sites (NLGS). RBD sites are grouped by NLGS motif (NxS/T, where x is any amino acid except proline). Boxed amino acids indicate those that encode a NLGS motif. NLGS motifs are labeled according to whether they are present in both the SARS-CoV-2 and SARS-CoV-1 RBD (N331 and N343 glycans), or in SARS-CoV-1 only (N370 glycan). Introduction of the N370 glycan in SARS-CoV-2 is mildly deleterious for stability. (G) Effects of putative N-linked glycosylation site (NLGS) knock-in mutations. Heatmap details as in Figure 3. There are 10 surface-exposed asparagines for which RBD expression is unaffected or enhanced (top) when an NLGS motif is introduced via mutations to S or T at the i+2 site; for eight of these putative NLGS knock-ins (blue labels), the putative glycan is also tolerated for ACE2 binding (bottom), but for two (red labels), introduction of the NLGS motif is not tolerated for ACE2 binding. (H) Mapping of these ten asparagines to the RBD structure illustrates that these two binding-constrained asparagines (red) map to the ACE2 interface. (I) For mutation effects on expression (left) and binding (right), comparison of phenotypic impacts of mutations that knock in new NLGS motifs (NxS/T) versus single mutations to N, S, or T at all positions. There is no trend for NLGS knockin mutations to be more deleterious than typical mutations to N, S, or T.
Figure 6
Figure 6
Mutational Constraint of Antibody Epitopes (A) For ACE2 and each of 8 RBD-directed antibodies, black outlines indicate the epitope structural footprint, with surfaces colored by mutational constraint (red indicates more constrained). Names of antibodies capable of neutralizing SARS-CoV-2 are boxed. Constraint is illustrated as mutational effects on binding for RBM-directed antibodies (blue, top) and expression for core-RBD-directed antibodies (orange, bottom). The N343 glycan, which is present in the S309 epitope and is constrained with respect to expression, is shown only on this surface for clarity. (B) Average mutational constraint for binding and expression within each epitope. Points are colored according to the RBM versus core-RBD designation in (A). (C) Identification of a patch of mutational constraint surrounding RBD residue E465, which has not yet been targeted by any described antibodies. Surface is colored according to mutational effects on expression, as in (A, bottom). Residues in this constrained E465 patch are listed. See also Figure S6.
Figure S6
Figure S6
Mutational and Evolutionary Constraint of Antibody Epitopes, Related to Figure 6 (A, B) Surface representations of antibody epitopes colored by mutational effects on expression (A) and binding (B). Representations as described in Figure 6A. (C, D) Mutational constraint and observed antibody escape mutations. Baum et al. (Baum et al., 2020) selected SARS-CoV-2 escape mutations from RBD-directed antibodies. We compare the average mutational tolerance of the sites at which these escape mutations accrue (C), and the effects of the specific escape mutations themselves (D) to all RBM and ACE2-contact sites/mutations. The antibody escape involved mutations that were better tolerated than typical mutations in the RBM or ACE2-binding interface. (E) Evolutionary diversity in antibody epitopes and our newly described E465-centered surface patch among the sarbecoviruses in Figure 1A. Diversity is summarized as the effective number of amino acids (Neff), which scales from 1 for a site that is invariant, to 20 for a site in which all amino acids are at equal frequency.
Figure 7
Figure 7
Phenotypic Impacts of Genetic Variation in the SARS-CoV-2 RBD (A) Distribution of effects on ACE2 binding of mutations observed among circulating SARS-CoV-2 isolates. The distribution of mutation effects is shown for all amino acid mutations accessible via single-nucleotide mutation from the SARS-CoV-2 Wuhan-Hu-1 gene sequence, compared to the distributions for subsets of mutations that are observed in sequenced SARS-CoV-2 isolates deposited in GISAID at increasing observation count thresholds. n, number of mutations in each subset. (B) Summary of most frequent mutations among GISAID sequences, reporting our deep mutational scanning measured effect on binding and expression, the number of GISAID sequences containing the mutation, and the number of geographic regions from which a mutation has been reported. (C and D) Validation of the mutational effects on binding (C) and expression (D) for 4 of the 5 most frequent circulating RBD variants. S477N rose to high frequency after we began our validation experiments, and so was not included. Error bars in (D) are standard error from 11 samples. See also Figure S7.
Figure S7
Figure S7
Genetic Variation and Selection in SARS-CoV-2, Related to Figure 7 (A) Distribution of expression effects of mutations observed among circulating SARS-CoV-2 isolates. Details as in Figure 7A. (B) Permutation tests indicating the action of purifying selection on binding (top) and expression (bottom) among circulating SARS-CoV-2 mutations. For each threshold of GISAID observation counts, 1 million random sub-samples of single-nucleotide-accessible amino acid changes were generated at the same sample size as the true mutation set (n = 98, 42, and 13 for the ≥ 1, ≥ 2, and ≥ 6 thresholds). A P-value was determined as the fraction of sub-samples with median mutational effect on binding or expression equal to or greater than that of the actual GISAID mutation set (dashed vertical line). The observation that the set of mutations observed in GISAID have a more favorable median mutational effect on binding and expression than randomly sampled mutations indicates the action of purifying selection for ACE2 binding and RBD stability. (C) Heatmaps depicting effects of mutations on ACE2 binding, indicating only those mutations that are accessible via single-nucleotide mutation from the SARS-CoV-2 Wuhan-Hu-1 isolate gene sequence. Amino acid mutations that require more than one nucleotide change are in gray. (D) Permutation tests for positive selection for enhanced ACE2 affinity. Random sub-samples were generated as in (B), and the maximum affinity-enhancing effect of mutations in each sub-sample was compared to that in the actual GISAID mutation set. A P-value was determined as the fraction of sub-samples with a maximum effect on binding equal to or greater than in the actual GISAID mutation set (vertical dashed line). We do not see evidence for selection for enhanced ACE2 binding, as randomly sampled mutations generally contain mutations with stronger affinity-enhancing effects than observed in the GISAID mutation set.

Update of

Comment in

References

    1. Adams R.M., Mora T., Walczak A.M., Kinney J.B. Measuring the sequence-affinity landscape of antibodies with massively parallel titration curves. eLife. 2016;5:e23156. - PMC - PubMed
    1. Andersen K.G., Rambaut A., Lipkin W.I., Holmes E.C., Garry R.F. The proximal origin of SARS-CoV-2. Nat. Med. 2020;26:450–452. - PMC - PubMed
    1. Baum A., Fulton B.O., Wloga E., Copin R., Pascal K.E., Russo V., Giordano S., Lanza K., Negron N., Ni M. Antibody cocktail to SARS-CoV-2 spike protein prevents rapid mutational escape seen with individual antibodies. Science. 2020:eabd0831. doi: 10.1126/science.abd0831. Published online June 15, 2020. - DOI - PMC - PubMed
    1. Becker M.M., Graham R.L., Donaldson E.F., Rockx B., Sims A.C., Sheahan T., Pickles R.J., Corti D., Johnston R.E., Baric R.S., Denison M.R. Synthetic recombinant bat SARS-like coronavirus is infectious in cultured cells and in mice. Proc. Natl. Acad. Sci. USA. 2008;105:19944–19949. - PMC - PubMed
    1. Bedford T., Greninger A.L., Roychoudhury P., Starita L.M., Famulare M., Huang M.-L., Nalla A., Pepper G., Reinhardt A., Xie H. Cryptic transmission of SARS-CoV-2 in Washington State. medRxiv. 2020 doi: 10.1101/2020.04.02.20051417. - DOI - PMC - PubMed

Publication types

Substances