. 2020 Nov 11;28(5):724-740.e8.
doi: 10.1016/j.chom.2020.08.003. Epub 2020 Aug 24.

The Gut Virome Database Reveals Age-Dependent Patterns of Virome Diversity in the Human Gut

Affiliations

The Gut Virome Database Reveals Age-Dependent Patterns of Virome Diversity in the Human Gut

Ann C Gregory et al. Cell Host Microbe. .

Abstract

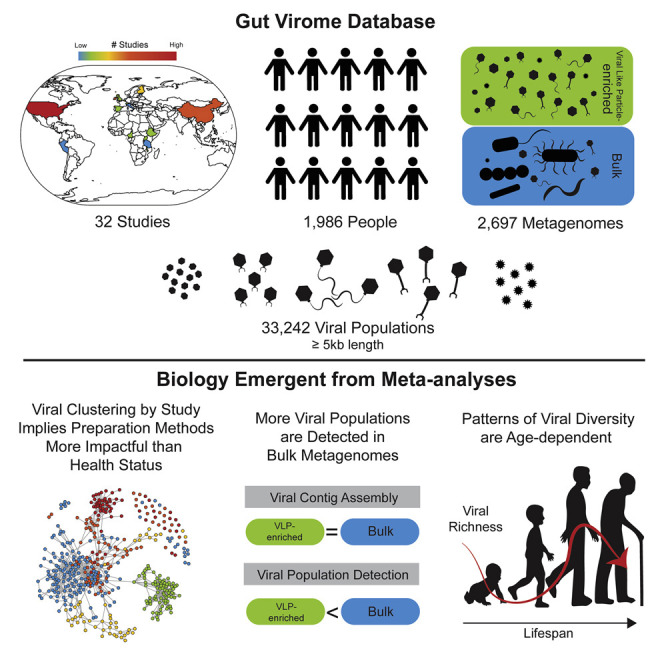
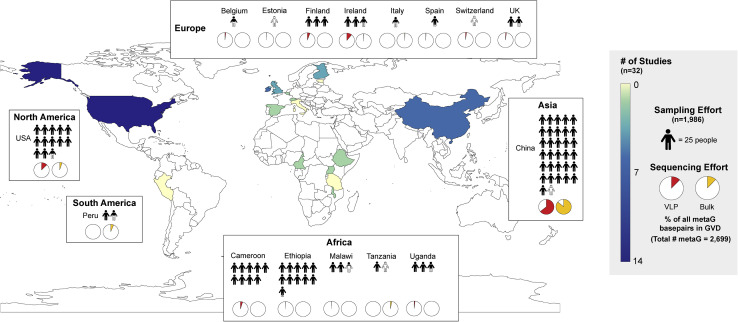
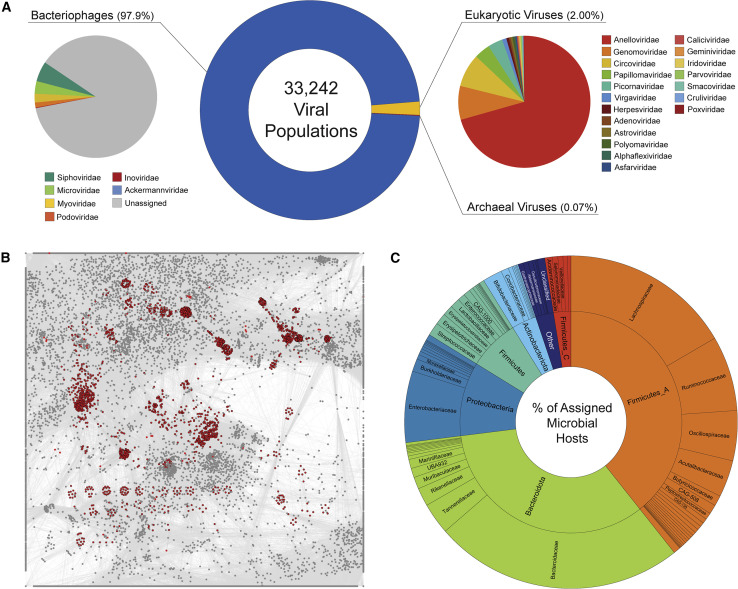
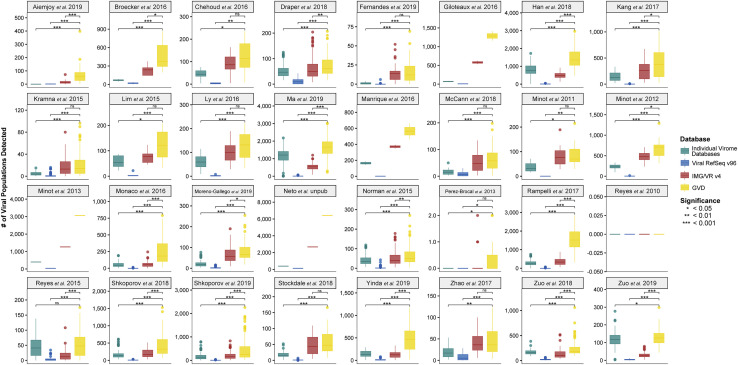
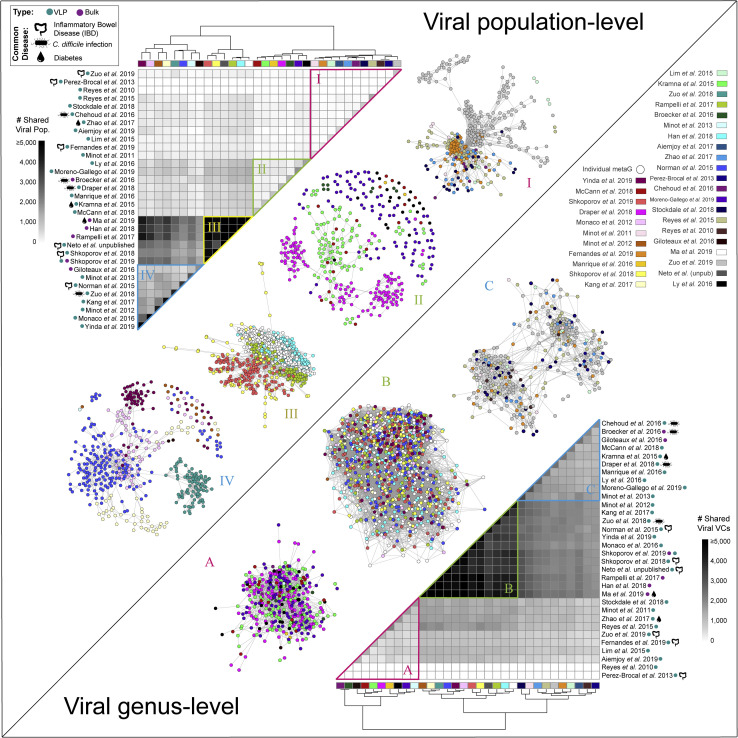
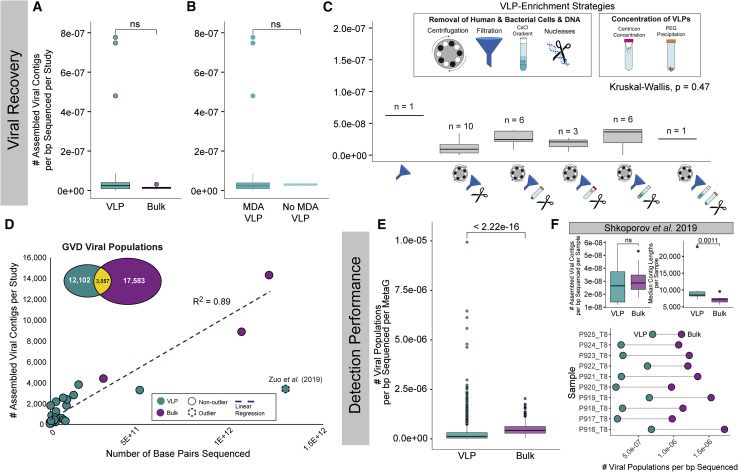
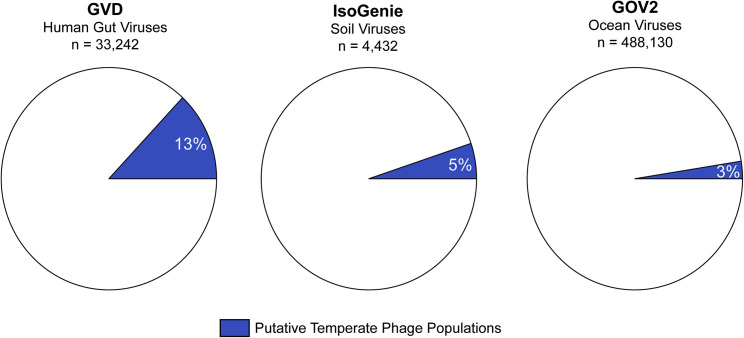
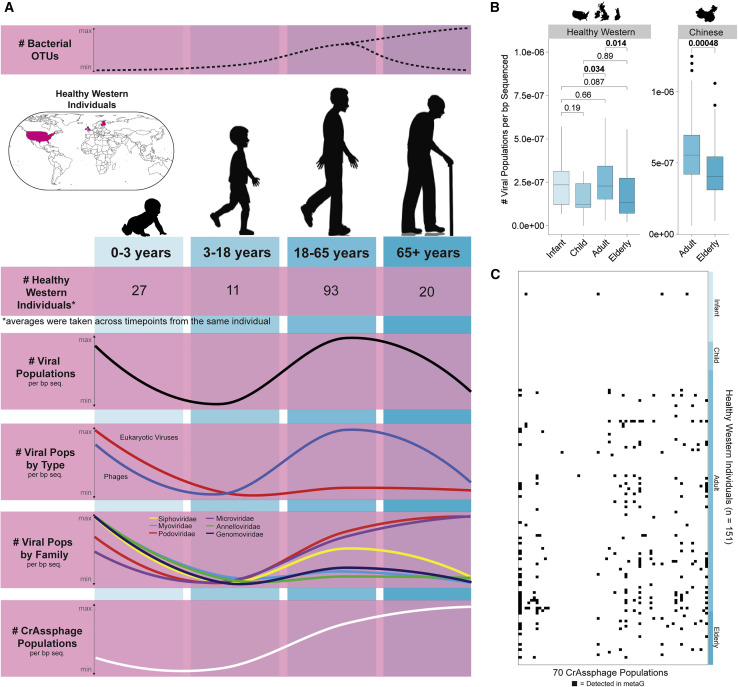
The gut microbiome profoundly affects human health and disease, and their infecting viruses are likely as important, but often missed because of reference database limitations. Here, we (1) built a human Gut Virome Database (GVD) from 2,697 viral particle or microbial metagenomes from 1,986 individuals representing 16 countries, (2) assess its effectiveness, and (3) report a meta-analysis that reveals age-dependent patterns across healthy Westerners. The GVD contains 33,242 unique viral populations (approximately species-level taxa) and improves average viral detection rates over viral RefSeq and IMG/VR nearly 182-fold and 2.6-fold, respectively. GVD meta-analyses show highly personalized viromes, reveal that inter-study variability from technical artifacts is larger than any "disease" effect at the population level, and document how viral diversity changes from human infancy into senescence. Together, this compact foundational resource, these standardization guidelines, and these meta-analysis findings provide a systematic toolkit to help maximize our understanding of viral roles in health and disease.

Keywords: bacteriophage; database; dysbiosis; gut microbiome; human health; lifespan; virome; virus.


Conflict of interest statement

Declaration of Interests The authors declare no competing interests.

Figures

None
Graphical abstract
Figure 1
Figure 1
Overview of Studies Comprising the Gut Virome Database (GVD) Global heatmap of the world showing the number and distribution of studies per country. Each white box represents a different continent and contains information about the number of individuals sampled represented by the filled human pictograms and percentage of the total GVD sequencing effort for VLP-enriched (red pie charts) and bulk metagenomes (yellow pie charts) of each country studied within that continent. See also Table S1.
Figure 2
Figure 2
The Gut Virome Database (GVD) (A) Pie charts showing the number of bacteriophages, eukaryotic viruses, and archaeal viruses in the GVD (center) and their familial taxonomic composition by the bacteriophages (left) and the eukaryotic viruses (right). (B) Gene-sharing taxonomic network of the GVD, including viral RefSeq viruses v88. RefSeq viruses are highlighted in red. Every node represents a virus genome, whereas connecting edges identify significant gene-sharing between genomes, which form the basis for their clustering in genus-level taxonomy. (C) Concentric pie chart showing the number of annotated bacterial host phyla (inner) and family (outer) of the GVD viruses. Host taxonomy follows the GTDB database taxonomic classifications, and putative host information per each viral population is listed in Table S2. See also Figures S1 and S2 and Tables S2, S3, and S6.
Figure 3
Figure 3
GVD As a Reference Database Increases Viral Population Detection Boxplots showing median and quartiles of the number of viral populations detected per study using the individual virome, Viral Refseq v96, JGI IMG/VR v4, or GVD databases. All pairwise comparisons were performed by using Mann-Whitney U tests. Non-significant p values are denoted as “ns.” See also Figure S3 and Table S4.
Figure 4
Figure 4
Individual Viromes Study Databases and Cross-Study Comparisons Shown at the top left is a hierarchically clustered heatmap showing the number of viral populations shared within and between studies clustered into four groups (I–IV). Viral population co-occurrence network per individual within each study per group. Shown on the bottom right is a hierarchically clustered heatmap showing the number of viral genera shared within and between studies clustered into three groups. Viral genus cluster co-occurrence networks per metagenome within each study per group. Colored dots and pictograms next to study names in heatmaps represent metagenome type and a common disease studies across all 32 studies in GVD, respectively. See also Figure S4.
Figure 5
Figure 5
VLP-Enriched (VLP) and Bulk Metagenomes Comparisons for Studying Viruses in the Human Gut (A–C) Boxplots showing median and quartiles of the number of assembled contigs per base pair sequenced per study (A) of VLP and bulk metagenomes, (B) of VLP metagenomes with and without MDA, and (C) of the different VLP-enrichment methodologies across the studies. Outlier dots were removed from plot (C) to better show the range of values. The n value above each box plot represents the number of studies using each VLP-enrichment method. (D) Scatter plot with a linear regression line showing the number of assembled viral contigs per bp sequenced per study with VLP and bulk metagenome studies identified by different colors. In the inset is a Venn diagram showing the number of GVD viral populations that originated from VLP or bulk or both types of metagenomes. (E) Boxplots showing median and quartiles of the number of viral populations detected per bp sequenced per individual of VLP and bulk metagenomes. (F) Boxplots showing median and quartiles of the number of assembled contigs per bp sequenced (top left) and the median contig length (top right) for VLP and bulk metagenomes processed for the same samples in the Shkoporov et al, (2019) (bottom). Connected dot plot showing the number of viral populations detected per bp sequencedby using VLP and bulk metagenomes for each individual in the Shkoporov et al, (2019) study. All pairwise comparisons were performed by using Mann-Whitney U tests. Non-significant p values are denoted as “ns.” See also Figure S4.
Figure 6
Figure 6
More Gut Viruses Are Temperate Phages than in the Soil and Oceans Pie charts showing the percentages of temperate phages found in the human gut (GVD dataset), soils (IsoGenie dataset), and oceans (Global Oceans Viromes 2 dataset).
Figure 7
Figure 7
Viral Diversity across Lifespan in Healthy, Western Individuals (A) Composite plot showing (from top to bottom) the number of bacterial operational taxonomic unit (OTU) trends across the life stages derived from a literature review; a map highlighting the origin of the healthy, Western individuals; the number of healthy, Western individuals per life stage; Loess smoothing plots of the number of viral populations; the number of viral populations by type; the number of viral populations by viral family; and the number of crAssphage populations per bp sequenced across the life stages in healthy, Western individuals. Box plots showing median and quartiles and Mann-Whitney U test results between the different life stages can be found in Figure S7. (B) Box plots showing median and quartiles of the number of viral populations per bp sequenced across the life stages across healthy, Western individuals (left) and across adults and elderly individuals from non-Western Chinese individuals (right). All pairwise comparisons were performed by using Mann-Whitney U tests. (C) Presence absence plot showing the distribution of the 70 crAssphage populations in the GVD across the healthy, Western individuals. See also Figures S6 and S7 and Table S5.

Comment in

Similar articles

Cited by

References

    1. Adriaenssens E.M., Sullivan M.B., Knezevic P., Van Zyl L.J. 2020. Taxonomy of prokaryotic viruses: 2018 – 2019 update from the ICTV Bacterial and Archaeal Viruses Subcommittee. - PubMed
    1. Aiemjoy K., Altan E., Aragie S., Fry D.M., Phan T.G., Deng X., Chanyalew M., Tadesse Z., Callahan E.K., Delwart E., Keenan J.D. Viral species richness and composition in young children with loose or watery stool in Ethiopia. BMC Infect. Dis. 2019;19:53. - PMC - PubMed
    1. Aleman F.D.D., Valenzano D.R. Microbiome evolution during host aging. PLoS Pathog. 2019;15:e1007727. - PMC - PubMed
    1. Almeida A., Nayfach S., Boland M., Strozzi F., Beracochea M., Shi Z.J., Pollard K.S., Sakharova E., Parks D.H., Hugenholtz P. A unified sequence catalogue of over 200,000 genomes obtained from the human gut microbiome. Nat. Biotechnol. 2020 doi: 10.1038/s41587-020-0603-3. - DOI - PMC - PubMed
    1. Amgarten D., Braga L.P.P., da Silva A.M., Setubal J.C. MARVEL, a tool for prediction of bacteriophage sequences in metagenomic bins. Front. Genet. 2018;9:304. - PMC - PubMed

Publication types