. 2020 Aug 22;12(9):2376.
doi: 10.3390/cancers12092376.

Detection of Oral Dysplastic and Early Cancerous Lesions by Polarization-Sensitive Optical Coherence Tomography

Affiliations

Detection of Oral Dysplastic and Early Cancerous Lesions by Polarization-Sensitive Optical Coherence Tomography

Ping-Hsien Chen et al. Cancers (Basel). .

Abstract

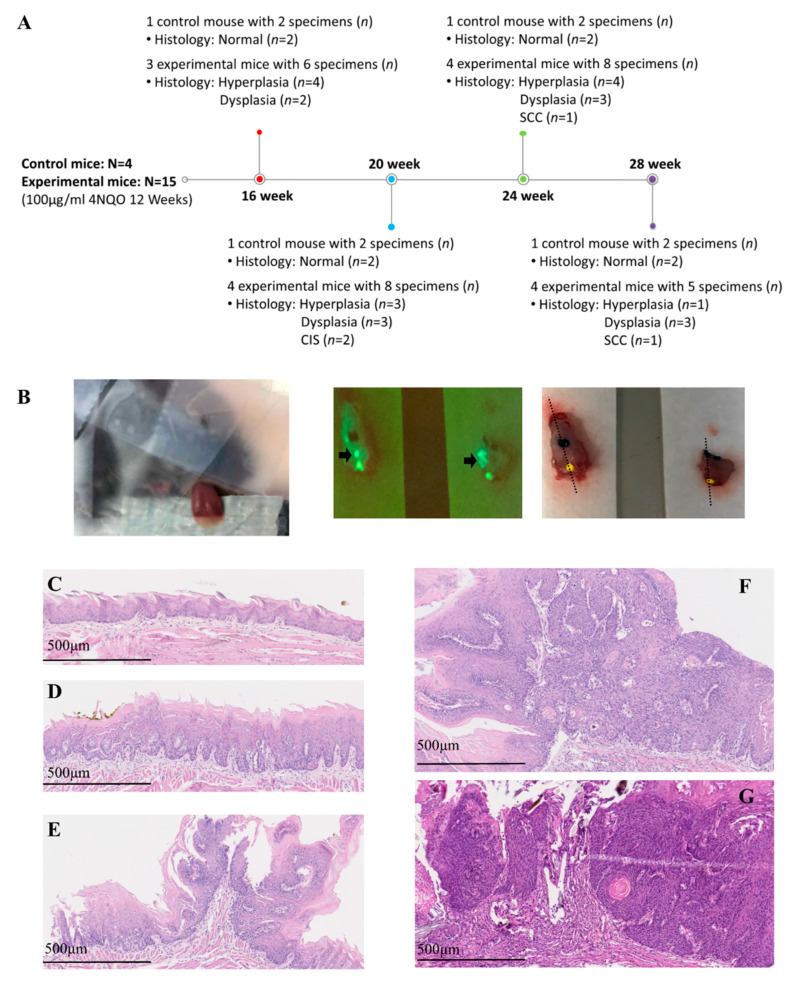
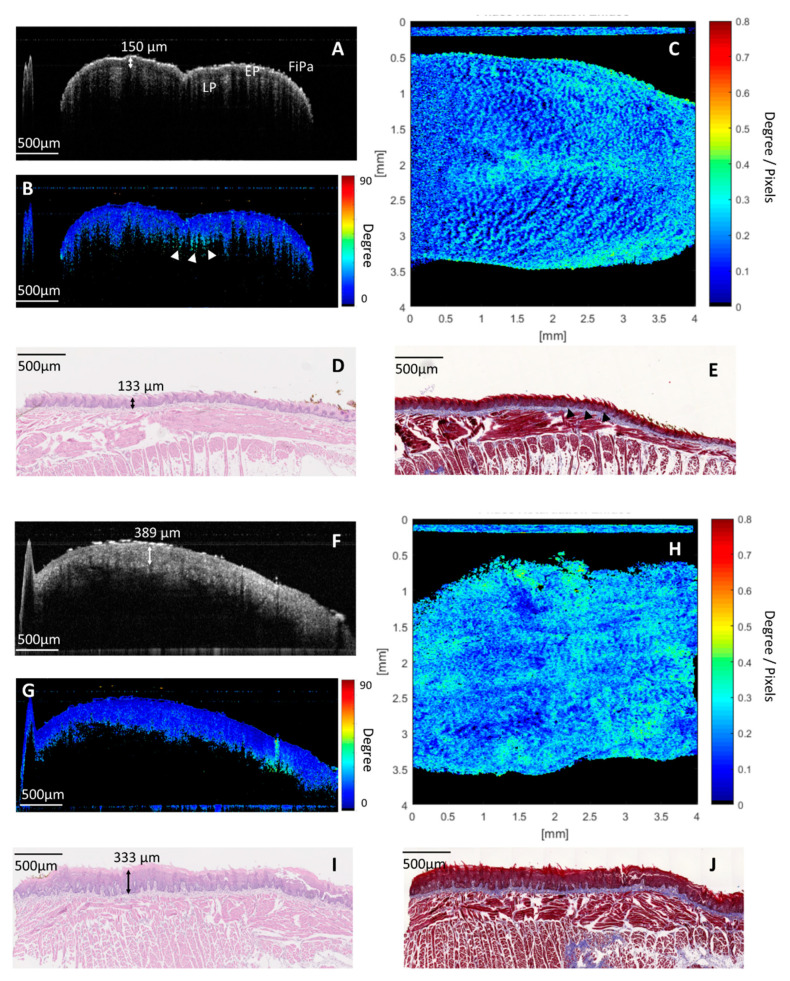
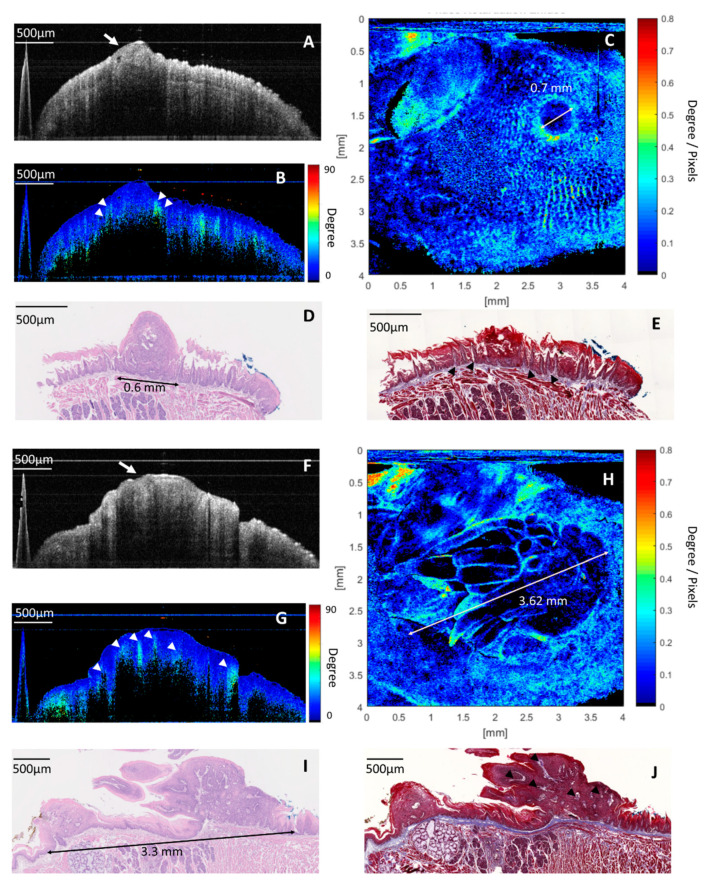
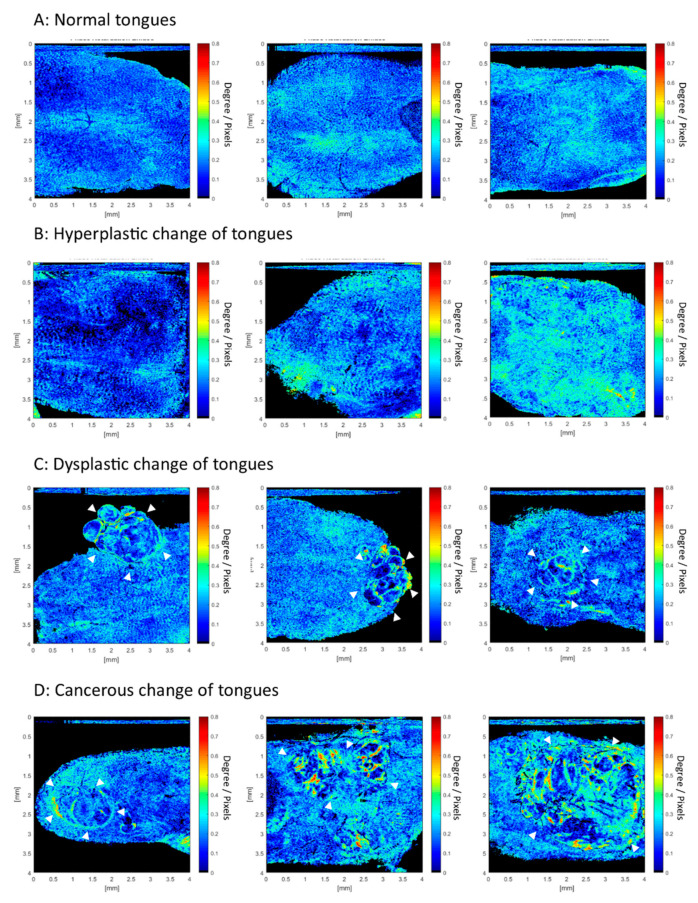
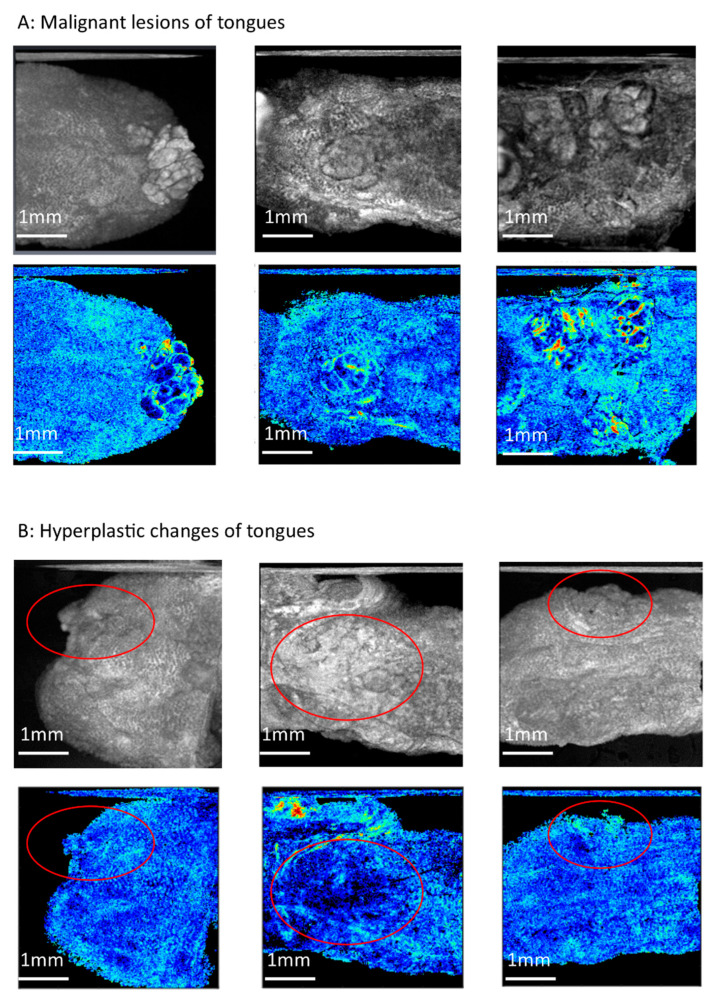
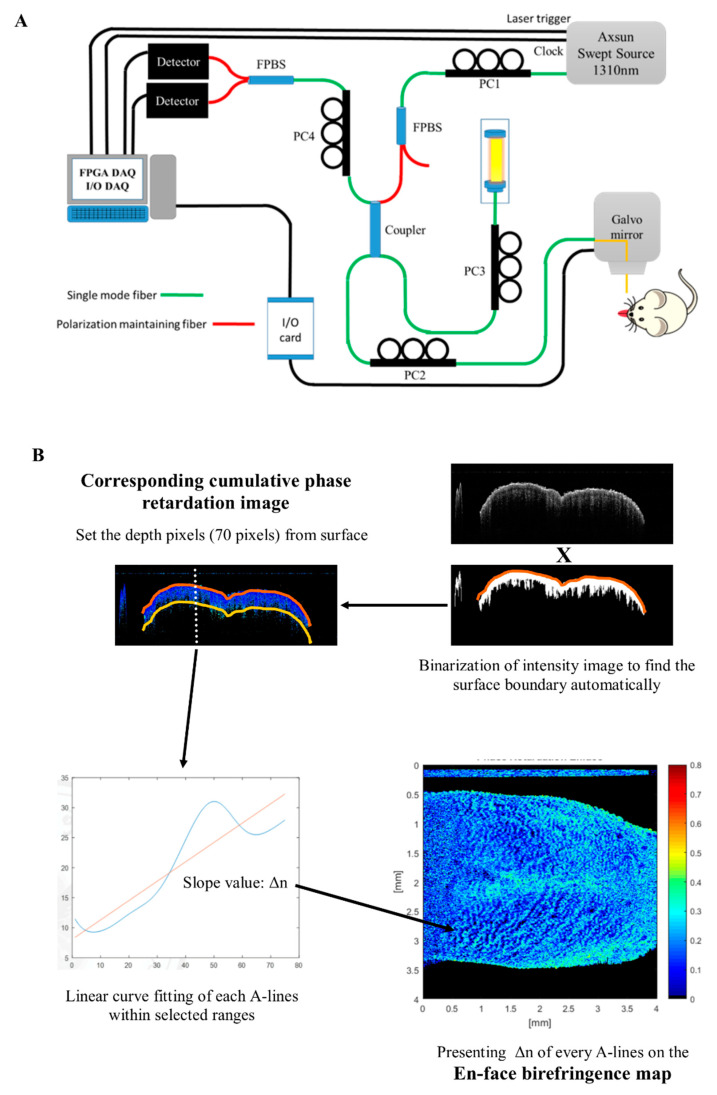
Detection of oral dysplastic and early-stage cancerous lesions is difficult with the current tools. Half of oral cancers are diagnosed in a late stage. Detection of early stromal change to predict malignant transformation is a new direction in the diagnosis of early-stage oral cancer. The application of new optical tools to image stroma in vivo is under investigation, and polarization-sensitive optical coherence tomography (PS-OCT) is potentially one of those tools. This is a preliminary study to sequentially image oral stromal changes from normal, hyperplasia, and dysplasia to early-stage cancer by PS-OCT in vivo. We used 4-Nitroquinoline-1-oxide drinking water to induce dysplasia and early-stage oral cancer in 19 K14-EGFP-miR-211-GFP transgenic mice. A total of 8 normal, 12 hyperplastic, 11 dysplastic, and 4 early-stage cancerous lesions were enrolled. A new analytic process of PS-OCT imaging was proposed, called an en-face birefringence map. From the birefringence map, the sensitivity, specificity, positive predictive value, and negative predictive values to detect dysplasia and early-stage cancer were 100.00%, 95.00%, 93.75%, and 100.00%, respectively, and the kappa value of these images between two investigators was 0.942. The mean size of malignant lesions detected in this study is 1.66 ± 0.93 mm. This pilot animal study validates the use of PS-OCT to detect small and early-stage oral malignancy with high accuracy and consistency.

Keywords: diagnosis; dysplasia; oral cancer; polarization-sensitive optical coherence tomography.


Conflict of interest statement

The authors declare no conflict of interest.

Figures

Figure 1
Figure 1
(A) Experimental schedule, number of mice (N), number of specimens (n), and histology results. (B) Polarization-sensitive optical coherence tomography (PS-OCT) scanning in vivo of the anterior tongue (left picture); fluorescence imaging to identify the green area, where indicates a potential tumor (middle picture, black arrow); and inking of the potential tumor area and histological sectioning on the black dotted line (right picture). (CG) Histological definition of benign lesion: normal (C) and hyperplasia (D); histological definition of malignancy: dysplasia (E), carcinoma in situ (F), and squamous cell carcinoma (G).
Figure 2
Figure 2
Images of the normal dorsal surface of the anterior tongue: (A) cross-sectional intensity optical coherence tomography (OCT) image. The microstructure of mucosa is shown, including filiform papilla (FiPa), the epithelium (EP), and the lamina propria (LP). (B) Cross-sectional cumulative PS-OCT image. The EP had low retardation. Some high retardant projection was seen beneath the EP (white arrowheads), where it is compatible with the collagen-abundant core of the papilla between the boundary of the EP and LP with Masson’s trichrome staining (black arrowheads in Figure 2E). (C) En-face birefringence map. Regularly arranged bright spots, where there are more birefringent agents like in the core of the papilla area, stand out against the homogeneous dark blue background. (D,E) Corresponding histology with hematoxylin and eosin (H&E) staining and Masson’s trichrome staining. Images of the dorsal surface of the anterior tongue with hyperplastic change: (F) cross-sectional intensity OCT image. An increased thickness of the EP was noted. (G) Cross-sectional cumulative PS-OCT. The thick EP showed low retardation. (H) En-face birefringence map. Blurred and irregular distribution of bright spots against a dark blue background. (I) Corresponding histology with H&E staining. Hyperkeratosis and increased thickness of the EP was noted. (J) Corresponding histology with Masson’s trichrome staining. The proliferation and irregular distribution of the collagen-abundant core of the papilla beneath the EP was seen.
Figure 3
Figure 3
Images of the dysplastic lesion: (A) cross-sectional intensity OCT image. A hypo-intensity, a protruding lesion was seen in the EP (white arrow). (B) Cross-sectional cumulative PS-OCT image. The protruding lesion showed low retardation, and some highly retardant spikes at the boundary of the EP and LP surrounding the protruding lesion (white arrowheads). (C) En-face birefringence map presented a 0.7 mm lesion, with low birefringence in the center and high birefringence in the periphery, the size of the tumor (0.7 mm) is consistent with the histology in Figure 3D (0.6 mm). (D) Histology with H&E staining revealed a 0.6 mm papilloma with the dysplastic change, which is compatible with the low-retardance protruding lesion in a cross-sectional PS-OCT image. The expanded and less-retardant dysplastic cell mass explains the low birefringence in the center of the tumor in Figure 3C. (E) Histology with Masson’s trichrome staining showed that the collagen--abundant elongated core of the papilla (black arrowheads) at the boundary of the EP and LP surrounding the peripheral of papilloma, which explains the high birefringence at the periphery of the lesion in Figure 3C. Images of the carcinoma in situ (CIS): (F) cross-sectional intensity OCT image. A thick, hypo-intensity tumor at the EP was seen (white arrow). (G) Cross-sectional, cumulative PS-OCT image. The tumor showed low retardation, and some prominent high-retardant spikes projected from the LP into the low-retardance EP were found (white arrowheads). (H) An en-face birefringence map reveals a 3.62 mm lesion with low birefringence in the background and a highly birefringent septum and capsule. (I) Histology with H&E staining revealed a 3.3 mm tumor with a full thickness of dysplasia of EP. (J) Histology with Masson’s trichrome staining showed that collagen abundance elongated the core of the papilla (black arrowheads) projected from the LP into the EP and separated the dysplastic cell mass. These changes were compatible with the en-face birefringence map, in which the low birefringence background (dysplastic cell mass) was surrounded and separated by a high birefringence capsule and septum (the elongated core of papilla).
Figure 4
Figure 4
En-face birefringence maps from normal to cancers. (A) Bright spots against a dark blue background were seen in a normal tongue. (B) Crowded and blurred bright spots against a dark blue background in hyperplastic change. (C,D) Apparent malignant lesions (white arrowheads), with a low birefringence background and highly birefringent capsule and septum that can be seen clearly.
Figure 5
Figure 5
Compare en-face intensity images to the en-face birefringence maps. (A) Malignant lesions of tongues. The tumor can be seen clearly in these two en-face images (B) Hyperplastic changes of tongues. In en-face intensity images (upper pictures), the heterogeneous area was seen (circle area), which mimic the tumor. In corresponding en-face birefringence maps, the distribution of bright spots in the circle area without significant demarcation lines indicates hyperplastic change without a tumor.
Figure 6
Figure 6
(A) Setup of the swept-source, polarization-sensitive optical coherence tomography (SS PS-OCT) imaging system (PC: polarization controller; FPBS: fiber polarization beam splitter). (B) Process of the en-face birefringence map: a gray-level thresholding algorithm was used to binarize the intensity image and find out the upper border of the surface automatically. After determining the surface, the fixed depth (70 pixels, about 410 µm) was set to the corresponding cumulative phase retardation image. Then, linear curve fitting was performed between the surface and selected depth to each A-lines. The slope value (Δn) of each A-line was presented in an en-face birefringence map. (4 × 4 mm in the xy plane).

References

    1. Bray F., Ren J.S., Masuyer E., Ferlay J. Global estimates of cancer prevalence for 27 sites in the adult population in 2008. Int. J. Cancer. 2013;132:1133–1145. doi: 10.1002/ijc.27711. - DOI - PubMed
    1. Warnakulasuriya S. Global epidemiology of oral and oropharyngeal cancer. Oral Oncol. 2009;45:309–316. doi: 10.1016/j.oraloncology.2008.06.002. - DOI - PubMed
    1. Downer M.C., Moles D.R., Palmer S., Speight P.M. A systematic review of test performance in screening for oral cancer and precancer. Oral Oncol. 2004;40:264–273. doi: 10.1016/j.oraloncology.2003.08.013. - DOI - PubMed
    1. Mehanna H.M., Rattay T., Smith J., McConkey C.C. Treatment and follow-up of oral dysplasia—A systematic review and meta-analysis. Head Neck. 2009;31:1600–1609. doi: 10.1002/hed.21131. - DOI - PubMed
    1. Yang E.C., Tan M.T., Schwarz R.A., Richards-Kortum R.R., Gillenwater A.M., Vigneswaran N. Noninvasive diagnostic adjuncts for the evaluation of potentially premalignant oral epithelial lesions: Current limitations and future directions. Oral Surg. Oral Med. Oral Pathol. Oral Radiol. 2018;125:670–681. doi: 10.1016/j.oooo.2018.02.020. - DOI - PMC - PubMed