

Multiple Xenosteroid Pollutants Biomarker Changes in Xultured Nile Tilapia Using Wastewater Effluents as Their Primary Water Source
- PMID: 32842613
- PMCID: PMC7552199
- DOI: 10.3390/ani10091475
Multiple Xenosteroid Pollutants Biomarker Changes in Xultured Nile Tilapia Using Wastewater Effluents as Their Primary Water Source
Abstract
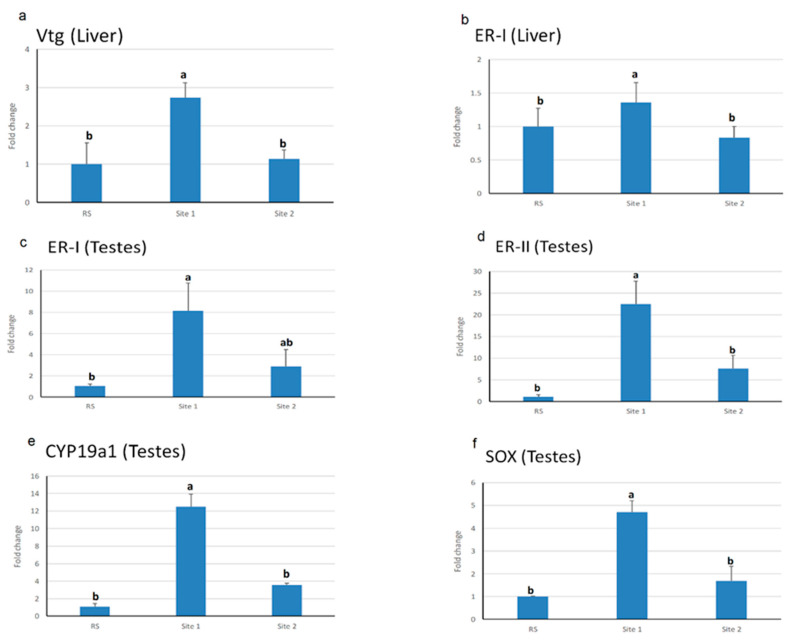
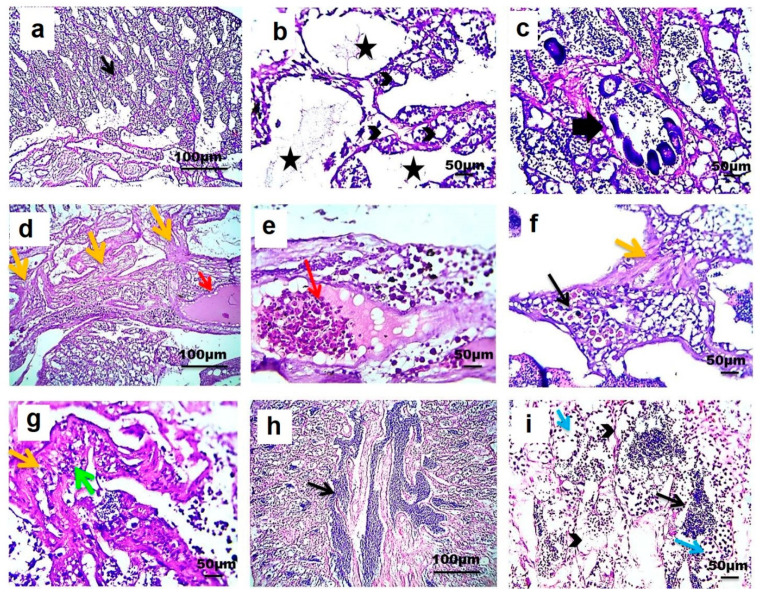
This study was undertaken to screen levels of xenosteroids (estrogenic endocrine disrupting chemicals/E-EDCs) in Nile tilapia (Oreochromis niloticus) fish farms subjected to water fill from the drain at three sites S1 (highly polluted), S2 (moderately polluted), and a putative reference site (RS). Biometric, hormonal, gene expression, and histopathological analysis were investigated. Testosterone, progesterone, and zeranol residues were detected at (0.12-3.44 µg/L) in water samples of different sites. Bisphenol-A (BPA) exhibited a very high concentration (6.5 µg/mL) in water samples from S1. Testosterone, 17β-estradiol residues were detected in fish tissues from all sites at (0.16-3.8 µg/Kg) and (1.05-5.01 µg/Kg), respectively. BPA residues were detected at a very high concentration in the liver and muscle of fish collected from S1 at higher levels of 25.9 and 48.07 µg/Kg, respectively. The detected E-EDCs, at different sites, particularly BPA, reduced the somatic and testicular growth among sites and oversampling time points. Meanwhile, hepatosomatic index (HSI) was significantly increased in S1 compared to S2. All analyzed genes estrogen receptor-type I (er-I, er-ɑ) and II (er-II, er-ß1), polypeptide 1a (cyp19a1), SRY-box containing gene 9 (sox9), and vitellogenin (vtg) and gonadotropin hormones (luteinizing hormone (LH), follicle-stimulating hormone (FSH)), testosterone, 17β-estradiol, and anti-Mullerian hormone (AMH) were significantly expressed at S1 compared to other sites. Histopathology was more evident in S1 than other sites. These findings warrant immediate strategies development to control aquatic pollution and maintain fish welfare and aquaculture sustainability.
Keywords: EDCs; Lake Manzala; fish; histopathology; hormonal disturbances; reproductive gene dysfunction.
Conflict of interest statement
The authors declare no conflict of interest.
Figures


References
-
- General Authority for Fish Resources Development GAFRD . Fish Statistics Year Book. Ministry of Agriculture and Land Reclamation; Cairo, Egypt: 2014.
-
- El-Sayed A.-F., Dickson M., El-Naggar G.O. Value chain analysis of the aquaculture feed sector in Egypt. Aquaculture. 2015;437:92–101. doi: 10.1016/j.aquaculture.2014.11.033. - DOI
-
- El-Sayed A.F.M. Regional Review on Status and Trends in Aquaculture Development in the Near East and North Africa-2015. FAO Fisheries and Aquaculture Circular; food and agriculture organization of the united nations (FAO); Rome, Italy: 2017. p. 43.
-
- Ojaveer H., Tomkiewicz J., Arula T., Klais R. Female ovarian abnormalities and reproductive failure of autumn-spawning herring (Clupea harengus membras) in the Baltic Sea. ICES J. Mar. Sci. 2015;72:2332–2340. doi: 10.1093/icesjms/fsv103. - DOI
-
- Molnar J.L., Gamboa R.L., Revenga C., Spalding M.D. Assessing the global threat of invasive species to marine biodiversity. Front. Ecol. Environ. 2008;6:485–492. doi: 10.1890/070064. - DOI
Grants and funding
LinkOut - more resources
Full Text Sources
Research Materials
