. 2020 Aug 22;21(17):6055.
doi: 10.3390/ijms21176055.

Analysis of Early Cone Dysfunction in an In Vivo Model of Rod-Cone Dystrophy

Affiliations

Analysis of Early Cone Dysfunction in an In Vivo Model of Rod-Cone Dystrophy

Mark M Hassall et al. Int J Mol Sci. .

Abstract

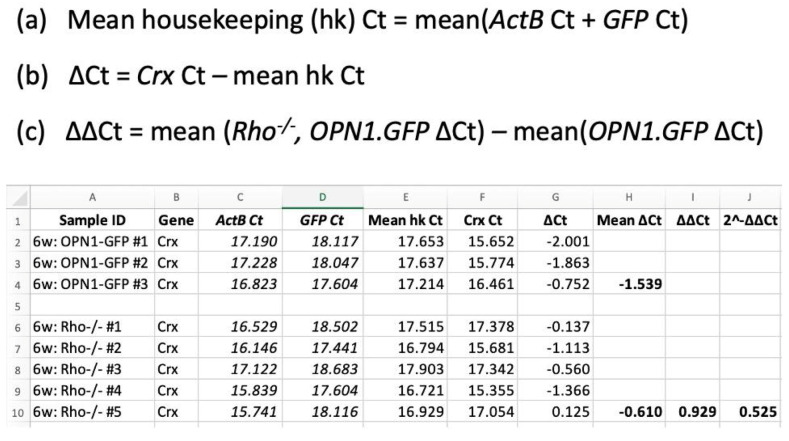
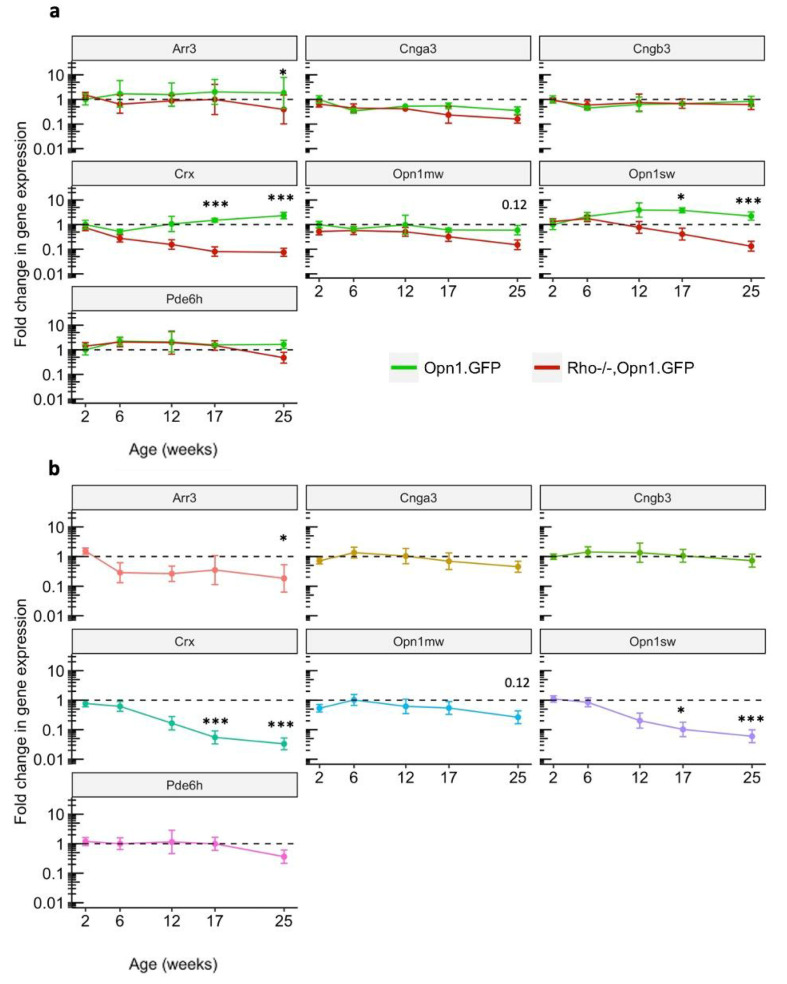
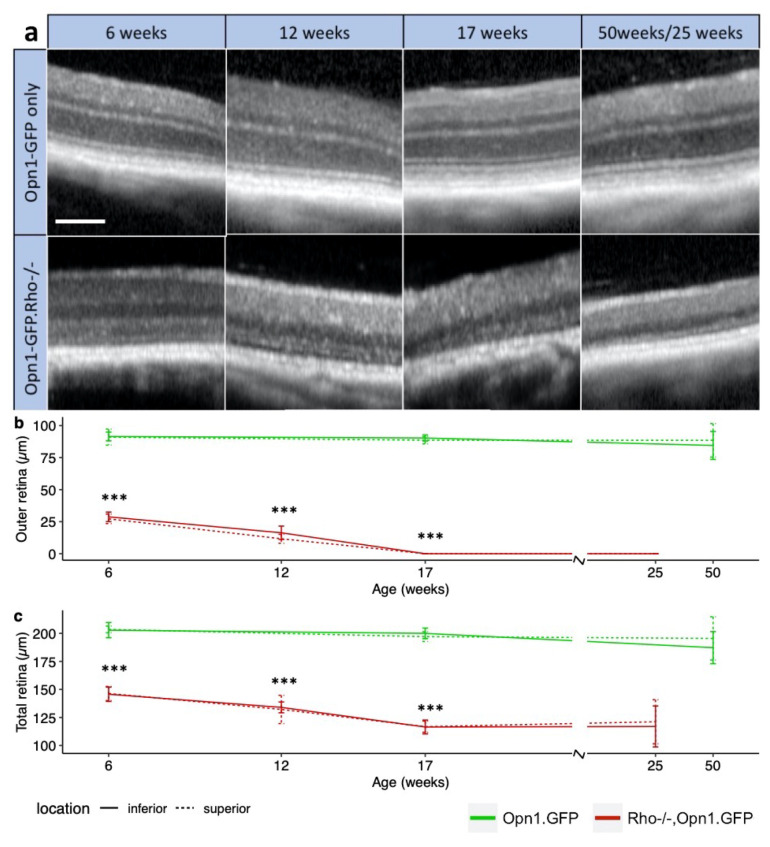
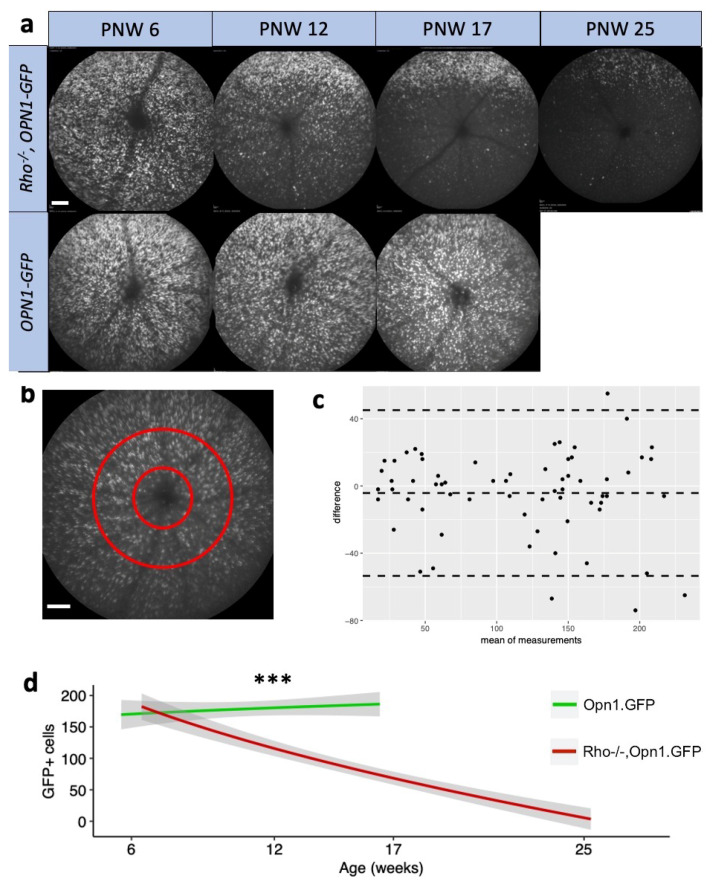
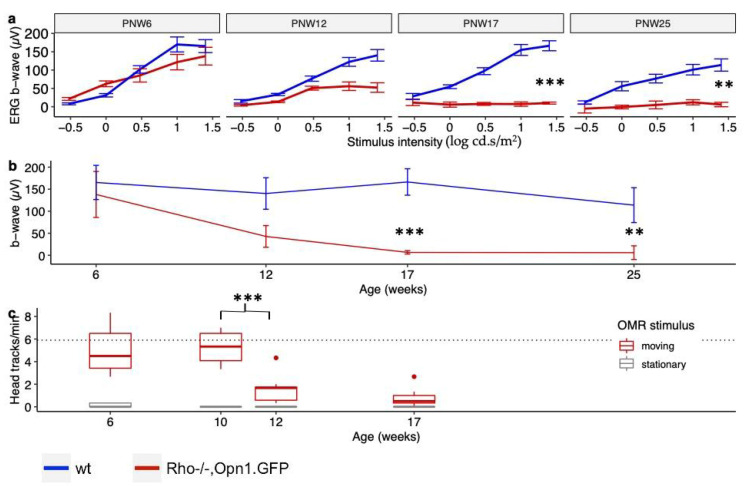
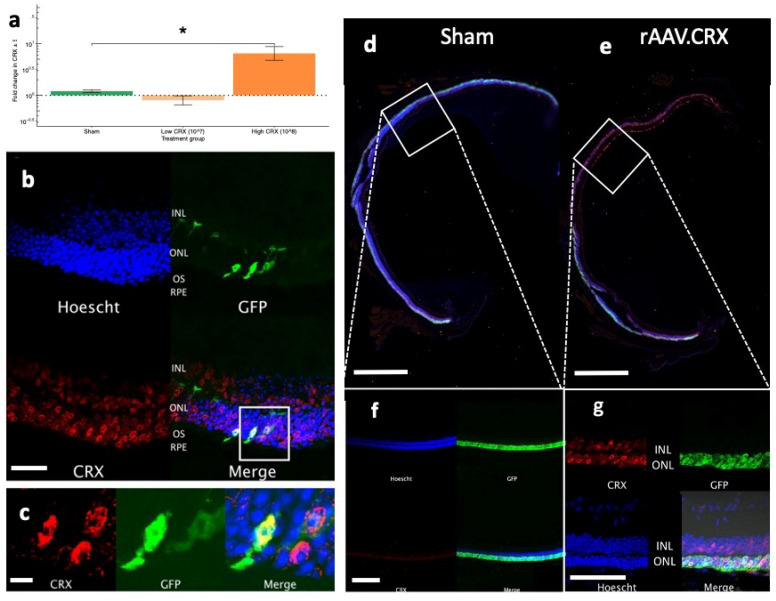
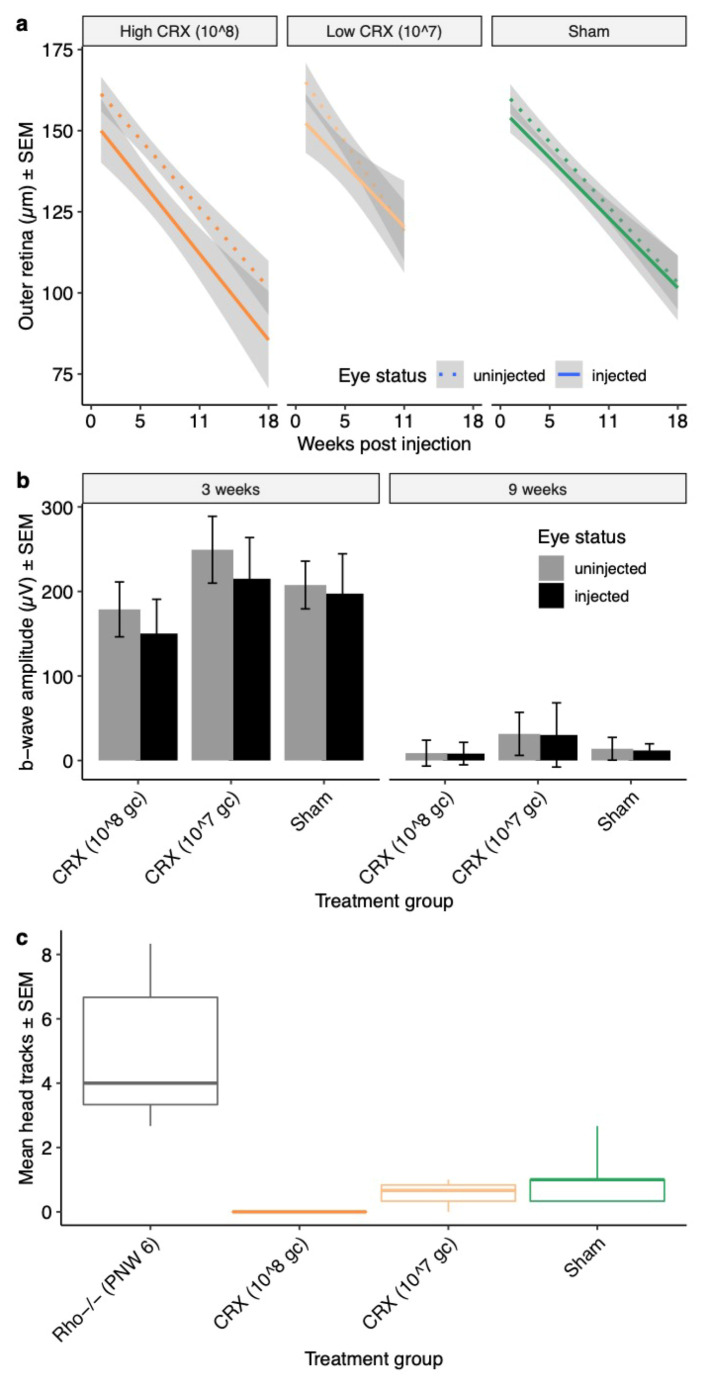
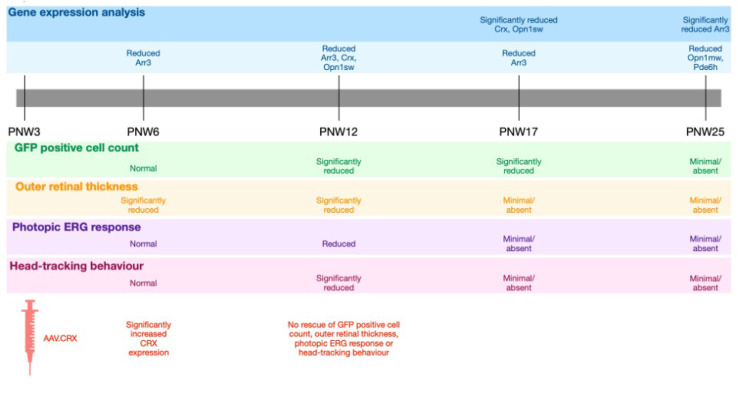
Retinitis pigmentosa (RP) is a generic term for a group of genetic diseases characterized by loss of rod and cone photoreceptor cells. Although the genetic causes of RP frequently only affect the rod photoreceptor cells, cone photoreceptors become stressed in the absence of rods and undergo a secondary degeneration. Changes in the gene expression profile of cone photoreceptor cells are likely to occur prior to observable physiological changes. To this end, we sought to achieve greater understanding of the changes in cone photoreceptor cells early in the degeneration process of the Rho-/- mouse model. To account for gene expression changes attributed to loss of cone photoreceptor cells, we normalized PCR in the remaining number of cones to a cone cell reporter (OPN1-GFP). Gene expression profiles of key components involved in the cone phototransduction cascade were correlated with tests of retinal cone function prior to cell loss. A significant downregulation of the photoreceptor transcription factor Crx was observed, which preceded a significant downregulation in cone opsin transcripts that coincided with declining cone function. Our data add to the growing understanding of molecular changes that occur prior to cone dysfunction in a model of rod-cone dystrophy. It is of interest that gene supplementation of CRX by adeno-associated viral vector delivery prior to cone cell loss did not prevent cone photoreceptor degeneration in this mouse model.

Keywords: cone photoreceptors; gene therapy; retina; retinitis pigmentosa; rod-cone dystrophy.


Conflict of interest statement

The authors declare no conflict of interest. The funders had no role in the design of the study; in the collection, analyses, or interpretation of data; in the writing of the manuscript, or in the decision to publish the results.

Figures

Figure A1
Figure A1
Detailed example of the ΔΔCt normalization of cone gene qPCR data using the published method [9]. The example gene here is Crx at the PNW6 time point. The first equation (a) describes the calculation of the mean housekeeping (hk) Ct value as the mean of the ActB and GFP housekeeping genes. Equation (b) describes the first delta (Δ) normalization of the test gene (Crx; column F) by subtraction of the mean housekeeping Ct (Mean hk Ct: Column E), to produce the ΔCt values in column G. The final equation (c) describes the calculation of the ΔΔCt value from the ΔCt values of the OPN1-GFP and Rho−/−, OPN1-GFP mice. The final calculated 2−ΔΔCt values are represented graphically in Figure 2b, with the OPN1-GFP 2−ΔΔCt represented as a dotted line at y = 1.
Figure 1
Figure 1
Gene expression analysis of cone phototransduction genes. (a) Gene expression data over time (post-natal week, PNW, 2, 6, 12, 17 and 25) showing 2−∆∆Cq values for Rho−/−OPN1-GFP mice and OPN1-GFP mice. ΔΔCt values calculated by double normalizing the test gene to the mean of ActB and GFP reference gene levels, then comparing each time point against OPN1-GFP mouse expression levels at PNW2 baseline. The dotted line represents the gene expression baseline of OPN1-GFP mice at PNW2 for each gene. Crx and Opn1sw genes show significantly different reduced expression patterns at PNW17 and PNW25, a trend that is already emerging at PNW12. The other genes are not significantly different between genotypes, but many do significantly change from PNW2 baseline. (b) The same gene expression data, displaying ΔΔCt values calculated by double normalizing the test gene to the mean of ActB and GFP reference gene levels, then comparing each time point against OPN1-GFP mouse expression levels at the same time point (OPN1-GFP1 values represented by the dotted line). Full statistical model results available in Supplementary Table S1; All values are mean ± SEM. Tissue samples collected at PNW2 (OPN1-GFP n = 8, Rho−/−OPN1-GFP n = 8), PNW6 (n = 3, n = 5), PNW12, (n = 3, n = 3), PNW17 (n = 3, n = 4), and PNW25 (n = 3, n = 3). * denotes p < 0.05, *** denotes p < 0.001.
Figure 2
Figure 2
Changes in retinal structural in Rho−/−OPN1-GFP mice. (a) Representative OCT images for Rho−/−OPN1-GFP mice and OPN1-GFP controls at each time point, showing the loss of outer retina. White scale bar = 100µm. (b) Degeneration of the outer retinal thickness and (c) total retinal thickness measured on OCT for Rho−/−OPN1-GFP mice (red) occurs rapidly and differs from non-degenerate OPN1-GFP mice (green) as early as PNW6. Total retinal thickness was measured from the inner margin of the nerve fiber layer to the inner margin of the RPE. Outer retinal thickness was measured from the inner margin of the outer nuclear layer to the inner margin of the RPE. *** denotes p < 0.001; values are mean ± SEM. Tissue collected from Rho−/−OPN1-GFP PNW 6 (n = 7 mice), PNW 12 (n = 3), PNW 17 (n = 8), and PNW 25 (n = 3) and in wild-type OPN1-GFP mice at PNW 6 (n = 4), PNW 17 (n = 6) and PNW 50 (n = 2).
Figure 3
Figure 3
Changes in GFP positive cone photoreceptor cells in Rho−/−OPN1-GFP mice. (a) Representative cSLO images demonstrating that Rho−/−OPN1-GFP mice show a decline in GFP positive cone cells in vivo, compared to the steady cone population in the OPN1-GFP mice. Representative images demonstrate the gross pattern of in vivo GFP positive cone cell loss in Rho−/−OPN1-GFP mice. White scale bar = 0.1mm (b) To quantify the magnitude of loss of cones, a central annulus was sampled for manual particle counts using the ImageJ counter plugin. White scale bar = 0.1mm (c) Bland-Altman plot showing the difference in manual counts between the left and right eyes across the mice shows no obvious systematic error. Some mice had substantial inter-eye differences of GFP-positive cone cells, which is similar to the asymmetric progression of IRDs observed in humans. (d) Manual cell counts of fluorescent GFP cells in en face cSLO images of the retina showing loss of cone GFP signal in Rho−/−OPN1-GFP mice and OPN1-GFP mice at cross-sectional timepoints PNW 6 (n = 9 mice; n = 9 mice respectively), PNW 12 (n = 5; n = 4), PNW 17 (n = 12; n = 5), and PNW 25 (n = 6; n = 0). *** denotes p < 0.001; values are mean cell count ± 95% CI (grey band).
Figure 4
Figure 4
Changes in retinal function in Rho−/−OPN1-GFP mice. (a) Light-adapted ERG b-wave amplitudes for a range of stimulus intensities (−0.5 to 1.5 log cd.s/m2) comparing Rho−/−OPN1-GFP mice and wild-type mice at PNW 6 (n = 7; n = 6, respectively), PNW 12 (n = 2; n = 5), PNW 17 (n = 7; n = 6) and PNW 25 (n = 3; n = 4). *** denotes p < 0.001; ** denotes p < 0.01; All values mean ± SEM. (b) The same ERG data, displaying only the light-adapted ERG b-wave amplitudes for 1.5 log cd.s/m2 flash stimulus for both mouse strains over time. There is rapid loss of cone function in Rho−/−OPN1-GFP mice. All values mean ± SEM. (c) OMR photopic head-tracking behavior in Rho−/−OPN1-GFP mice at PNW 6 (n = 5 mice), PNW 12 (n = 3), PNW 17 (n = 4), and PNW 25 (n = 5). Loss of head tracking occurs between 10 and 12 weeks (p < 0.001). Null-stimulus OMR test conditions provided as controls (grey boxes) and ‘wt’ OPN1-GFP mouse head-tracking behavior provided as healthy reference (dotted line). All values IQR ± 95% CI, points represent outliers.
Figure 5
Figure 5
CRX transgene overexpression by subretinal rAAV injections. (a) Fold-change in CRX gene expression in Rho−/−OPN1-GFP mouse retinas injected with high dose rAAV.CRX (1.5 × 10⁸ gc; dark orange; n = 4), low dose rAAV.CRX (1.5 × 10⁷ gc; light orange; n = 4) or sham PBS (green; n = 4). A significant increase occurred in only the 1.5 × 10⁸ gc treated retinas. * denotes p < 0.05 compared to sham eyes. All values mean ± SEM. (b) Superior retina of an rAAV.CRX (1.5 × 10⁸ gc) treated eye in an Rho−/−, OPN1-GFP mouse sacrificed at PNW 10 (7 weeks following surgery). Nuclear-specific Crx staining is seen throughout the outer nuclear layer and, more lightly, in the inner nuclear layer. Scale bar = 25µm (c) Enlarged area of interest showing colocalization of CRX with endogenous GFP in cone photoreceptors, confined to the nuclei and not extending into the outer segment. CRX staining also occurs in other non-GFP labelled nuclei which are likely rod cells. Scale bar = 5µm (e,g) rAAV.CRX (1.5 × 10⁸ gc) injected pilot study Rho−/−Nrl-GFP retinas showing CRX staining in the ONL and INL. rAAV.CRX injected superior retinas showed a far stronger CRX staining pattern compared to the inferior retinas of the injected eyes, as well as contralateral sham injected eyes (d,f). Scale bars d,e both = 1mm. Scale bars f,g both = 50µm.
Figure 6
Figure 6
Rescue effect of rAAV.CRX on cone pathway function and retinal structure in Rho−/−, OPN1-GFP mice. (a) Average thickness of superior the outer retina during the study period shows equivalent age-related decline in total retinal thickness of uninjected eyes. No group had slower outer retinal loss in the injected eye. All values are mean µM ± 95% confidence intervals (grey band). (b) Light-adapted ERG response to 25 cd.s/m2 photopic flash stimulus at PNW 6 (3 weeks post injection) and PNW 12 (9 weeks post injection) in Rho−/−, OPN1-GFP mice, comparing b-waves of injected and uninjected eyes. None of the groups showed rescue of ERG function in injected eyes at PNW 12. All values are mean µV ± SEM. (c) OMR in photopic testing conditions of Rho−/−, OPN1-GFP mice 10 weeks following rAAV.CRX or PBS sham injection (PNW13). Uninjected Rho−/−, OPN1-GFP controls at PNW 6 (n = 5; grey) are included for comparison. There is limited head-tracking behavior in each of the treatment groups and no rAAV treatment group showed rescue of head-tracking behavior. (All values mean head tracks/minute ± SEM bars. For each panel, treatments groups are high dose AAV.CRX (108 gc/µL; n= 14 mice; dark orange), low dose AAV.CRX (107 gc/µL; n= 17 mice; light orange) or PBS sham (n = 17 mice; green).
Figure 7
Figure 7
Summary of the changes in gene expression and phenotype over time in Rho−/−, OPN1-GFP mice.

References

    1. Haim M. Epidemiology of retinitis pigmentosa in Denmark. Acta Ophthalmol. Scand. Suppl. 2002:1–34. doi: 10.1046/j.1395-3907.2002.00001.x. - DOI - PubMed
    1. Mustafi D., Engel A.H., Palczewski K. Structure of cone photoreceptors. Prog. Retin. Eye Res. 2009;28:289–302. doi: 10.1016/j.preteyeres.2009.05.003. - DOI - PMC - PubMed
    1. Schnapf J.L., Kraft T.W., Baylor D.A. Spectral sensitivity of human cone photoreceptors. Nature. 1987;325:439–441. doi: 10.1038/325439a0. - DOI - PubMed
    1. Blackshaw S., Fraioli R.E., Furukawa T., Cepko C.L. Comprehensive analysis of photoreceptor gene expression and the identification of candidate retinal disease genes. Cell. 2001;107:579–589. doi: 10.1016/S0092-8674(01)00574-8. - DOI - PubMed
    1. Corbo J.C., Myers C.A., Lawrence K.A., Jadhav A.P., Cepko C.L. A typology of photoreceptor gene expression patterns in the mouse [Internet] Proc. Natl. Acad. Sci. USA. 2007;104:12069–12074. doi: 10.1073/pnas.0705465104. - DOI - PMC - PubMed

MeSH terms

LinkOut - more resources