. 2020 Aug;17(169):20200216.
doi: 10.1098/rsif.2020.0216. Epub 2020 Aug 26.

Visualizing mineralization processes and fossil anatomy using synchronous synchrotron X-ray fluorescence and X-ray diffraction mapping

Affiliations

Visualizing mineralization processes and fossil anatomy using synchronous synchrotron X-ray fluorescence and X-ray diffraction mapping

Pierre Gueriau et al. J R Soc Interface. 2020 Aug.

Abstract

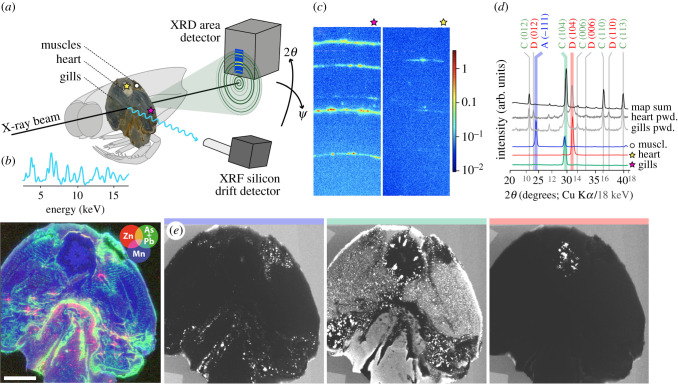
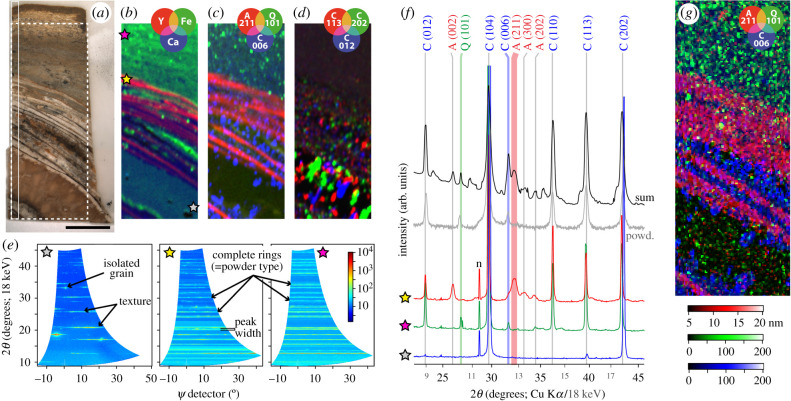
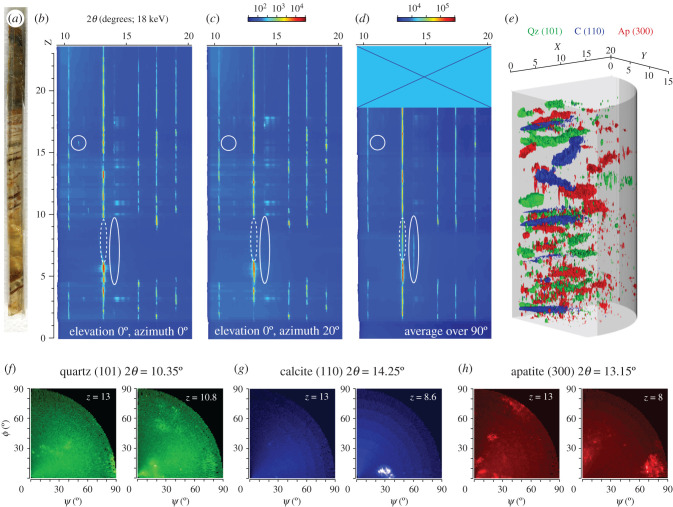
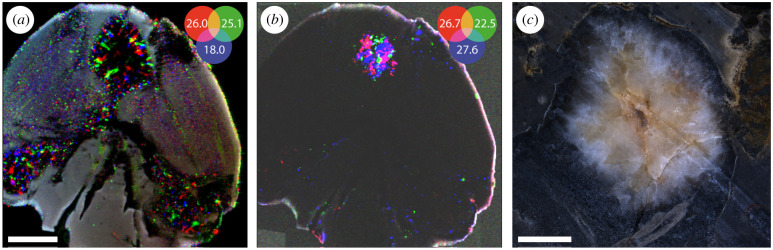
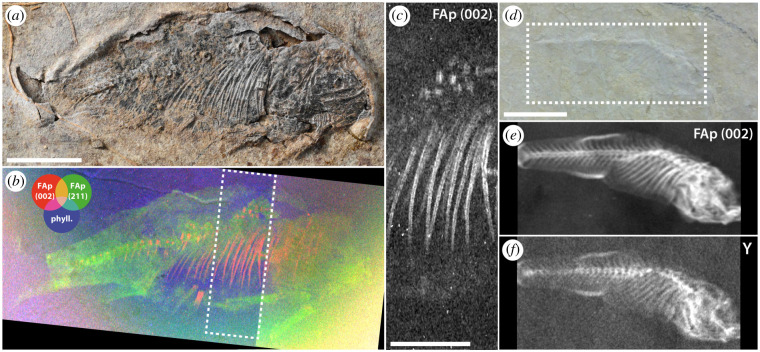
Fossils, including those that occasionally preserve decay-prone soft tissues, are mostly made of minerals. Accessing their chemical composition provides unique insight into their past biology and/or the mechanisms by which they preserve, leading to a series of developments in chemical and elemental imaging. However, the mineral composition of fossils, particularly where soft tissues are preserved, is often only inferred indirectly from elemental data, while X-ray diffraction that specifically provides phase identification received little attention. Here, we show the use of synchrotron radiation to generate not only X-ray fluorescence elemental maps of a fossil, but also mineralogical maps in transmission geometry using a two-dimensional area detector placed behind the fossil. This innovative approach was applied to millimetre-thick cross-sections prepared through three-dimensionally preserved fossils, as well as to compressed fossils. It identifies and maps mineral phases and their distribution at the microscale over centimetre-sized areas, benefitting from the elemental information collected synchronously, and further informs on texture (preferential orientation), crystallite size and local strain. Probing such crystallographic information is instrumental in defining mineralization sequences, reconstructing the fossilization environment and constraining preservation biases. Similarly, this approach could potentially provide new knowledge on other (bio)mineralization processes in environmental sciences. We also illustrate that mineralogical contrasts between fossil tissues and/or the encasing sedimentary matrix can be used to visualize hidden anatomies in fossils.

Keywords: (bio)mineralization; exceptional fossilization; mineral/life interactions; synchrotron imaging.


Conflict of interest statement

We declare we have no competing interests.

Figures

Figure 1.
Figure 1.
SRS-XRFD of a millimetre-thick transversal section of the thylacocephalan arthropod Dollocaris ingens (specimen MNHN.F.A66910) from the La-Voulte-sur-Rhône Lagerstätte (Jurassic, France). (a) Schematic view of the setup; while laterally scanning the sample with a high-energy X-ray beam, an XRD image (blue square) is collected at each pixel using a two-dimensional area detector that intercepts portions of the diffraction rings (red). Simultaneously, an XRF dataset is also acquired in reflection. (b) Mean XRF spectrum from a 25-pixel area around the beam location (top), and false colour overlay of zinc (red), arsenic and lead (green) and manganese (blue) distributions (bottom). (c) XRD images from pixels in the gills and heart, showing contrasting peaks. (d) Mean diffractograms extracted from the XRD map for three different 25-pixel areas in the gills, heart and muscles (colours; acquired at 18 keV), sum diffractogram from the map (black; acquired at 18 keV), and powder XRD diffractograms obtained from the gills and heart of a more anterior section of the same specimen (grey; acquired at Cu Kα). C, D and A phases are calcite, dolomite and arsenopyrite, respectively. (e) XRD intensity maps for 2θ (18 keV) = 10.68° (blue), 13.07° (green) and 13.68° (red), showing different mineralogical contrasts associated with the diffraction peaks highlighted by the corresponding colours in (d). Acquisition parameters: 9 × 11 µm2 (H × V) beam spot size, 75 × 75 µm2 scan step, 108 900 pixels, 150 (XRF) and 180 (XRD) ms couting times per pixel (total acquisition time 4 h 51 min). Scale bar = 5 mm.
Figure 2.
Figure 2.
SRS-XRFD of a millimetre-thick transversal section through the lung plates of the coelacanth Axelrodichthys araripensis (specimen UERJ-PMB 143) from the Santana Formation of the Araripe Basin (Lower Cretaceous, northeastern Brazil). (a) Optical photograph of the section. Scale bar = 5 mm. The dotted and solid box areas, respectively, indicate the area imaged in (b–d,g) and the location where the rod-shaped sample in figure 3 was extracted. (b) False colour overlay of yttrium (red), iron (green) and calcium (blue) distributions from XRF. (c) False colour overlay of XRD intensity maps for 2θ (18 keV) of apatite (211) (red; 12.70°), quartz (101) (green; 10.40°) and calcite (006) (blue; 12.47°). (d) False colour overlay of calcite crystalline planes (113) (red), (202) (green) and (012) (blue) intensity maps showing large intensity fluctuations attributed to texture. (e) Combined XPAD images for the three areas identified by stars in (b) after conversion to (2θψ) coordinates. (f) Mean diffractograms extracted from the XRD map for the three 24-pixel areas identified by stars in (b) (colours; acquired at 18 keV), sum diffractogram from the map (black; acquired at 18 keV), and a powder XRD diffractogram obtained from the sedimentary matrix (grey; acquired at Cu Kα). (g) Overlay of apatite (211) (red), quartz (101) (green) and calcite (006) (blue) crystallites size. Acquisition parameters: 100 × 100 µm2 (H × V) beam spot size, 100 × 100 µm2 scan step, 25 894 pixels (slightly cropped herein), 45 (XRF) and 37.3 (XRD) ms counting times per pixel (total acquisition time 34 min). The XRF and XRD data were acquired simultaneously.
Figure 3.
Figure 3.
Pole figures along a rod-shaped sample extracted from the section through the lung plates of A. araripensis (specimen UERJ-PMB 143) shown in figure 2a. (a) Optical photograph of the sample. (b,c) Integrated 2θ intensities along the sample (z-axis), represented as colour map (logarithmic colour scale, from blue to red) for a fixed elevation (0°) and two particular azimuths, 0° (b) and 20° (c). Note the presence of the XRD ‘gap’ in the sample region z = 5 to 9 mm. (d) 2θ intensities averaged over 90° azimuth and elevation ranges. Regions where XRD peaks are different between panels (b) and (c), or only detected in (d), are highlighted by the circles and ellipses, respectively. (e) Three-dimensional representation as iso-surfaces of pole figures along the sample, for particular peaks corresponding to apatite (300, 2θ = 13.15°; red), quartz (101, 2θ = 10.35°; green) and calcite (110, 2θ = 14.25°; blue). (f–h) Pole figures (log10 scale, first quadrant only) for quartz (101) (f), calcite (110) (g) and apatite (300) (h) at z = 13 mm (left) and another z position where an XRD ‘slab’ can be seen in the three-dimensional view (colour code as in figure 2g, using identical amplitudes for each 2θ). All the measurements were performed at an X-ray beam energy of 18 keV.
Figure 4.
Figure 4.
Textured mineralization of the heart in the thylacocephalan arthropod D. ingens (specimen MNHN.F.A66910) from the La-Voulte-sur-Rhône Lagerstätte (Jurassic, France). (a) False colour overlay of different calcite crystalline planes (for different values of 2θ, in degrees, at 18 keV). (b) False colour overlay of different dolomite crystalline planes (for different values of 2θ, in degrees, at 18 keV). (c) Optical close-up of the heart, showing some of the elongated crystals of calcite at the periphery and much poorly organized dolomite at the centre. Acquisition parameters: 9 × 11 µm2 (H × V) beam spot size, 75 × 75 µm2 scan step, 108 900 pixels, 180 ms counting time per pixel (total acquisition time 4 h 51 min). Scale bar = 5 mm in (a,b) and 1 mm in (c).
Figure 5.
Figure 5.
SRS-XRFD imaging of compressed fossil fishes. (a) Optical photograph of the osteoglossomorph L. ancestralis (specimen 099-PV-DZ-UERJ) from the Sanfransiscana Basin, Quiricó Formation (Barremian, southeastern Brazil). (b) False colour overlay of XRD intensity maps for fluorapatite (200) (red) and (211) (green), and phyllosilicates (blue). (c) XRD intensity map for fluorapatite (002), close-up from the box area in (b). Acquisition parameters: 50 × 50 µm2 (H × V) beam spot size, 35 × 35 µm2 scan step, 1 182 149 pixels (slightly cropped herein), 30 ms counting time per pixel (total acquisition time 24 h 03 min). (d) Optical photograph of a hidden cyprinodontiform Prolebias goreti (specimen MNHN.F.CRT255) from the Apt-Céreste-Forcalquier Basin (Rupelian, Céreste-Bastide du bois, southern France). (e) XRD intensity map for fluorapatite (002). (f) Yttrium distribution from XRF. Acquisition parameters: 100 × 100 µm2 (H × V) beam spot size, 100 × 100 µm2 scan step, 60 750 pixels (cropped herein), 54 (XRF) and 47.8 (XRD) ms counting times per pixel (total acquisition time 1 h 28 min). Scale bar = 1 cm in (a,b,d–f) and 5 mm in (c).

References

    1. Briggs DEG. 2003. The role of decay and mineralization in the preservation of soft-bodied fossils. Annu. Rev. Earth Planet. Sci. 31, 275-301. (10.1146/annurev.earth.31.100901.144746) - DOI
    1. Wilson P, Parry LA, Vinther J, Edgecombe GD. 2016. Unveiling biases in soft-tissue phosphatization: extensive preservation of musculature in the Cretaceous (Cenomanian) polychaete Rollinschaeta myoplena (Annelida: Amphinomidae). Palaeontology 59, 463-479. (10.1111/pala.12237) - DOI
    1. Orr PJ, Briggs DEG, Kearns SL. 1998. Cambrian Burgess Shale animals replicated in clay minerals. Science 281, 1173-1175. (10.1126/science.281.5380.1173) - DOI - PubMed
    1. Koenig AE, Rogers RR, Trueman CN. 2009. Visualizing fossilization using laser ablation–inductively coupled plasma–mass spectrometry maps of trace elements in Late Cretaceous bones. Geology 37, 511-514. (10.1130/G25551A.1) - DOI
    1. Bergmann U, Morton RW, Manning PL, Sellers WI, Farrar S, Huntley KG, Wogelius RA, Larson PL. 2010. Archaeopteryx feathers and bone chemistry fully revealed via synchrotron imaging. Proc. Natl Acad. Sci. USA 107, 9060-9065. (10.1073/pnas.1001569107) - DOI - PMC - PubMed

Publication types