. 2020 Sep 8;117(36):22281-22292.
doi: 10.1073/pnas.1918943117. Epub 2020 Aug 25.

Global variability in seawater Mg:Ca and Sr:Ca ratios in the modern ocean

Affiliations

Global variability in seawater Mg:Ca and Sr:Ca ratios in the modern ocean

Mario Lebrato et al. Proc Natl Acad Sci U S A. .

Erratum in

Abstract

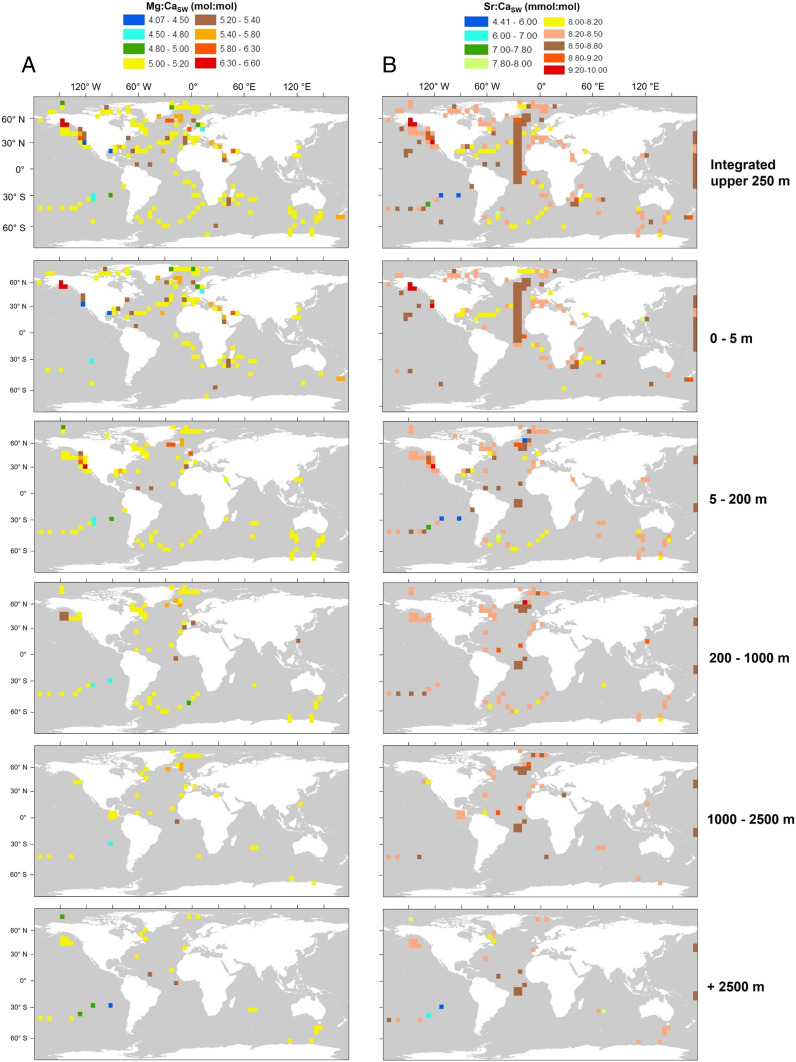
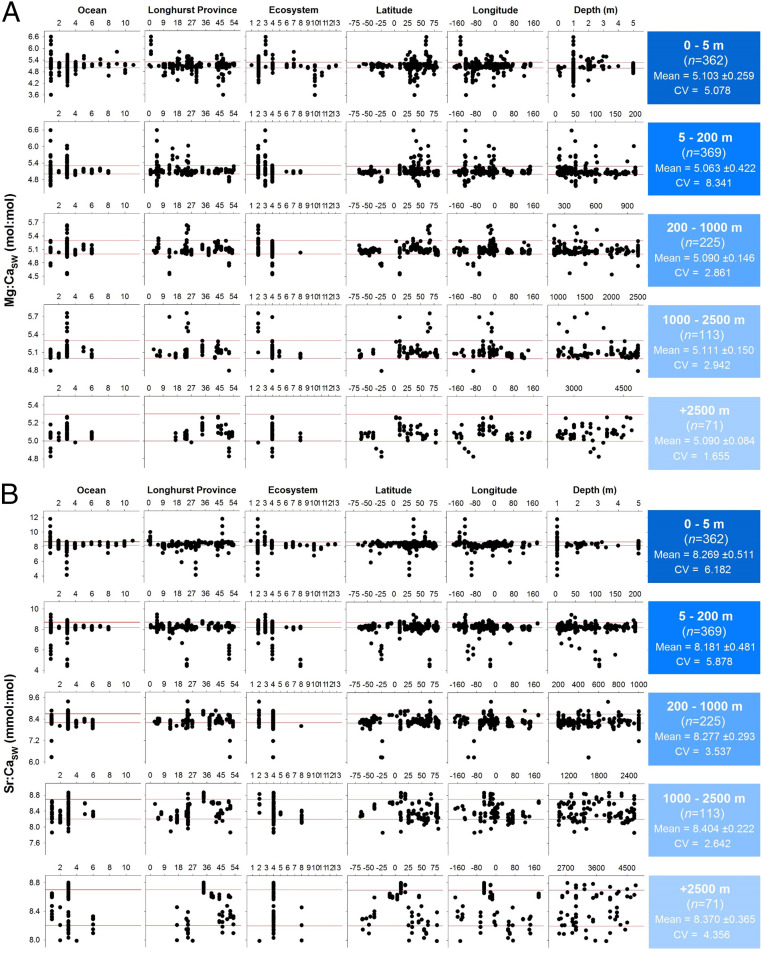
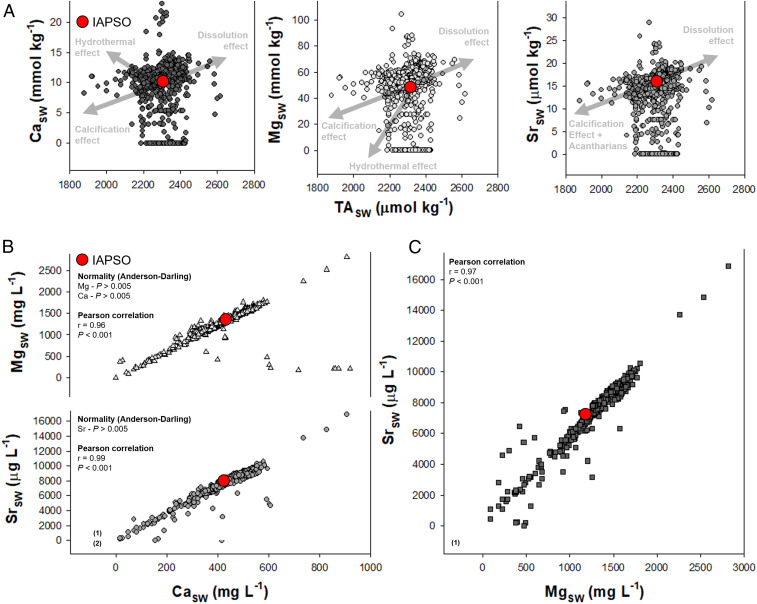
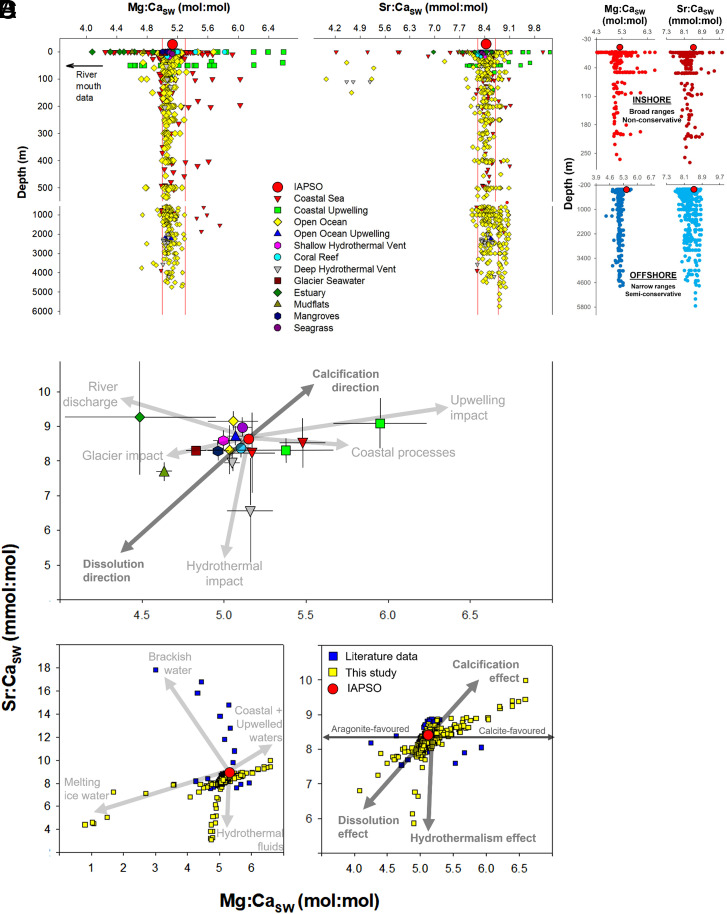
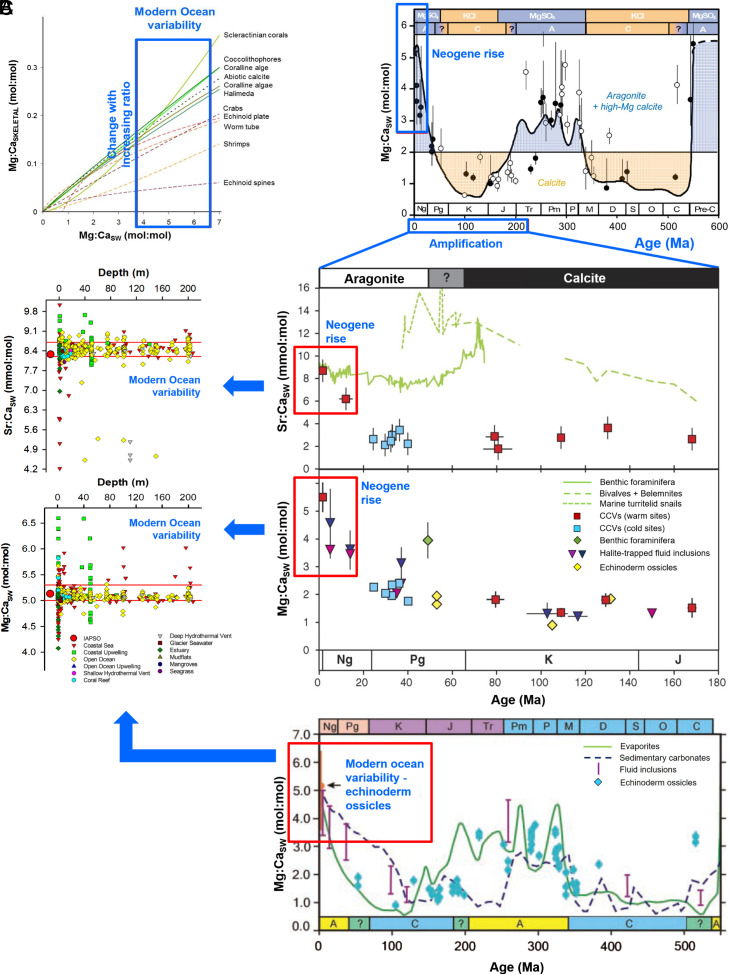
Seawater Mg:Ca and Sr:Ca ratios are biogeochemical parameters reflecting the Earth-ocean-atmosphere dynamic exchange of elements. The ratios' dependence on the environment and organisms' biology facilitates their application in marine sciences. Here, we present a measured single-laboratory dataset, combined with previous data, to test the assumption of limited seawater Mg:Ca and Sr:Ca variability across marine environments globally. High variability was found in open-ocean upwelling and polar regions, shelves/neritic and river-influenced areas, where seawater Mg:Ca and Sr:Ca ratios range from ∼4.40 to 6.40 mmol:mol and ∼6.95 to 9.80 mmol:mol, respectively. Open-ocean seawater Mg:Ca is semiconservative (∼4.90 to 5.30 mol:mol), while Sr:Ca is more variable and nonconservative (∼7.70 to 8.80 mmol:mol); both ratios are nonconservative in coastal seas. Further, the Ca, Mg, and Sr elemental fluxes are connected to large total alkalinity deviations from International Association for the Physical Sciences of the Oceans (IAPSO) standard values. Because there is significant modern seawater Mg:Ca and Sr:Ca ratios variability across marine environments we cannot absolutely assume that fossil archives using taxa-specific proxies reflect true global seawater chemistry but rather taxa- and process-specific ecosystem variations, reflecting regional conditions. This variability could reconcile secular seawater Mg:Ca and Sr:Ca ratio reconstructions using different taxa and techniques by assuming an error of 1 to 1.50 mol:mol, and 1 to 1.90 mmol:mol, respectively. The modern ratios' variability is similar to the reconstructed rise over 20 Ma (Neogene Period), nurturing the question of seminonconservative behavior of Ca, Mg, and Sr over modern Earth geological history with an overlooked environmental effect.

Keywords: Mg:Ca; Sr:Ca; biogeochemistry; global; seawater.


Conflict of interest statement

The authors declare no competing interest.

Figures

Fig. 1.
Fig. 1.
Modern ocean global variability in seawater Mg:Ca and Sr:Ca ratios. Averaged global seawater Mg:Ca (A) and Sr:Ca (B) ratios from the upper 250 m and separated in five depth intervals (0 to 5 m, 5 to 200 m, 200 to 1,000 m, 1,000 to 2,500 m, and +2,500 m), overlaid in 5° × 5° latitude/longitude quadrats (see SI Appendix, Fig. S4 for sampling effort). Extended seawater Mg:Ca ratios data from river mouths can be found in SI Appendix, Fig. S1. The final databases are deposited at the NOAA NCEI under accession number 0171017 at https://data.nodc.noaa.gov/cgi-bin/iso?id=gov.noaa.nodc:0171017 (DOI: 10.7289/V5571996).
Fig. 2.
Fig. 2.
Modern ocean seawater Mg:Ca and Sr:Ca ratios vs. environmental parameters. Data horizontally classified for seawater Mg:Ca (A) and Sr:Ca (B) ratios as a function of environmental variables (GLODAPv2; refs. and 42) from the largest to the smallest dimension, and vertically in five depth intervals of 0 to 5 m, 5 to 200 m, 100 to 1,000 m, 1,000 to 2,500 m, and +2,500 m. Data within the red lines represent literature assumed knowledge of modern seawater ratios. Code for “ocean” is 1 = Pacific, 2 = Indian, 3 = Atlantic, 4 = Arctic, 5 = Mediterranean, 6 = Southern, 7 = Red Sea, 8 = China Sea, 9 = Arabian Sea, 10 = Baltic Sea, 11 = IAPSO. Code for “Longhurst Province” is in SI Appendix, Table S1. Code for “ecosystem” is: 1 = IAPSO (this study), 2 = coastal sea, 3 = coastal upwelling, 4 = open ocean, 5 = open ocean upwelling, 6 = shallow hydrothermal vent, 7 = coral reef, 8 = deep hydrothermal vent, 9 = glacier seawater, 10 = estuary, 11 = mudflats, 12 = mangroves, 13 = seagrass. Extended analysis of seawater Mg:Ca ratios data from river mouths to assess coastal waters can be found in SI Appendix, Fig. S1. The full figure is available in the SI Appendix.
Fig. 3.
Fig. 3.
Modern ocean seawater Ca, Mg, and Sr vs. TA; Mg and Sr vs. Ca; and Sr. vs. Mg. Cross plots indicating the relations of seawater ions with TA (A) and between each other (B and C). TA is used to identify biogeochemical processes that could be impacting deviations from the ratios. (AC) IAPSO (this study) seawater composition is used for comparison. Normality test results, and Pearson correlation coefficients are included in the graphs.
Fig. 4.
Fig. 4.
Modern ocean seawater Mg:Ca and Sr:Ca ratios vs. depth, and conceptual diagrams of Sr:Ca vs. Mg:Ca to identify processes. Data classified horizontally for seawater Mg:Ca (A) and Sr:Ca (B) ratios per ecosystem, and vertically with depth. Seawater Mg:Ca ratios data from river mouths can be found in SI Appendix, Fig. S1. Data within the red lines represent literature assumed knowledge of modern seawater ratios. (C) A selection of curated seawater Mg:Ca and Sr:Ca ratios vs. depth, classified as “coastal seas” and “open ocean” to distinguish variability at large, separating the two major environments where marine science disciples obtain samples/data. (D) Cross plots of averages and SDs of modern seawater Mg:Ca vs. Sr:Ca ratios with arrows indicating the direction of change for ocean processes. Also included are individual data points cross plots comparing literature vs. this study data. In all figure panels, IAPSO (this study) seawater Mg:Ca and Sr:Ca ratios are used for comparison.
Fig. 5.
Fig. 5.
Modern ocean seawater Mg:Ca and Sr:Ca ratios compared to reconstructions over geological time intervals. (A) Relation between seawater Mg:Ca and organism skeletal Mg:Ca, indicating the effect of modern seawater Mg:Ca natural variability on marine calcification. Reprinted from ref. , which is licensed under CC BY 3.0. (B) Upper ocean integrated 250-m modern ocean values for seawater Mg:Ca and Sr:Ca in various ecosystems showing that variability is similar to the reconstructed Neogene Period (23.03 Ma). From refs. and . Reprinted with permission from AAAS. (C) Phanerozoic Period (541 Ma) values for seawater Mg:Ca and the last 200 My of seawater Mg:Ca and Sr:Ca ratios are presented for comparison with modern ocean variability. Aragonite and calcite seas periods are included, and the geological periods: J, Jurassic; K, Cretaceous; Pg, Paleogene; and Ng, Neogene. Data, boxed and within the red lines, represent literature assumed knowledge of modern seawater ratios. Reprinted from ref. , which is licensed under CC BY 3.0. In all figure panels, “IAPSO (this study)” seawater Mg:Ca and Sr:Ca ratios are used for comparison. The raw data used in the geological time reconstructions can be checked in the figure legends in the corresponding papers (8, 12, 23).

References

    1. Whitfield M., The mean oceanic residence time (MORT) concept–A rationalisation. Mar. Chem. 8, 101–123 (1979).
    1. Drever J. L., The Geochemistry of Natural Waters, (Prentice-Hall, 1982).
    1. Ries J., Review: Geological and experimental evidence for secular variation in seawater Mg/Ca (calcite-aragonite seas) and its effects on marine biological calcification. Biogeosciences 7, 2795–2849 (2010).
    1. Broecker W., Yu J., What do we know about the evolution of Mg to Ca ratios in seawater? Paleoceanogr. Paleoclimatol. 26, PA3203 (2011).
    1. Hardie L. A., Secular variation in seawater chemistry: An explanation for the coupled secular variation in the mineralogies of marine limestones and potash evaporites over the past 600 my. Geology 24, 279–283 (1996).

Publication types