. 2020 Nov;32(11):3388-3407.
doi: 10.1105/tpc.20.00235. Epub 2020 Aug 25.

Establishment of Proximity-Dependent Biotinylation Approaches in Different Plant Model Systems

Affiliations

Establishment of Proximity-Dependent Biotinylation Approaches in Different Plant Model Systems

Deepanksha Arora et al. Plant Cell. 2020 Nov.

Erratum in

Abstract

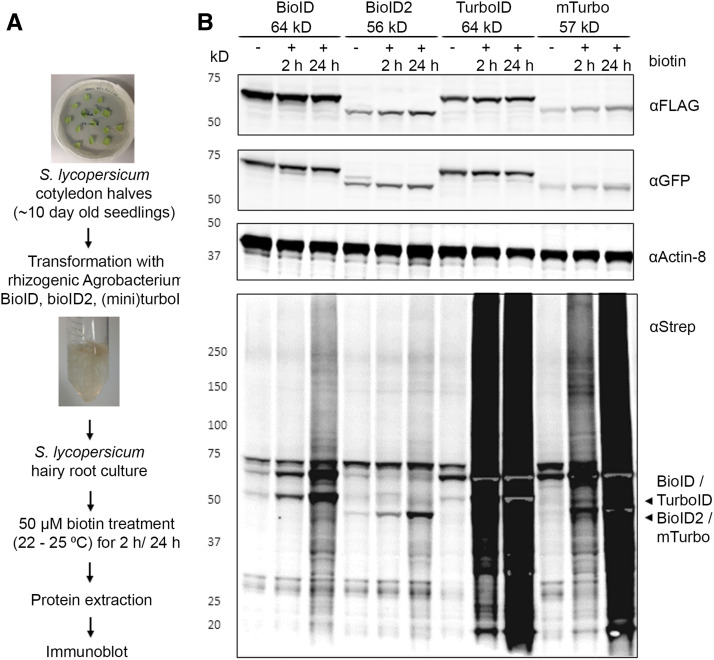
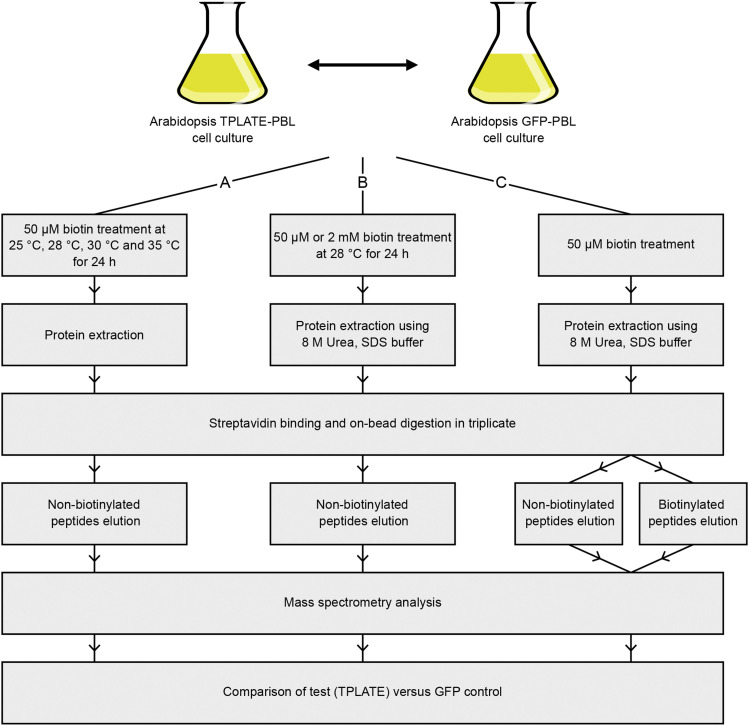
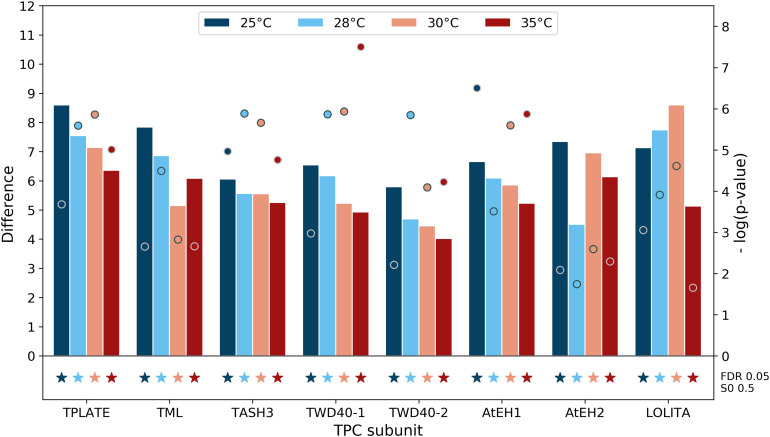
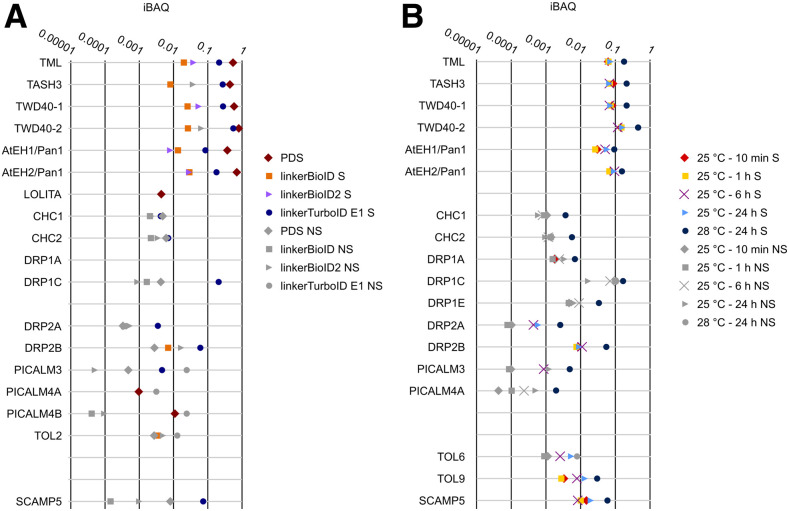
Proximity labeling is a powerful approach for detecting protein-protein interactions. Most proximity labeling techniques use a promiscuous biotin ligase or a peroxidase fused to a protein of interest, enabling the covalent biotin labeling of proteins and subsequent capture and identification of interacting and neighboring proteins without the need for the protein complex to remain intact. To date, only a few studies have reported on the use of proximity labeling in plants. Here, we present the results of a systematic study applying a variety of biotin-based proximity labeling approaches in several plant systems using various conditions and bait proteins. We show that TurboID is the most promiscuous variant in several plant model systems and establish protocols that combine mass spectrometry-based analysis with harsh extraction and washing conditions. We demonstrate the applicability of TurboID in capturing membrane-associated protein interactomes using Lotus japonicus symbiotically active receptor kinases as a test case. We further benchmark the efficiency of various promiscuous biotin ligases in comparison with one-step affinity purification approaches. We identified both known and novel interactors of the endocytic TPLATE complex. We furthermore present a straightforward strategy to identify both nonbiotinylated and biotinylated peptides in a single experimental setup. Finally, we provide initial evidence that our approach has the potential to suggest structural information of protein complexes.


Figures

Figure 1.
Figure 1.
Characterization of Enzyme-Catalyzed Proximity Labeling in Hairy Root Cultures. (A) Experimental setup. (B) Comparison of biotinylation activity in four PBL hairy root cultures from wild-type tomato expressing eGFP-BioID-Flag (∼64 kD), eGFP-BioID2-Flag (∼56 kD), eGFP-Turbo-Flag (∼64 kD), and eGFP-miniTurbo-Flag (∼57 kD). Addition of 50 μM exogenous biotin to 2-week-old hairy root cultures for 2 or 24 h was used for labeling. Arrowheads indicate the expected size of the cis-biotinylation signal. Gray regions in intense black areas represent saturation of the streptavidin-s680 signal and is most prominent in case of self-biotinylation activity. This is a representative experiment repeated twice, and two independent root cultures were analyzed per combination.
Figure 2.
Figure 2.
NFR5-TurboID Shows Strong Biotinylation of Its Known Interactor SymRK-GFP. Pairwise combination of NFR5-TurboID (120 kD) with either SYMRK-GFP (150 kD) or BRI1-GFP (157 kD) using transient expression in N. benthamiana leaves allowed time-dependent and prevalent biotinylation of SYMRK. Biotin at 50 µM was applied for 15 or 30 min. IB, immunoblot; IP, immunoprecipitation.
Figure 3.
Figure 3.
Schematic Overview of the Subsequent Experimental Procedures Followed. (A) Initial experimental setup to compare enriched TPC subunits in biotin-treated transformed Arabidopsis cell cultures at different temperatures. Cell cultures (TPLATE/GFP-BioID) were incubated with 50 µM biotin at 25 to 35°C for 24 h before harvesting. Proteins were extracted using a standard protein extraction buffer (see Methods). This protocol was used to obtain the results in Figure 4. (B) Experimental setup to compare the efficiency of different PBLs with or without long linker sequence. Cell cultures (TPLATE/GFP-linkerBioID, -linkerBioID2, and -linkerTurboID) were incubated with 50 µM or 2 mM biotin at 28°C for 24 h before harvesting. Protein extraction was performed under harsh conditions to exclude false positives (see Methods). This protocol was used to obtain the results in Figures 5 and 6A. (C) Schematic overview of the optimized and final experimental setup to detect both biotinylated and nonbiotinylated peptides from Arabidopsis cell cultures (TPLATE/GFP-linkerTurboID). Following harsh extraction and on-bead digestion, nonbiotinylated and biotinylated peptides were separately (sequentially) eluted and analyzed. All identified peptides were used for MS analysis. This protocol was used to obtain the results in Figures 6B and 8.
Figure 4.
Figure 4.
Detection of TPC Subunits with TPLATE-BioID Is Optimal at 28°C. Comparison of the enrichment of the TPC subunits in the TPLATE-BioID samples at different temperatures compared with their respective GFP-BioID controls is shown. Difference (bar charts) and −log(p-values) (dots) are derived from t tests in Perseus software, using the average LFQ intensities of three technical replicates of TPLATE-BioID versus three technical replicates of GFP-BioID at similar temperature. All TPC subunits are detected at all four temperatures without major differences and all are significantly enriched with TPLATE-BioID (denoted by stars), as determined by permutation-based FDR, with cutoffs FDR = 0.05 and S0 = 0.5. The full list of significantly enriched identifications with TPLATE-BioID at all tested temperatures can be found in Supplemental Data Set 1.
Figure 5.
Figure 5.
Different TPLATE-PBLs Affect Biotinylation of TPC Subunits Differently. Comparison of the enrichment of the TPC subunits with different TPLATE-PBLs versus their respective GFP-PBLs at 28°C is shown. Difference (bar charts) and −log(p-value) (dots) are derived from t tests in Perseus software, using LFQ intensities of three technical replicates of the test compared with three replicates of the respective control. The stars below the graph denote that proteins were found to be significantly different from the control by permutation based-FDR, with cutoffs FDR = 0.05 and S0 = 0.5. The full list of significantly enriched identifications with different TPLATE PBLs at 28°C can be found in Supplemental Data Set 2.
Figure 6.
Figure 6.
Comparing the Identification of a Subset of Proteins Copurified with TPLATE Using GSrhino Pull-Down (PDS), LinkerBioID, LinkerBioID2, or LinkerTurboID. (A) Pull-down and proximity biotinylation comparison of a selection of TPLATE interactors. Experiments were performed in triplicate, using TPLATE as bait and using the protocol in Figure 3B. Per set of experiments, MaxQuant iBAQ values, which are the summed intensity values divided by the number of theoretical peptides, were calculated and normalized versus the bait in order to compare the relative abundance of the proteins between the four different approaches. Proteins that were identified significantly (S) in either method are represented with a colored shape. Proteins that were identified below the significance threshold (NS) for a given method are indicated with gray shapes. (B) Overview of a subset of the identified interactors, color-coded according to their statistical significance in the different experiments (S = significant and NS = not significant) by combining MS data from both elution fractions using the protocol in Figure 3C. Arabidopsis cell cultures expressing TPLATE-linkerTurboID were grown at 25°C and supplemented with exogenous biotin for 10 min, 6 h, or 24 h. Results were compared with the experiment from (A), where the culture was grown at 28°C in the presence of biotin for 24 h. The complete list of significantly enriched identifications of the experiments shown in (A) and (B), including their normalized average iBAQ values, can be found in Supplemental Data Sets 3 and 4.
Figure 7.
Figure 7.
TOL6, TOL9, and SCAMP5 Can Be Confirmed as Novel TPC Interactors. (A) and (B) Representative spinning-disk dual-color images and corresponding quantification of colocalization (%) between TPLATE and TOL6. TPLATE-TagRFP endocytic foci at the plasma membrane were compared with TOL6-Venus foci (A) as well as horizontally flipped TOL6-Venus (TOL6_F) channel images as a control (B). Eight movies from three individual plants, and in total 2607 foci, were analyzed. (C) to (G) Ratiometric BiFC analysis confirming the interaction of TOL9 ([C] and [D]) and SCAMP5 ([E] and [F]) with TPLATE. BIN2 (G) was used as a control. CC and CN refer to the orientation of the nYFP and cYFP: N-terminal cYFP is annotated as CN and C-terminal cYFP is annotated as CC. (H) Box plot and Jitter box representation of the quantification of the YFP/RFP fluorescence ratios (n ≥ 15). The black lines represent the median and the red circles represent the mean. Letters above the plots indicate statistical significance using a Welch-corrected ANOVA to account for heteroscedasticity. Bars = 5 µm ([A] and [B]) or 20 µm ([C] to [G]).
Figure 8.
Figure 8.
Mapping of Biotinylated Versus Nonbiotinylated Peptides Reveals Differential Proximity/Accessibility of Specific TPC Subunit Domains. Schematic representation of seven TPC subunits and their domains is shown. Identified peptides, color-coded according to their abundance (in gray for nonbiotinylated peptides and from yellow to red for biotinylated peptides), are mapped onto them. The full list of biotinylated and nonbiotinylated peptides identified for TPC subunits in the TPLATE-linkerTurboID culture is shown in Supplemental Data Set 5.
None

References

    1. Alban C., Job D., Douce R.(2000). Biotin metabolism in plants. Annu. Rev. Plant Physiol. Plant Mol. Biol. 51: 17–47. - PubMed
    1. Antolín-Llovera M., Ried M.K., Parniske M.(2014). Cleavage of the SYMBIOSIS RECEPTOR-LIKE KINASE ectodomain promotes complex formation with Nod factor receptor 5. Curr. Biol. 24: 422–427. - PubMed
    1. Ashby A.M., Watson M.D., Loake G.J., Shaw C.H.(1988). Ti plasmid-specified chemotaxis of Agrobacterium tumefaciens C58C1 toward vir-inducing phenolic compounds and soluble factors from monocotyledonous and dicotyledonous plants. J. Bacteriol. 170: 4181–4187. - PMC - PubMed
    1. Batsios P., Meyer I., Gräf R.(2016). Proximity-dependent biotin identification (BioID) in Dictyostelium amoebae. Methods Enzymol. 569: 23–42. - PubMed
    1. Beckett D., Kovaleva E., Schatz P.J.(1999). A minimal peptide substrate in biotin holoenzyme synthetase-catalyzed biotinylation. Protein Sci. 8: 921–929. - PMC - PubMed

Publication types

MeSH terms