. 2020 Oct 23;295(43):14763-14779.
doi: 10.1074/jbc.RA120.015219. Epub 2020 Aug 25.

A post-invasion role for Chlamydia type III effector TarP in modulating the dynamics and organization of host cell focal adhesions

Affiliations

A post-invasion role for Chlamydia type III effector TarP in modulating the dynamics and organization of host cell focal adhesions

António T Pedrosa et al. J Biol Chem. .

Abstract

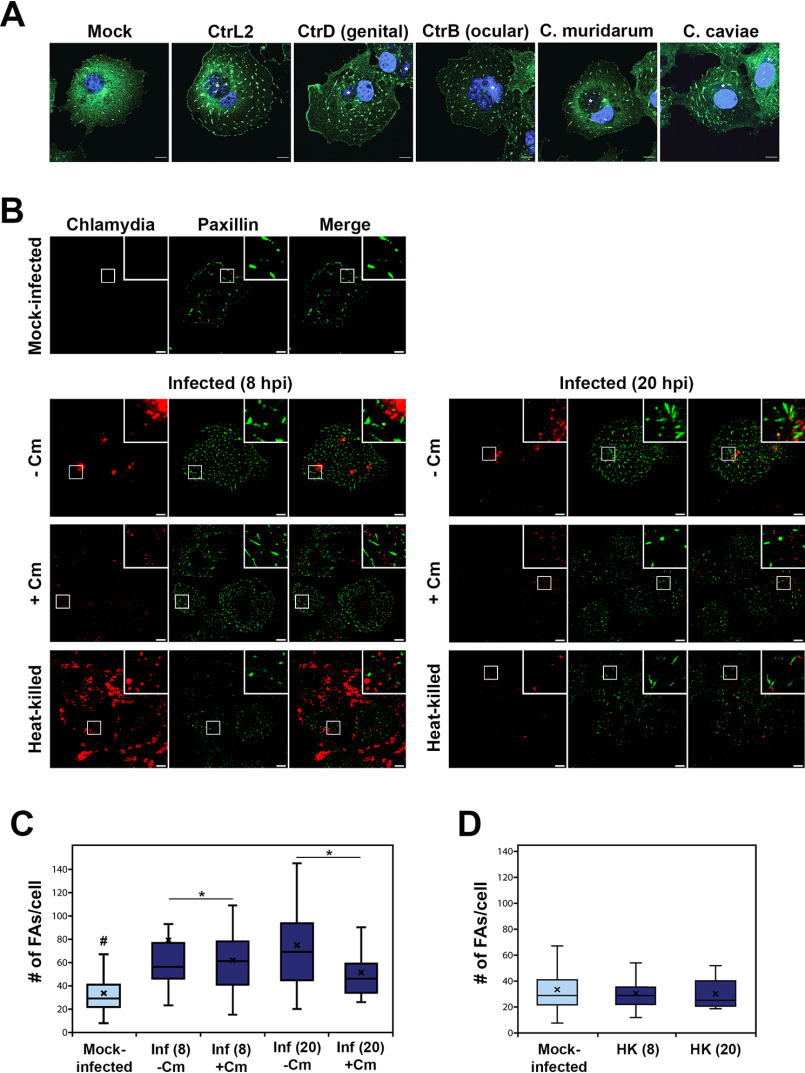
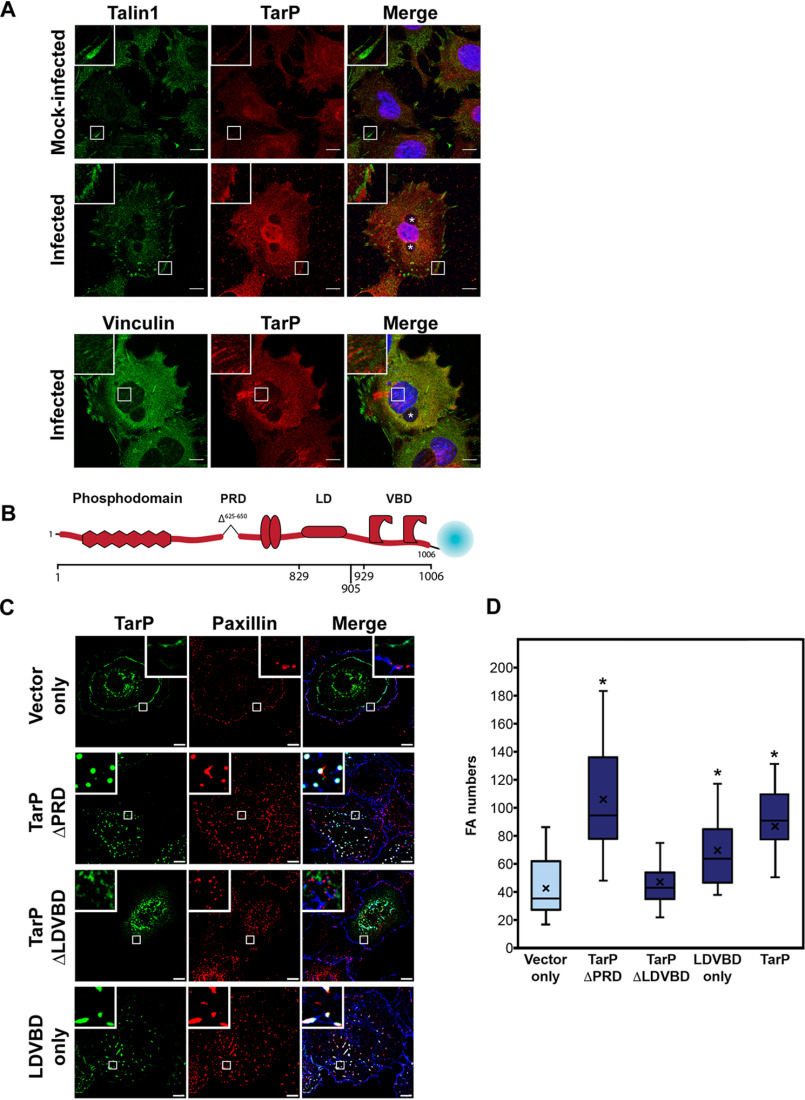
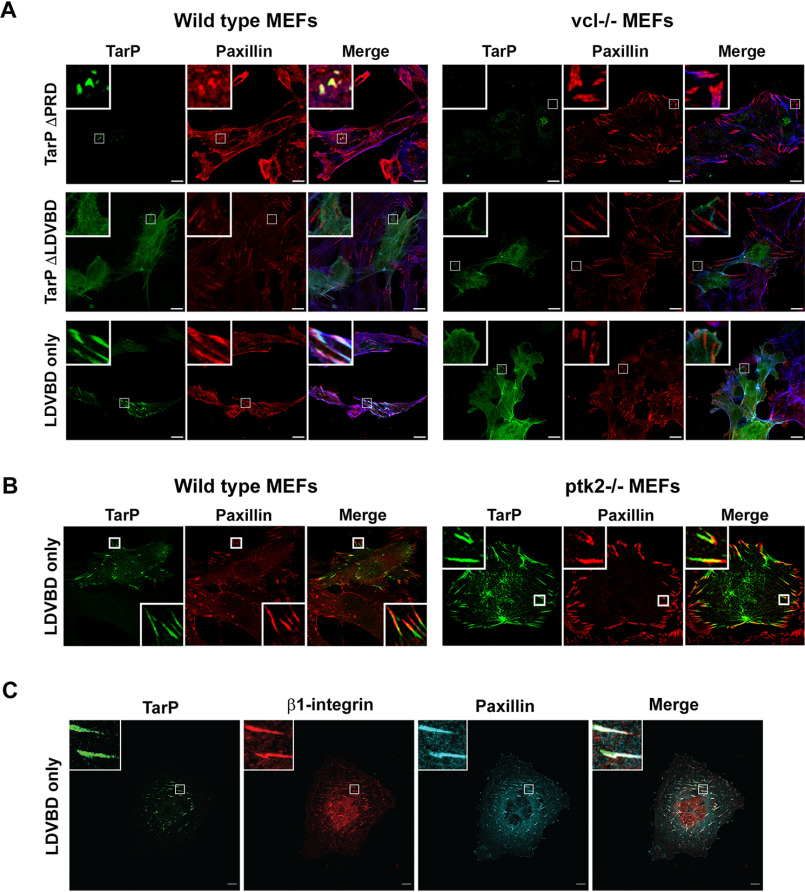
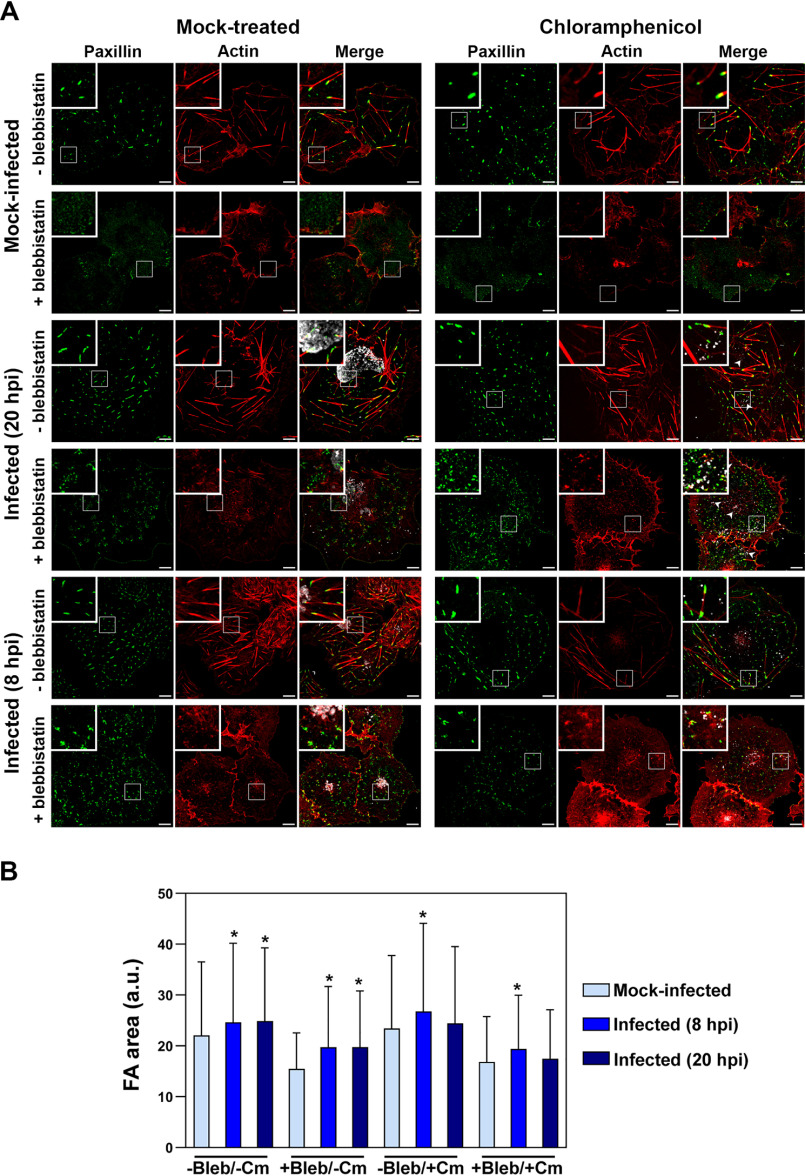
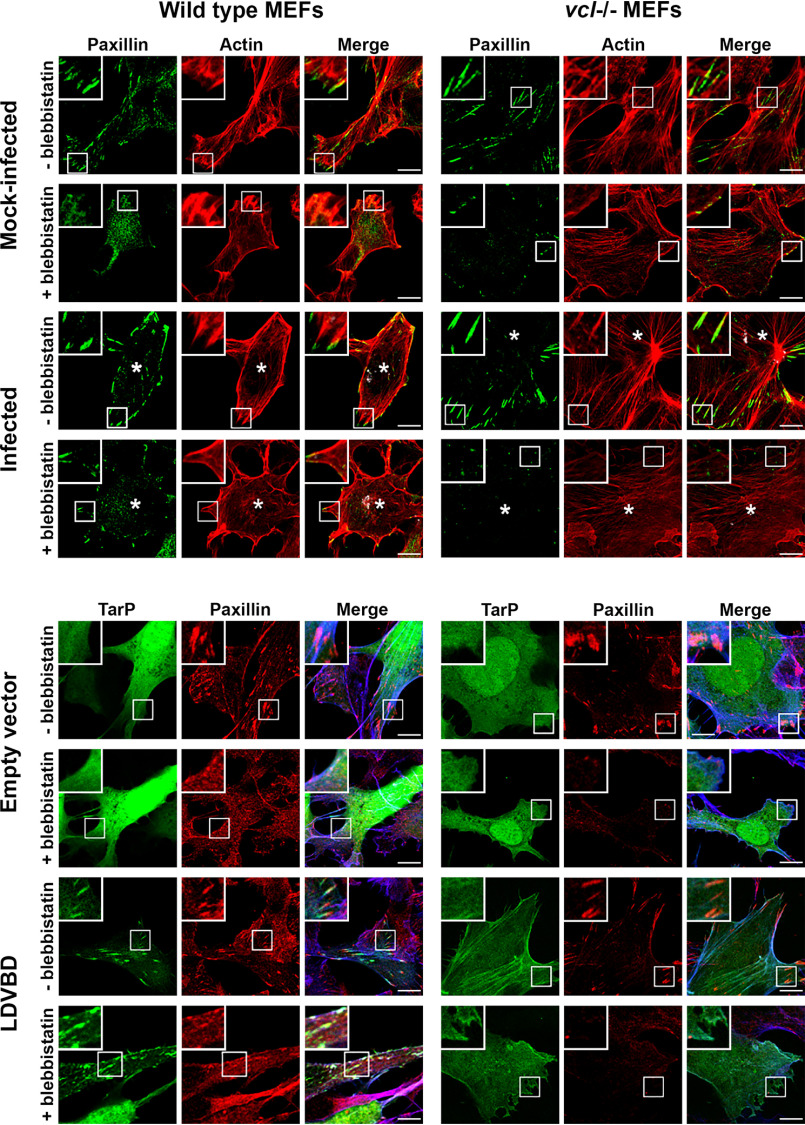
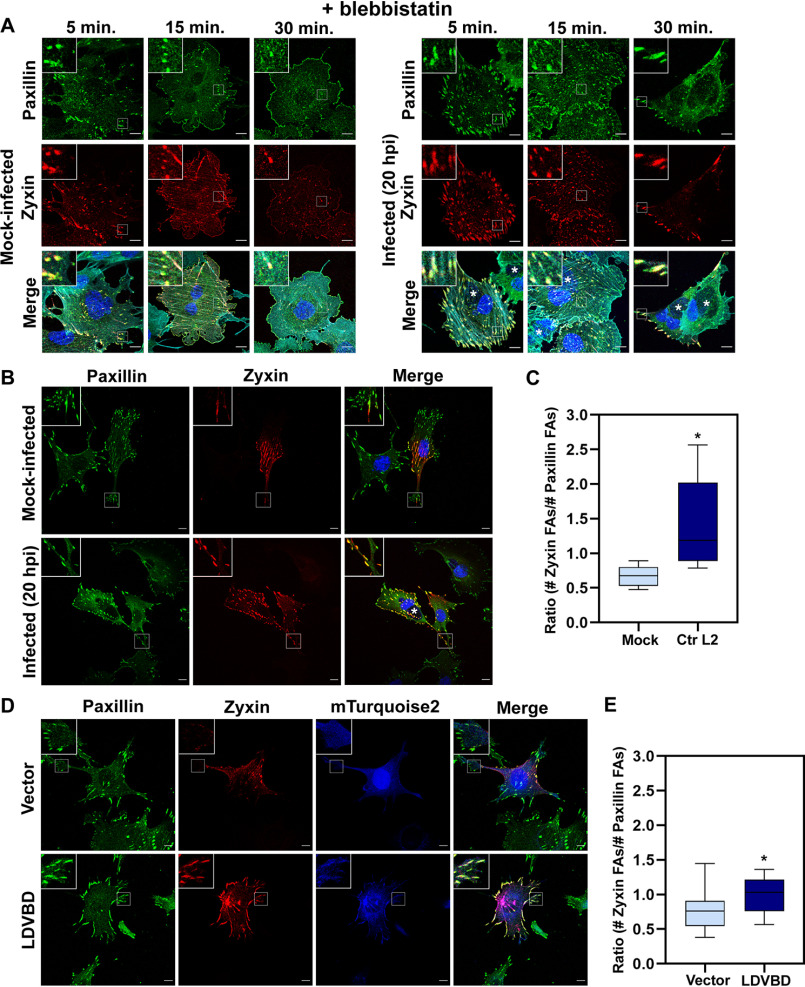
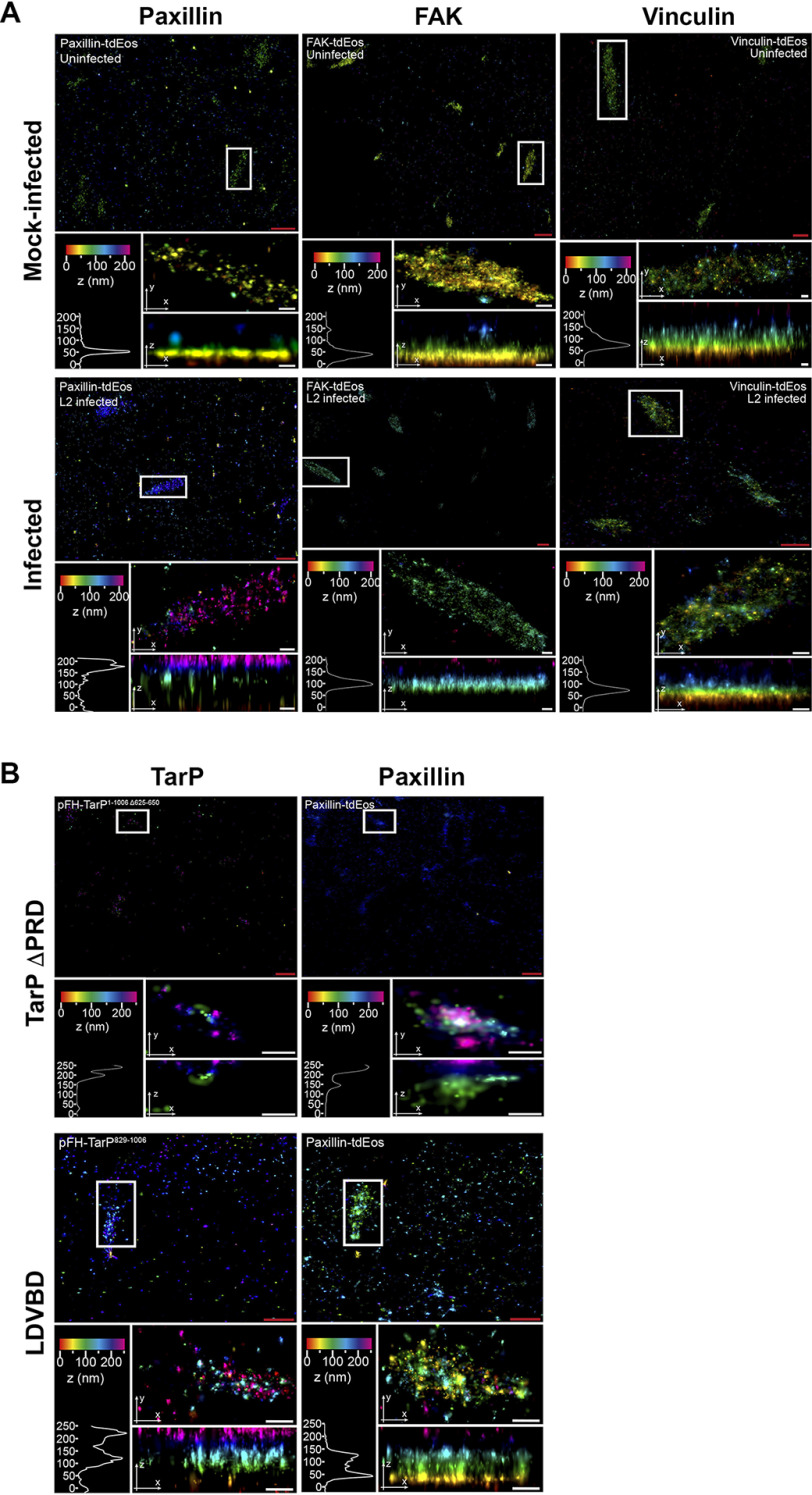
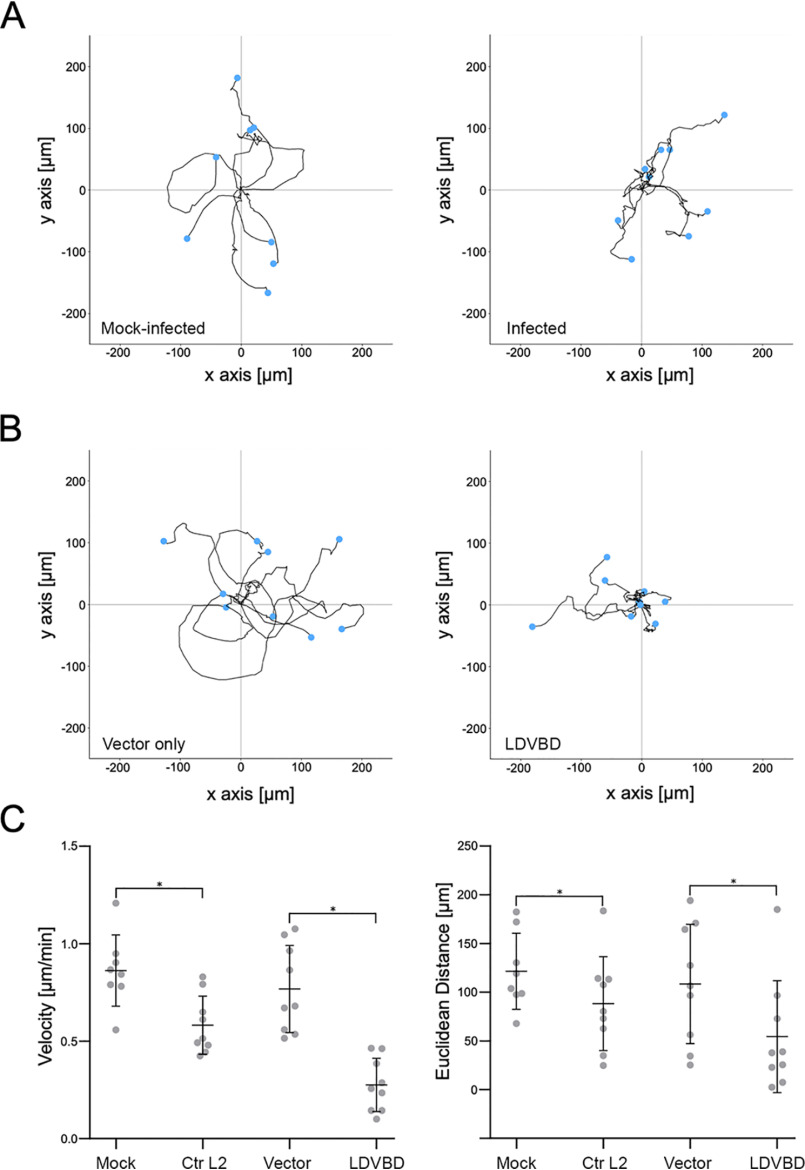
The human pathogen Chlamydia trachomatis targets epithelial cells lining the genital mucosa. We observed that infection of various cell types, including fibroblasts and epithelial cells resulted in the formation of unusually stable and mature focal adhesions that resisted disassembly induced by the myosin II inhibitor, blebbistatin. Superresolution microscopy revealed in infected cells the vertical displacement of paxillin and focal adhesion kinase from the signaling layer of focal adhesions, whereas vinculin remained in its normal position within the force transduction layer. The candidate type III effector TarP, which localized to focal adhesions during infection and when expressed ectopically, was sufficient to mimic both the reorganization and blebbistatin-resistant phenotypes. These effects of TarP, including its localization to focal adhesions, required a post-invasion interaction with the host protein vinculin through a specific domain at the C terminus of TarP. This interaction is repurposed from an actin-recruiting and -remodeling complex to one that mediates nanoarchitectural and dynamic changes of focal adhesions. The consequence of Chlamydia-stabilized focal adhesions was restricted cell motility and enhanced attachment to the extracellular matrix. Thus, via a novel mechanism, Chlamydia inserts TarP within focal adhesions to alter their organization and stability.

Keywords: Chlamydia; Chlamydia trachomatis; bacterial pathogenesis; cell adhesion; cell motility; focal adhesion; focal adhesions; pathogenesis.


Conflict of interest statement

Conflict of interest—The authors declare that they have no conflicts of interest with the contents of this article.

Figures

Figure 1.
Figure 1.
Infection-dependent increase in focal adhesion numbers requires de novo chlamydial protein synthesis. A, COS7 cells infected with the indicated chlamydial strain/species or mock-infected were monitored at 24 hpi, and focal adhesions were visualized by immunostaining for paxillin. The C. trachomatis (Ctr) serovars used are L2 (lymphogranuloma venereum), D (genital), and B (ocular). B, COS7 cells infected with C. trachomatis serovar L2 were mock- or chloramphenicol-treated at the start of infection for either 8 or 20 h. Focal adhesions were visualized by immunostaining for paxillin (green). Scale bar, 10 μm. C, focal adhesions were counted using the particle tracker plug-in in NIH ImageJ. Analysis revealed a slight increase in FA numbers in the 8-h Cm treatment group with marginal statistical significance, whereas the 20-h treatment yielded a statistically significant decrease in FA numbers. #, a difference with statistical significance relative to the other groups. D, increase in focal adhesion numbers per cell requires viable chlamydiae. Data are represented as box-and-whisker plots. Whiskers represent the lowest and highest data point still within 1.5 times the interquartile range. The Wilcoxon rank sum test indicated significance. Black cross, average for each experimental sample; *, p < 0.05.
Figure 2.
Figure 2.
The type III effector TarP localizes to focal adhesions and is sufficient to increase focal adhesion numbers when ectopically expressed. A, CtrL2-infected MEF cells were immunostained for a rabbit polyclonal antibody to TarP and a mouse mAb to either talin or vinculin. Inclusions were visualized by staining with DAPI and are marked with asterisks in the composite image. TarP localized to talin-positive FAs as well as central vinculin-positive FAs in infected, but not in mock-infected controls. Scale bar, 10 μm. B, representation of C. trachomatis effector protein TarP and its known domains fused to mTurquoise2 fluorescent protein. C, COS7 cells expressing different deletion derivatives of TarP or vector only were processed for immunofluorescence with anti-paxillin antibody to visualize focal adhesions. Representative images are shown. Scale bar, 10 μm. D, focal adhesion numbers were counted using the particle-counting plug-in in ImageJ. Data are focal adhesion number per cell and illustrated as a box-whisker plot. Whiskers represent the lowest and highest data point still within 1.5 times the interquartile range. For statistical analyses, the Wilcoxon rank sum test was used to determine significance when compared with vector-only control (*, p < 0.05).
Figure 3.
Figure 3.
The focal adhesion localization of TarP requires its LDVBD domain and the host protein vinculin, but not FAK. A, WT or vinculin-knockout MEFs were transfected with different mTurquoise2-tagged TarP constructs (green) and imaged by confocal microscopy to evaluate colocalization with paxillin (red) at focal adhesions. Phalloidin was used to stain F-actin (blue). Cells were transfected for 20 h, at which time the cells were fixed and processed for immunofluorescence staining for paxillin. B, in a parallel experiment, WT and FAK-deficient MEFs were transfected to express FLAG-HA-LDVBD and stained for FLAG (green). Colocalization with paxillin (red) was assessed by confocal microscopy. C, ectopically expressed LDVBD localizes to β1-integrin and paxillin-positive focal adhesions. Scale bar, 10 μm.
Figure 4.
Figure 4.
Focal adhesions of Chlamydia-infected cells are resistant to blebbistatin. A, COS7 cells were mock-infected or infected with CtrL2 for 20 or 8 h. Cells were fixed and stained for the focal adhesion marker paxillin (green), F-actin (red), and human convalescent serum for C. trachomatis (white). Cells were also mock-treated or pretreated with Cm followed by infection of live EBs to assess the effects of presynthesized EB-associated effectors. Cm treatment was maintained for the duration of the experiment to prevent de novo protein synthesis. Blebbistatin (10 μm) was introduced during the last hour of infection. Cells without blebbistatin treatment showed clear F-actin stress fibers and paxillin-labeled focal adhesions. Whereas both structures were lost in mock-infected cells, infected cells retained the focal adhesions. Scale bar, 10 μm. B, images were run through the Focal Adhesion Analysis Server to obtain area values. For each treatment, >850 FAs were analyzed. The bar graph represents means with S.D. Statistical significance was assessed using a Kruskal–Wallis test followed by a post hoc Dunn's test. *, significance (p < 0.01) relative to the mock-infected sample for each treatment.
Figure 5.
Figure 5.
The LDVBD domain of TarP and the host protein vinculin are required for focal adhesion resistance to blebbistatin treatment. Top, WT or vinculin-knockout MEFs were infected with C. trachomatis serovar L2. Cells at 20 hpi were mock-treated or treated for 60 min with 10 μm blebbistatin. The cells were then processed for immunofluorescence staining for paxillin (green) and actin (red). Retention or loss of focal adhesions was monitored. Focal adhesions were only resistant to blebbistatin-induced disassembly if the cell was infected and expressing vinculin. Bottom, in a parallel experiment, WT or vinculin-knockout MEFs were transfected for 20 h with the empty vector or LDVBD-mTurquoise2 fusion protein. During the last hour, cells were either mock- or blebbistatin-treated. Cells were processed to visualize paxillin (red), LDVBD (green), and actin (blue; shown in composite images). LDVBD was sufficient to confer resistance to blebbistatin-induced disassembly to focal adhesions. Resistance also required vinculin. Scale bar, 10 μm.
Figure 6.
Figure 6.
An increased number of FAs contain the maturation marker zyxin in Chlamydia-infected and LDVBD-expressing cells. A, MEF cells were transfected with RFP-zyxin via electroporation and then mock-infected or infected with CtrL2 for 20 h. Cells were treated with 10 μm blebbistatin and fixed at the indicated time points and then stained for the focal adhesion marker paxillin (green) as well as actin (cyan; shown in composite images). Chlamydia-containing inclusions were visualized by staining with DAPI and are marked with asterisks in composite images. B, CtrL2-infected MEF cells expressing RFP-zyxin were processed for immunofluorescence with anti-paxillin antibody to visualize focal adhesions. Inclusions were visualized by staining with DAPI. Representative images are shown. Scale bar, 10 μm. C, the paxillin and zyxin channels were submitted to the Focal Adhesion Analysis Server to obtain a mask of each channel. The focal adhesion number was then counted using the particle-counting plug-in from ImageJ. Data are the number of zyxin adhesions present divided by the number of paxillin adhesions present per individual cell and illustrated as a box-whisker plot. Whiskers represent the lowest and highest data point still within 1.5 times the interquartile range. For statistical analyses, ANOVA was used to determine significance when compared with a mock control (*, p < 0.001) (n = 10 cells). D, MEF cells expressing RFP-zyxin as well as vector only or LDVBD-mTurquoise2 were processed for immunofluorescence with anti-paxillin antibody. Representative images are shown. E, quantification performed as described in C. For statistical analyses, ANOVA was used to determine significance when compared with vector-only control (*, p < 0.05) (n = 10 cells).
Figure 7.
Figure 7.
TarP-targeted focal adhesions display altered nanoscale architecture. A, COS7 cells were pretransfected with paxillin-tdEos, FAK-TdEos, or vinculin-TdEos on gold fiducial coverslips and were mock-infected or C. trachomatis–infected for 20 h. The cells were fixed and processed for iPALM imaging. Representative images are shown from n = 3. For each sample, multiple panels are provided. The top panel shows the top view of the area around the focal adhesion of interest (white border). The middle panel displays a top view of the focal adhesion indicated by the white border. The bottom panel shows the side view and corresponding z histograms. Note the significant shifts in paxillin and FAK localization, but not vinculin. B, COS7 cells were co-transfected with paxillin-tdEos and either TarP ΔPRD or LDVBD only by electroporation. The cells were seeded on gold fiducial coverslips and processed for iPALM at 24 h post-transfection at n = 2. Description of each panel is as above in A. Note the significant shift in the location of paxillin within the TarP-positive focal adhesions. The various colors indicate the distance (z-coordinates) from the gold fiducial marker (e.g. z = 0 nm; red). Red scale bar, 1 μm. White scale bar, 200 nm.
Figure 8.
Figure 8.
The LDVBD domain of TarP is sufficient to inhibit cell migration. MEFs that were mock-infected, Chlamydia-infected, vector-only–transfected, or LDVBD-transfected were seeded within ibidi µ-slide live-cell imaging chambers. Time-lapse imaging was performed every 10 min for 10 h to evaluate cell motility. A, for analysis of the infection experiments, a 5-h imaging window common to both mock- and Chlamydia-infected samples was chosen that maximized the number of cells that remained within the field of view. Cells were tracked using the manual tracking function in ImageJ, and the cell trajectory was traced and plotted with the starting points assigned to the origin. B, analysis of the transfection experiment was in a common 10-h imaging window. Data were acquired and plotted as in A. C, velocity and Euclidean distance traveled were calculated for each cell from each experimental group. Values were plotted as dot plots with mean ± S.D. indicated by the bars. Statistical significance was calculated using ANOVA. *, p < 0.01.

References

    1. Kim M., Ogawa M., Mimuro H., and Sasakawa C. (2010) Reinforcement of epithelial cell adhesion to basement membrane by a bacterial pathogen as a new infectious stratagem. Virulence 1, 52–55 10.4161/viru.1.1.10486 - DOI - PMC - PubMed
    1. Borradori L., and Sonnenberg A. (1999) Structure and function of hemidesmosomes: more than simple adhesion complexes. J. Invest. Dermatol. 112, 411–418 10.1046/j.1523-1747.1999.00546.x - DOI - PubMed
    1. Geiger B., Bershadsky A., Pankov R., and Yamada K. M. (2001) Transmembrane crosstalk between the extracellular matrix and the cytoskeleton. Nat. Rev. Mol. Cell Biol. 2, 793–805 10.1038/35099066 - DOI - PubMed
    1. Rosenblatt J., Raff M. C., and Cramer L. P. (2001) An epithelial cell destined for apoptosis signals its neighbors to extrude it by an actin- and myosin-dependent mechanism. Curr. Biol. 11, 1847–1857 10.1016/S0960-9822(01)00587-5 - DOI - PubMed
    1. Zaidel-Bar R., Itzkovitz S., Ma'ayan A., Iyengar R., and Geiger B. (2007) Functional atlas of the integrin adhesome. Nat. Cell Biol. 9, 858–867 10.1038/ncb0807-858 - DOI - PMC - PubMed

Publication types