

Assessing performance of pathogenicity predictors using clinically relevant variant datasets
- PMID: 32843488
- PMCID: PMC8327323
- DOI: 10.1136/jmedgenet-2020-107003
Assessing performance of pathogenicity predictors using clinically relevant variant datasets
Abstract
Background: Pathogenicity predictors are integral to genomic variant interpretation but, despite their widespread usage, an independent validation of performance using a clinically relevant dataset has not been undertaken.
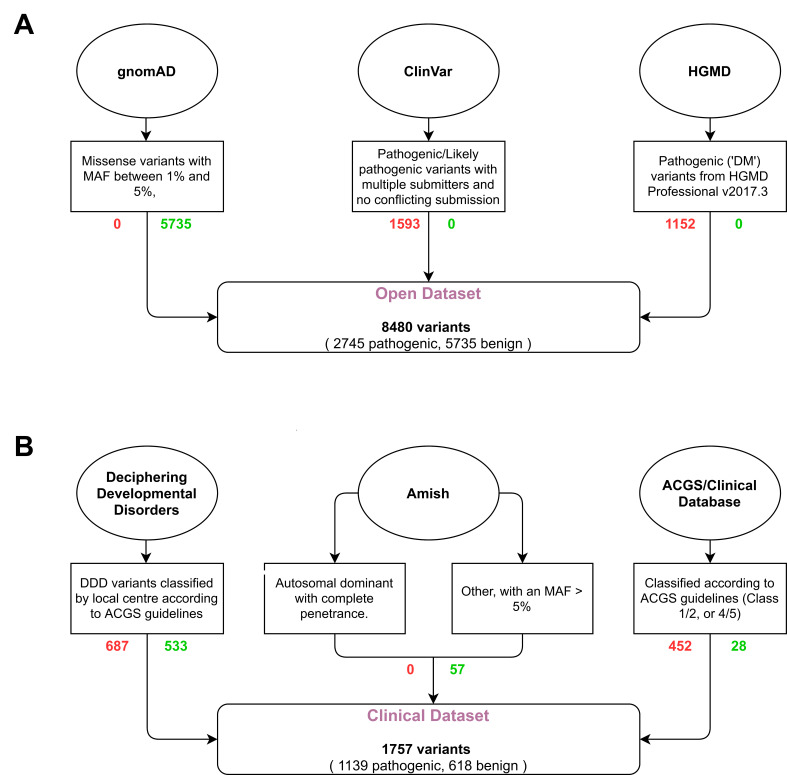
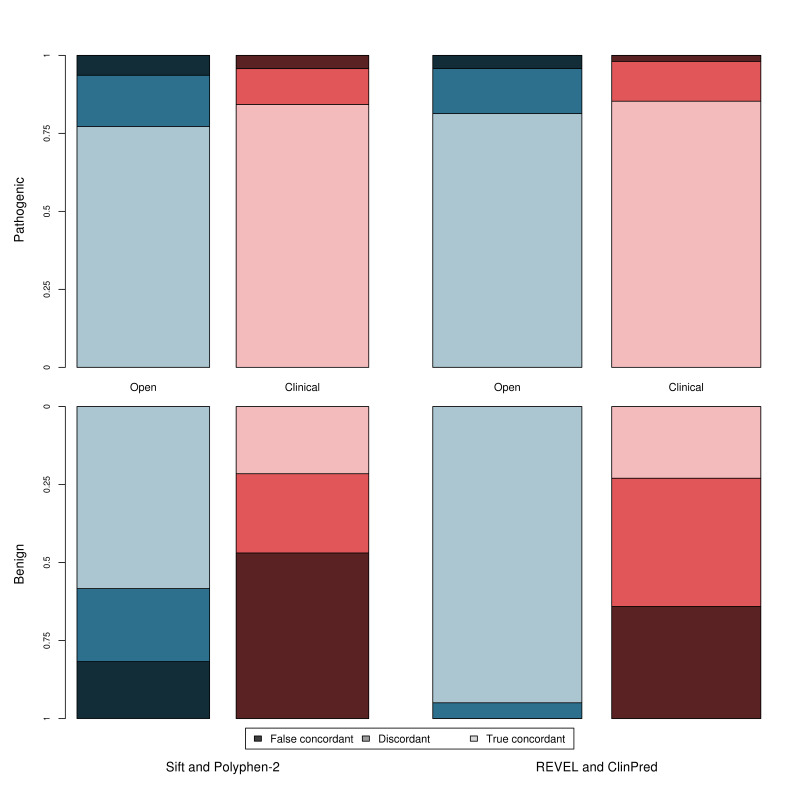
Methods: We derive two validation datasets: an 'open' dataset containing variants extracted from publicly available databases, similar to those commonly applied in previous benchmarking exercises, and a 'clinically representative' dataset containing variants identified through research/diagnostic exome and panel sequencing. Using these datasets, we evaluate the performance of three recent meta-predictors, REVEL, GAVIN and ClinPred, and compare their performance against two commonly used in silico tools, SIFT and PolyPhen-2.
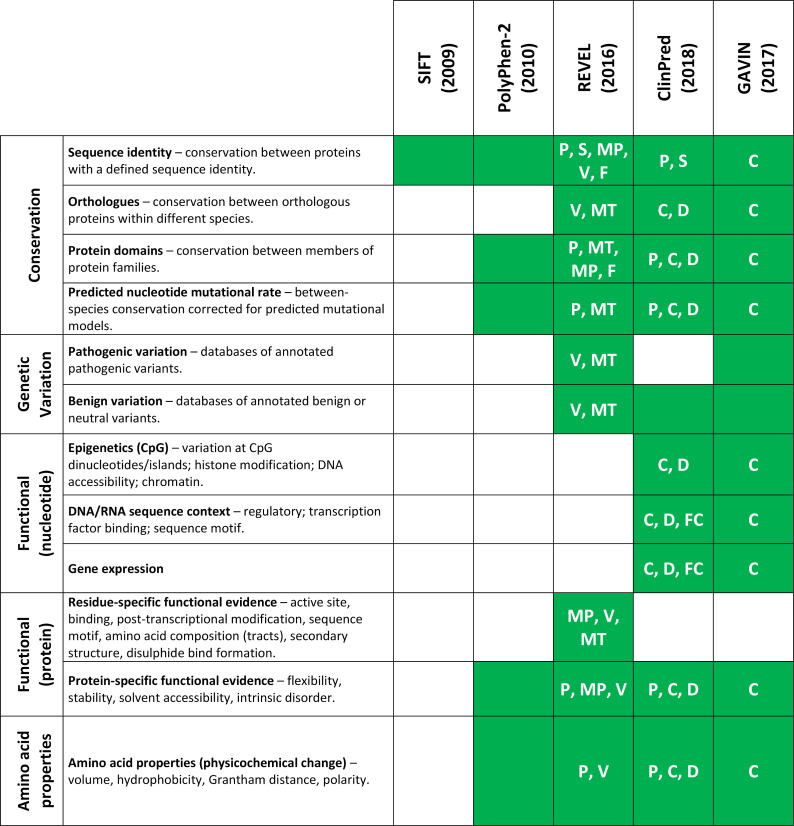
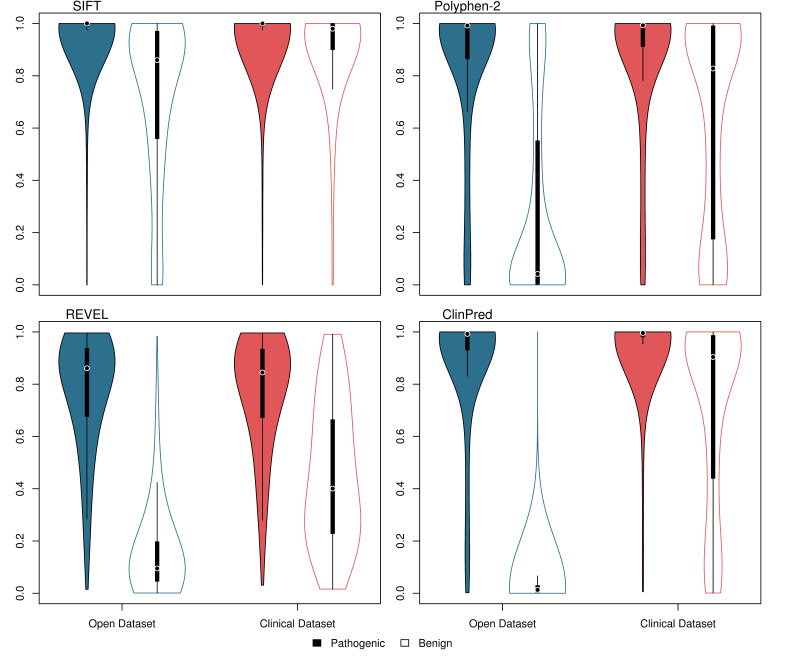
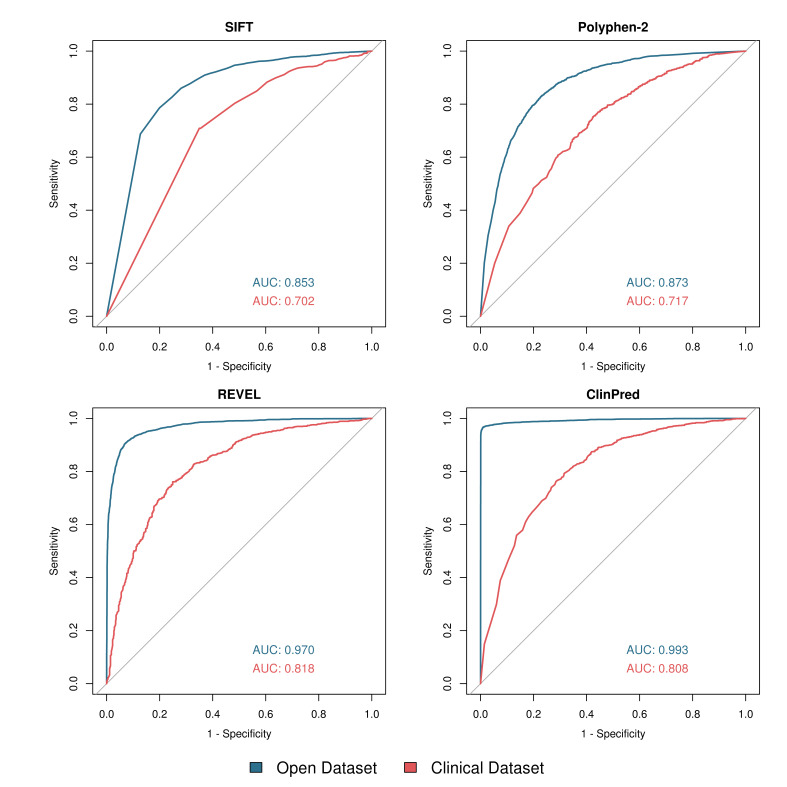
Results: Although the newer meta-predictors outperform the older tools, the performance of all pathogenicity predictors is substantially lower in the clinically representative dataset. Using our clinically relevant dataset, REVEL performed best with an area under the receiver operating characteristic curve of 0.82. Using a concordance-based approach based on a consensus of multiple tools reduces the performance due to both discordance between tools and false concordance where tools make common misclassification. Analysis of tool feature usage may give an insight into the tool performance and misclassification.
Conclusion: Our results support the adoption of meta-predictors over traditional in silico tools, but do not support a consensus-based approach as in current practice.
Keywords: genetic testing; genetic variation; genetics; genomics; human genetics.
© Author(s) (or their employer(s)) 2021. Re-use permitted under CC BY. Published by BMJ.
Conflict of interest statement
Competing interests: None declared.
Figures
References
-
- Richards S, Aziz N, Bale S, Bick D, Das S, Gastier-Foster J, Grody WW, Hegde M, Lyon E, Spector E, Voelkerding K, Rehm HL, ACMG Laboratory Quality Assurance Committee . Standards and guidelines for the interpretation of sequence variants: a joint consensus recommendation of the American College of Medical Genetics and Genomics and the Association for Molecular Pathology. Genet Med 2015;17:405–23. 10.1038/gim.2015.30 - DOI - PMC - PubMed
-
- Ellard S, Baple E, Berry I, Forrester N, Turnbull C, Owens M. ACGS best practice guidelines for variant classification; 2019. https://www.acgs.uk.com/news/acgs-best-practice-guidelines-for-variant-c...
Publication types
MeSH terms
Grants and funding
LinkOut - more resources
Full Text Sources