Comparative Study
. 2020 Aug 25;11(1):4248.
doi: 10.1038/s41467-020-18065-9.

Confinement in crystal lattice alters entire photocycle pathway of the Photoactive Yellow Protein

Affiliations
Comparative Study

Confinement in crystal lattice alters entire photocycle pathway of the Photoactive Yellow Protein

Patrick E Konold et al. Nat Commun. .

Abstract

Femtosecond time-resolved crystallography (TRC) on proteins enables resolving the spatial structure of short-lived photocycle intermediates. An open question is whether confinement and lower hydration of the proteins in the crystalline state affect the light-induced structural transformations. Here, we measured the full photocycle dynamics of a signal transduction protein often used as model system in TRC, Photoactive Yellow Protein (PYP), in the crystalline state and compared those to the dynamics in solution, utilizing electronic and vibrational transient absorption measurements from 100 fs over 12 decades in time. We find that the photocycle kinetics and structural dynamics of PYP in the crystalline form deviate from those in solution from the very first steps following photon absorption. This illustrates that ultrafast TRC results cannot be uncritically extrapolated to in vivo function, and that comparative spectroscopic experiments on proteins in crystalline and solution states can help identify structural intermediates under native conditions.


Conflict of interest statement

The authors declare no competing interests.

Figures

Fig. 1
Fig. 1. Transient absorption data in the visible collected over 12 decades in time.
A selection of transient absorption spectra as a function of time delay are shown, upon excitation with a 50-fs laser pulse centered at 475 nm, for a PYPS and b PYPC. The temporal evolution is indicated by the black arrows. In PYPC, a scattered-light artifact is visible at the wavelength of excitation. c Wavelength traces at 404, 444 and 494 nm of PYPS (black) and PYPC (red), see Supplementary Figs. 1 and 2 for traces at additional wavelengths. The data from the current study with sub-picosecond time resolution has been merged with data taken from Yeremenko et al. with microsecond time resolution, with the latest time point at 48 ms (crystal) or 1 s (solution). Wavelength is indicated in the ordinate label. Note that the time axis is linear until 1 ps (after the maximum of the instrument response function (IRF)), and logarithmic thereafter. A single scaling parameter has been used to connect the data from the experiments with sub-picosecond and microsecond time resolution. PYPS was measured at pH 8, PYPC at pH 6.5. PYPS time traces collected at pH 6 are shown in Supplementary Fig. 1 and exhibit corresponding dynamics.
Fig. 2
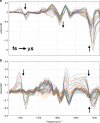
Fig. 2. Transient absorption difference spectra in the midinfrared.
A selection of transient absorption difference spectra in the mid-IR spectral region following excitation with 475 nm light for a PYPS and b PYPC, from 100 fs to 100 ms. Full spectra were recorded for each laser pulse after dispersing the probe light on a 64 element Mercury Cadmium Telluride photodiode array, resulting in a ~4 cm−1 sampling resolution. Approximate temporal evolution from femtoseconds to microseconds is denoted by the black arrows.
Fig. 3
Fig. 3. Transient absorption time traces in the midinfrared.
Time traces at selected wavenumbers of PYPS (black) and PYPC (red). Note that the time axis is linear until 10 ps (after the maximum of the IRF), and logarithmic thereafter. The PYPS data was scaled lower by a factor of 5 to facilitate comparison.
Fig. 4
Fig. 4. Kinetic schemes of the photocycle of PYP in solution and in crystalline form.
Top panel: PYP in solution, bottom panel: PYP in crystalline form. Upon absorption of light by pCa in the ground state (GS), the excited state is formed from which the system transitions through the reaction. The relevant states are indicated by the following abbreviations: ES1-3: excited states sharing the same spectrum, evolving sequentially from 1→2→3; GSI: ground state intermediate; I0, I1, I2 (pB1), I2’(pB2), pR0, pR1, pR2, pBcrystal: photocycle intermediates. Note that we use the symbol “IX” for notation of PYPS intermediate states, and “pC” (with C for color, i.e., red or blue) for those in PYPC, except for the final pB states. The transition rates indicated near the arrows are in ns−1, the lifetime of each state is indicated in italic. The rate constants involving the ES and GSI for PYPS have been fixed from ref. , all other parameters have been estimated. Note that in the crystal as evidenced from the UV–Vis data half of the pR2 states is converted to pB, whereas the other half branches directly to the ground state, with a rate of kR,VIS 2.4 × 10−6. Note that the longer time scales (after 100 ms) are based solely on the the UV–Vis data of ref. . Concentration profiles computed with these kinetic schemes for the photocycle intermediates states are shown in Supplementary Fig. 7.
Fig. 5
Fig. 5. UV–Vis SADS of PYP.
The SADS in solution (a) and crystalline (b) form have been resolved from fitting the target model shown in Fig. 4 to the experimental data, and display the bleached ground state, and stimulated emission, as negative features and induced absorption as positive features. The characteristic blue (≈370 nm) absorption of pCA in the pB states signals protonation of pCa. The region of the ground state bleach in the PYPC dataset appears to be diminished with respect to that in PYPS; this is an effect of the high absorption of the crystals around 444 nm. Note that data from Yeremenko et al. has been added to the analysis to more reliably estimate the dynamics and SADS on the ~10–300 ms timescale and to span the full photocycle dynamics up to 1 s. Source data are provided as a Source Data file.
Fig. 6
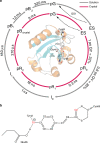
Fig. 6. Photocycle scheme of PYP in solution and in crystalline form and pCa structure.
a Simplified photocycle scheme for PYPC (red arrows) and for PYPS (gray arrows). The full kinetic schemes for PYPS and PYPC are shown in Fig. 4. Upon absorption of light by pG, the excited state is formed (ES), from which pCa trans-to-cis isomerization takes place in 0.6 ps in PYPS and ~1 ps in PYPC, with quantum yields of 30 and 23% respectively. In PYPC, an additional intermediate is formed, pR0, followed by pR1,2 respectively, in comparison to the intermediates (I0,1) in PYPS. b pCa molecular structure in trans-configuration and interactions with neighboring sidechains. Hydrogen bonds are indicated by dashed lines.
Fig. 7
Fig. 7. Species-associated-difference spectra (SADS) in the mid-IR spectral range.
The SADS have been resolved from fitting the target model shown in Fig. 4 to the experimental data, and display the bleached ground state as negative feature and product state absorption as positive feature. a SADS of PYPS, b SADS of PYPC. c An accumulated PYP light-minus-dark difference FTIR spectrum and the SADS of the pB state of PYP in solution (also shown in a). Absorption changes in the 1740–1760 cm−1 region report on the hydrogen bond interaction between Glu46 and the phenol ring of pCa: higher frequency indicates weakened bond, lower frequency a stronger bond; Absorption changes in the 1690–1630 cm−1 region report on carbonyl stretches with a similar effect of a hydrogen bond on its frequency. The 1555 cm−1 band has been assigned to pCa C = C stretch and phenol ring modes,,, see also Supplementary Table 1.
Fig. 8
Fig. 8. Mid-IR SADS of wild type and isotope-labeled PYP at position C9.
WT-PYP (blue) and 13C = O - PYP (red) SADS of the ES, I0, I1, pB1 states are shown in the region between 1780–1250 cm−1. In the region 1540 to 1250 cm−1 the labeled PYP spectrum was scaled by a factor 0.5 for better comparison with the unlabeled spectra, whereas from 1780 to 1540 cm−1 no scaling was performed. The differences induced upon labeling of the carbonyl of pCa of PYP with 13C are highlighted with colored boxes in the graph and systematic losses around 1555 cm−1 bleach is shown by a star (*) symbol.

References

    1. Ihee H, et al. Visualizing reaction pathways in photoactive yellow protein from nanoseconds to seconds. Proc. Natl Acad. Sci. USA. 2005;102:7145–7150. - PMC - PubMed
    1. Schotte F, et al. Watching a signaling protein function in real time via 100-ps time-resolved Laue crystallography. Proc. Natl Acad. Sci. USA. 2012;109:19256–19261. - PMC - PubMed
    1. Jung YO, et al. Volume-conserving trans-cis isomerization pathways in photoactive yellow protein visualized by picosecond X-ray crystallography. Nat. Chem. 2013;5:212–220. - PMC - PubMed
    1. Nogly P, et al. Retinal isomerization in bacteriorhodopsin captured by a femtosecond x-ray laser. Science. 2018;361:eaat0094. - PubMed
    1. Pande K, et al. Femtosecond structural dynamics drives the trans/cis isomerization in photoactive yellow protein. Science. 2016;352:725–729. - PMC - PubMed

Publication types

MeSH terms

Substances