. 2020 Aug 25;6(1):27.
doi: 10.1038/s41540-020-00147-5.

Inferring clonal composition from multiple tumor biopsies

Affiliations

Inferring clonal composition from multiple tumor biopsies

Matteo Manica et al. NPJ Syst Biol Appl. .

Abstract

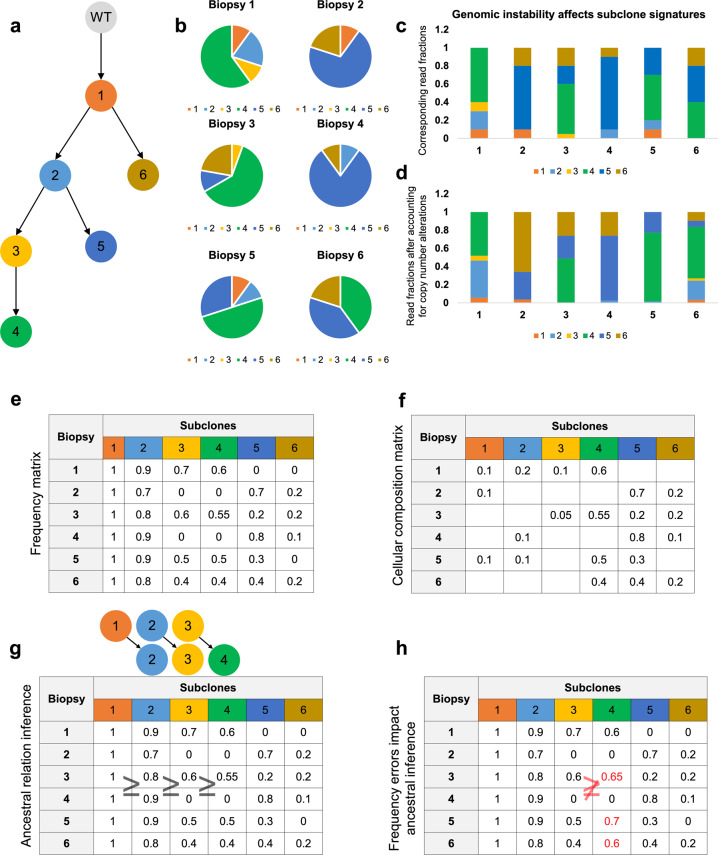
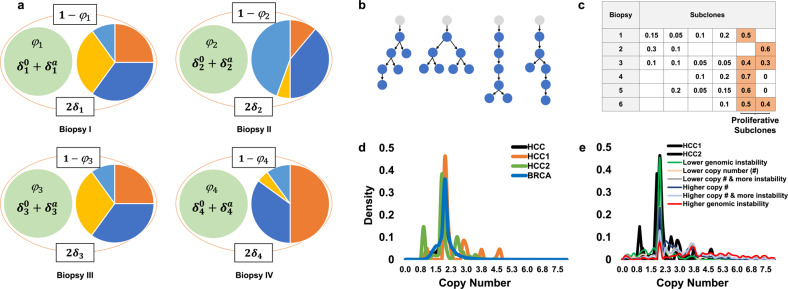
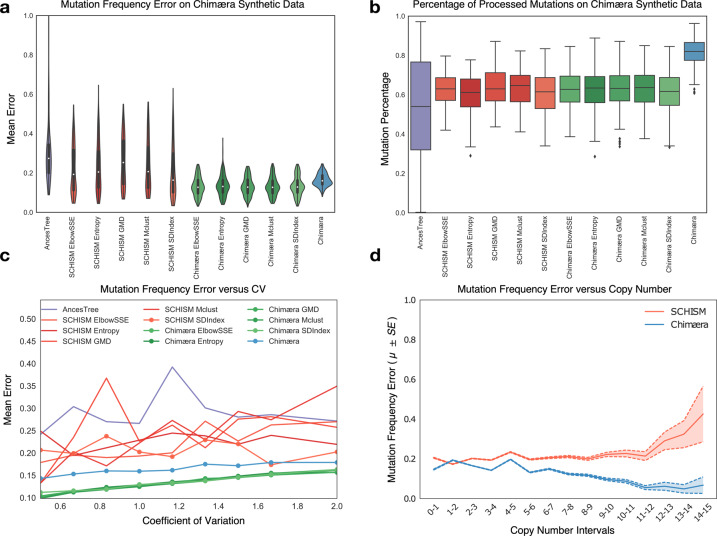
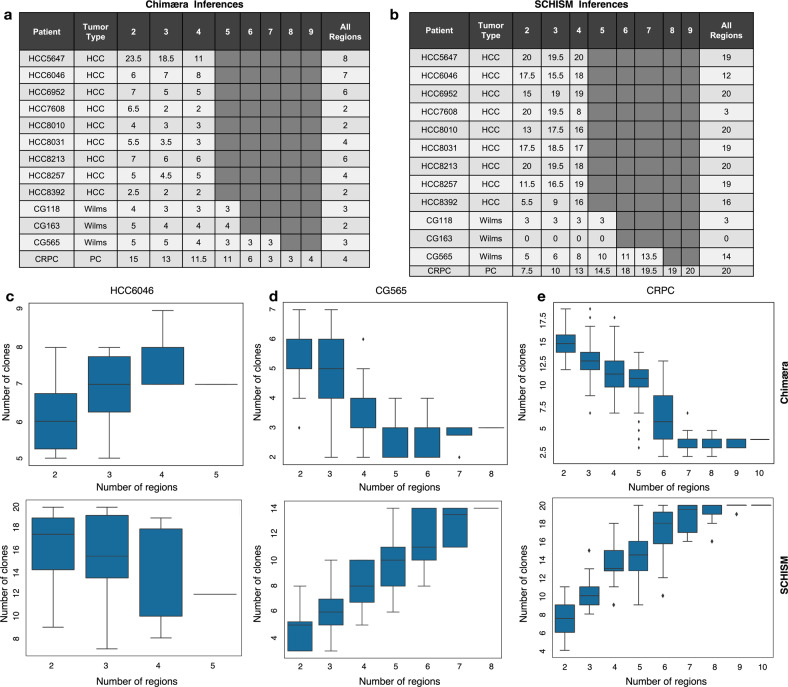
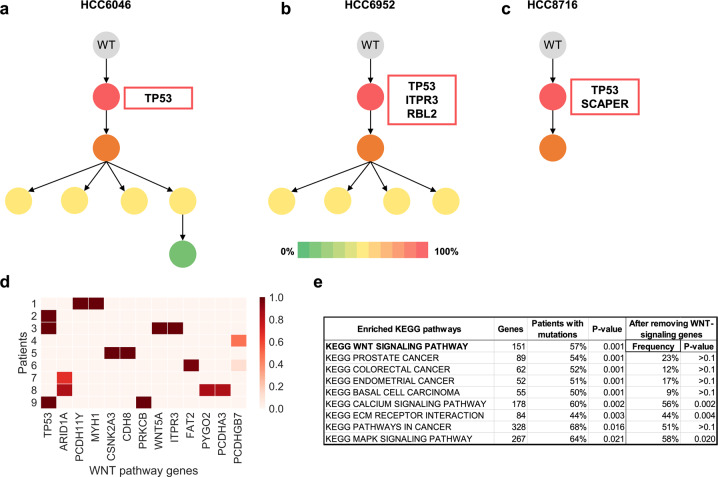
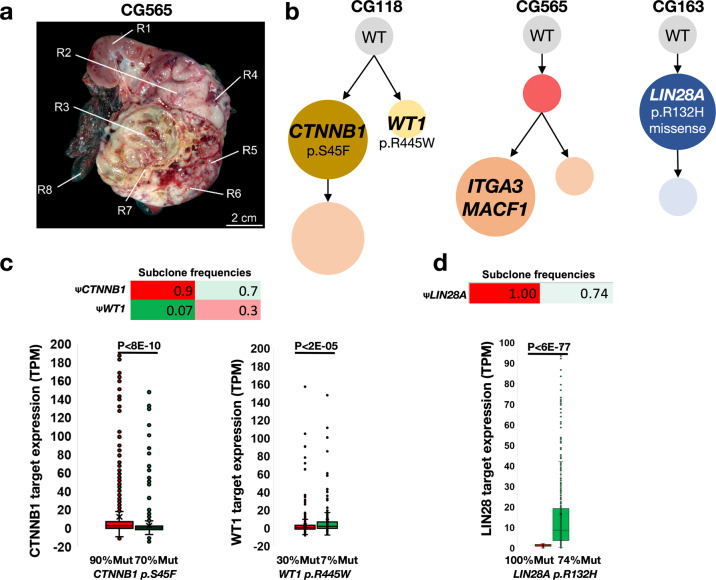
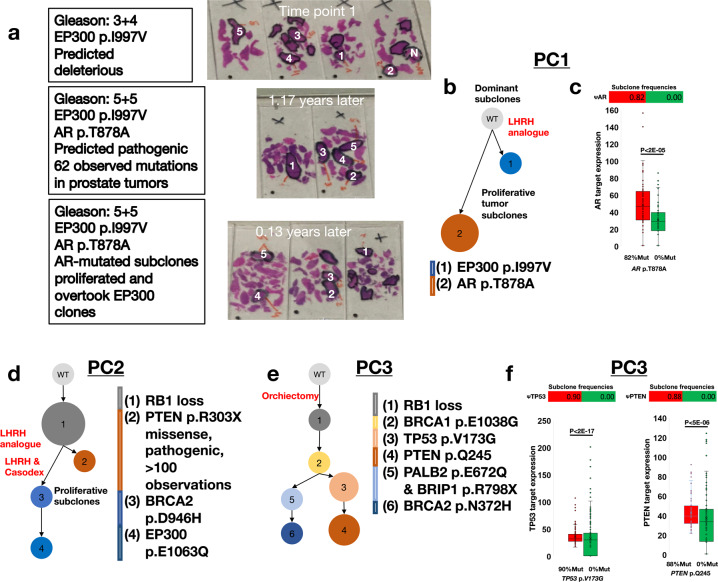
Knowledge about the clonal evolution of a tumor can help to interpret the function of its genetic alterations by identifying initiating events and events that contribute to the selective advantage of proliferative, metastatic, and drug-resistant subclones. Clonal evolution can be reconstructed from estimates of the relative abundance (frequency) of subclone-specific alterations in tumor biopsies, which, in turn, inform on its composition. However, estimating these frequencies is complicated by the high genetic instability that characterizes many cancers. Models for genetic instability suggest that copy number alterations (CNAs) can influence mutation-frequency estimates and thus impede efforts to reconstruct tumor phylogenies. Our analysis suggested that accurate mutation frequency estimates require accounting for CNAs-a challenging endeavour using the genetic profile of a single tumor biopsy. Instead, we propose an optimization algorithm, Chimæra, to account for the effects of CNAs using profiles of multiple biopsies per tumor. Analyses of simulated data and tumor profiles suggested that Chimæra estimates are consistently more accurate than those of previously proposed methods and resulted in improved phylogeny reconstructions and subclone characterizations. Our analyses inferred recurrent initiating mutations in hepatocellular carcinomas, resolved the clonal composition of Wilms' tumors, and characterized the acquisition of mutations in drug-resistant prostate cancers.


Conflict of interest statement

The authors declare no competing interests.

Figures

Fig. 1
Fig. 1. A simulated footprint of the clonal evolution of a tumor, as observed in genetic profiles of multiple biopsies.
a Tumor phylogeny composed of six dominant tumor subclones that make up the b cellular composition of six tumor biopsies. c Read fractions in a DNA profiling assay that are associated with these subclones and d corrected fractions after accounting for CNAs. e Frequencies of the variant allele, for each mutation defining a clone in each biopsy, are higher for ancestral clones. f Variant allele frequencies are linked to the cellular composition of the tumor and depend on its associated phylogeny. g Ancestral relations can be inferred by comparing subclone frequency vectors; e.g., Subclone 3 frequencies are greater or equal to those of Subclone 4 across all biopsies, suggesting that Subclone 3 may be ancestral to Subclone 4. h However, errors in frequency estimates (red) can complicate efforts to infer ancestry and tumor-phylogeny reconstruction.
Fig. 2
Fig. 2. Our model for the effects of copy number alterations on mutated-read fractions in DNA profiles.
a For each mutation in each biopsy s, the mutated-read fraction is a function of the true proportion of profiled cells with the mutation (mutation frequency) φs, the copy number of the reference allele in cells without the mutation δs, and the copy numbers of the reference and the mutated allele in tumor cells with the mutation, δs0 and δsa, respectively. The frequency of tumor and WT cells without the mutation is (1 − φs) and the two reference alleles can be assumed to have a combined copy number of 2δs. ce To compare inference methods we synthetically generated profiling data based on parametrized simulated copy number distributions. b Shown are representative phylogenies and c a representative cellular composition matrix, as well as d density plots of average copy numbers across profiles of TCGA-profiled hepatocellular (HCC) and breast (BRCA) carcinomas. These include the distribution of copy numbers in two individual HCCs (HCC1 and HCC2) and across all HCCs (black) and all BRCAs (blue); copy numbers ranged from 0 to >260×. e Simulated copy numbers, including simulations of more-stable and less-stable cancers, ranged from 0× to 15× copies.
Fig. 3
Fig. 3. Performance of mutation frequency estimates on simulated data.
a Performance—measured by mean error across simulated WES datasets from genomes with varying mutation copy numbers—of mutation-frequency estimates by AncesTree (purple), SCHISM (red), and Chimæra (green and blue); SCHISM and Chimæra were evaluated using multiple clustering methods in an effort to improve their accuracy, with SDIndex (SCHISM) and ElbowSSE (Chimæra) producing top accuracy, respectively. In blue, are reported estimates for the published Chimæra, which uses hdbscan. b No method is able to estimate mutation frequencies for every mutation; however, Chimæra assigns frequencies for over 80% of simulated mutations, compared to an average of 60% or fewer for other methods. c Errors in frequency estimates were correlated with genetic instability, which was measured here as the coefficient of variation within copy number distributions used in simulated WES profiles. Inferences by some methods were consistently better than others; e.g., SCHISM with SDIndex clustering outperformed AncesTree inferences. Chimæra clearly outperformed all the other methods regardless of the clustering strategy. d While copy-number variability in the same sample was correlated with inference errors, the absolute magnitude of copy numbers had no significant effect on Chimæra’s performance. We report results for Chimera (hdbscan) and SCHISM with SDIndex (a representative that resembles results with other clustering methods). Standard errors are reported. Mean error is the mean of L1 distances between true and estimated mutation frequencies after normalizing for the number of biopsies tested.
Fig. 4
Fig. 4. The number of predicted subclones depends on the number of profiled regions per tumor.
a, b Lin et al. profiled five regions of each of nine HBV-positive HCCs. We profiled 6–8 regions of each of three Wilms’ tumors and ten regions of a castrate-resistant prostate cancer (CRPC). For each tumor, we exhaustively selected all region subsets size-2 and up, and compared the number of predicted tumor subclones across subsets to those obtained using all available region profiles using a Chimæra and b SCHISM. Chimæra analysis of any 4-tumor regions resulted in a similar number of subclones as analysis of five regions, however, profiling two regions produced fewer predicted subclones. SCHISM performed better on stable genomes (CG118) than on unstable genomes (CG163 and CRPC). c Chimæra analyses (top) of HCC6046 profiles suggested convergence of subclone predictions using three profiled regions, while SCHISM analyses (bottom) produced a higher prediction variability across profiling subsets. d Similarly, Chimæra analyses of four regions of CG565 produced a similar number of clones as profiles of eight regions. e Chimæra analyses of seven regions of our CRPC tumor produced a similar number of clones as analysis of ten regions; however, analyses based on five or fewer tumor areas produced significantly more predicted tumor subclones due to reduced aggregating power. SCHISM analyses based on six or more regions produced consistent counts of predicted subclones, but this number was considerably greater than the number of subclones predicted by Chimæra.
Fig. 5
Fig. 5. Inferred tumor phylogenies for HBV-positive HCCs suggest that WNT-signaling pathway mutations play a key role in tumor initiation.
ac Mutations in TP53 were inferred to initiate tumorigenesis in three of the nine tumors we studied; labels correspond to labeling by Lin et al. d All nine tumors had mutations in WNT-signaling pathway genes that were predicted in the initiating tumor subclone. e The majority of the 102 TCGA-profiled HBV-positive HCCs had mutations in WNT-signaling pathway genes, which was the most significantly mutated KEGG pathway in these patients. Most other significantly mutated pathways were no longer enriched for mutations after the exclusion of WNT-signaling pathway genes from the analysis.
Fig. 6
Fig. 6. Inferred tumor phylogenies for high-risk Wilms’ tumors identified driving initiating mutations.
a The location of eight CG565 regions selected for profiling. b The inferred phylogeny for CG118 suggested that it is composed of two major subclones driven by previously observed mutations in CTNNB1 and WT1, with the CTNNB1-mutated clone accounting for a larger proportion of the tumor. CG565 was predicted to acquire mutations in ITGA3 and MACF1 that coincided with clonal expansion. The initiation of CG163 was predicted to include a mutation in LIN28A, which is sufficient to drive Wilms’ tumor genesis. c, d RNA-expression profiles in c regions that were more abundant with each of the CG118 subclones—90% vs. 70%, and 30% vs. 7%, for the CTNNB1-mutated and WT1-mutated subclones, respectively—and d LIN28A-mutated subclones of CG163 (100% vs. 74%) suggested differential expression of the gene programs downstream from these predicted drivers.
Fig. 7
Fig. 7. Inferred phylogenies of tumors from three prostate cancer patients.
a Five regions of Prostate Cancer 1 (PC1) were profiled at each of three time points, identifying potentially deleterious mutations at each time point. b PC1’s inferred phylogeny suggested that EP300 p.I997V mutation was present at Time Point 1, and that the tumor subclone with EP300 p.I997V (Subclone 1) is distinct from the subclone with AR p.T878A (Subclone 2), which was observed only in the later time point and whose clonal frequency increased with time. c Differential protein expression analysis suggested that regions that were predicted to have high clonal composition of Subclone 2 (82% vs. 0%) had higher AR-target expression than regions without Subclone 2. d Inferred phylogeny for Prostate Cancer 2 (PC2) suggested that RB1 loss was an initiating event, and that that majority of tumor cells are the results of divergent evolution following the acquisition of PTEN and BRCA2 mutations, Subclones 2 and 3, respectively. In total, 5 regions of PC2 were profiled in each of the five Time Points; Subclone 1 was observed in all time points, and Subclones 3 and 4 in Time Points 4 and 5. e PC3’s inferred phylogeny included RB1 loss as an initiating event, followed by the acquisition of a BRCA1 mutation. These tumor cells then either acquired TP53 and PTEN mutations, or PALB2, BRIP1, and BRCA2 mutations. All mutations and subclones were observed in each of the two time points profiled. The PTEN, BRCA1, and BRCA2 mutations were previously observed in cancers. f A comparison of PC3 regions with low and high composition for Subclones 3 and 4, 90% vs. 0% and 88% vs. 0%, respectively, suggested significant differential protein expression for targets of TP53 and PTEN.

References

    1. Futreal PA, et al. A census of human cancer genes. Nat. Rev. Cancer. 2004;4:177–183. - PMC - PubMed
    1. Higgins ME, Claremont M, Major JE, Sander C, Lash AE. CancerGenes: a gene selection resource for cancer genome projects. Nucleic Acids Res. 2007;35:D721–D726. - PMC - PubMed
    1. Ding L, et al. Perspective on oncogenic processes at the end of the beginning of cancer genomics. Cell. 2018;173:305–320. e310. - PMC - PubMed
    1. Nowell PC. The clonal evolution of tumor cell populations. Science. 1976;194:23–28. - PubMed
    1. Fidler IJ, Hart IR. Biological diversity in metastatic neoplasms: origins and implications. Science. 1982;217:998–1003. - PubMed

Publication types