

Demonstrating the Efficacy of the Health Sciences and Technology Academy: Using Archival Standardized Test Scores to Analyze an OST College-Preparatory Program for Underserved Youth
- PMID: 32844152
- PMCID: PMC7444752
- DOI: 10.15695/jstem/v1i1.19
Demonstrating the Efficacy of the Health Sciences and Technology Academy: Using Archival Standardized Test Scores to Analyze an OST College-Preparatory Program for Underserved Youth
Abstract
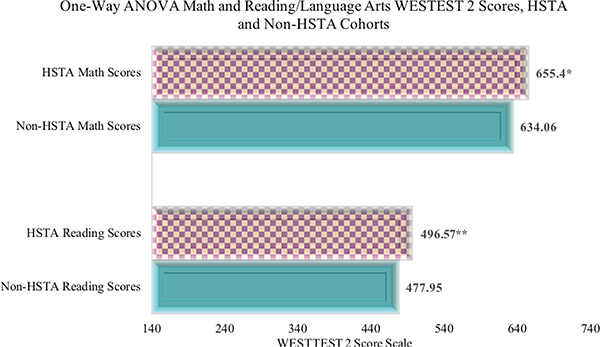
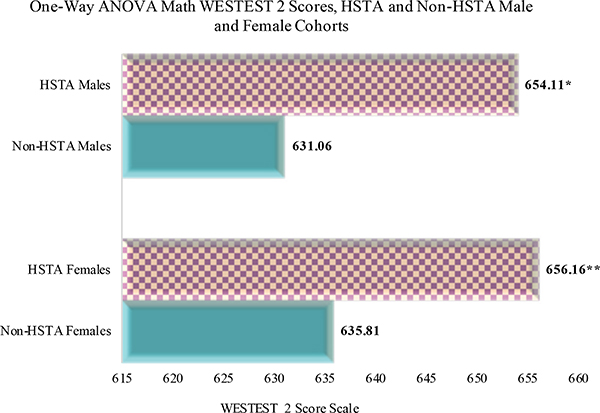
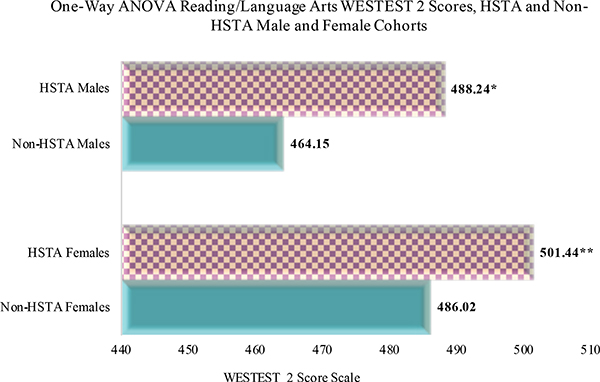
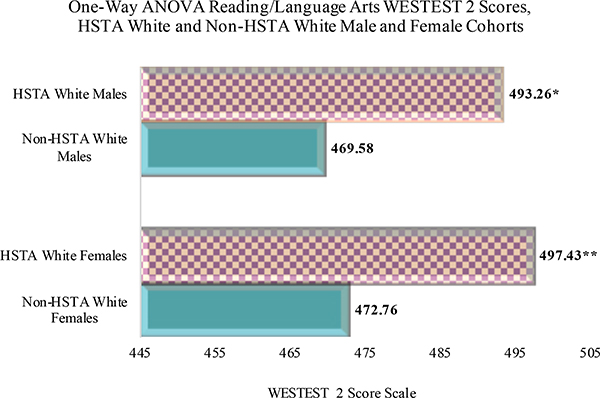
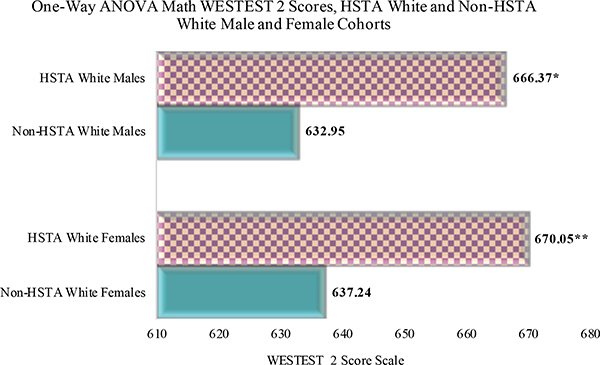
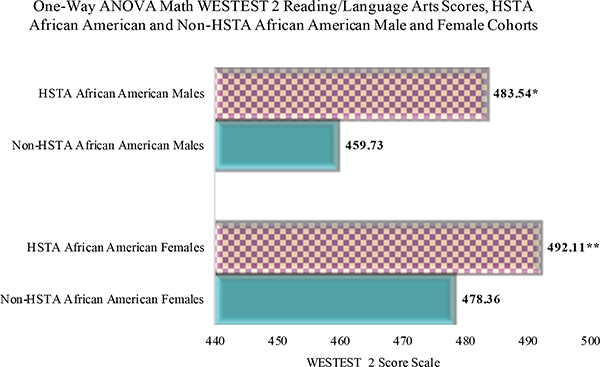
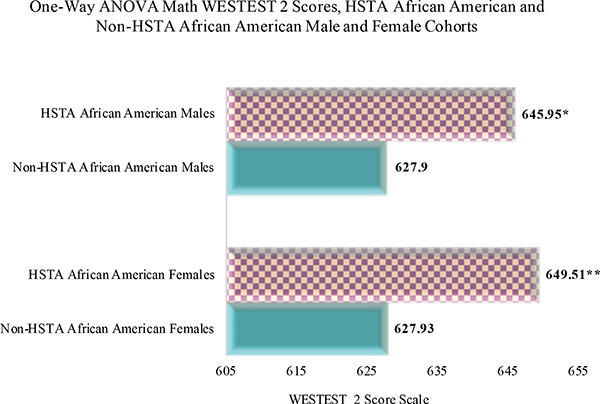
To combat educational and health disparities, out-of-school-time (OST) STEM enrichment programs provide services to underserved youth to encourage them to pursue college and health careers. This article describes a study conducted to determine if the Health Sciences and Technology Academy (HSTA) program participants who receive year-round educational interventions to prepare them for STEM and health sciences majors performed better on the West Virginia Educational Standards Test (WESTEST2) than non-participants. This study provides descriptive and inferential statistics, specifically one-way ANOVAs with one-to-one matching based on grade level, gender, race, and GPA at the end of the 8th grade year for 336 students. Statistically significant differences were found favoring HSTA participants on the WESTEST2 math and reading/language scores.
Keywords: at risk students; out-of-school-time programs; standardized test; statistical analysis; stem enrichment.
Figures
Similar articles
-
The Health Sciences and Technology Academy (HSTA): Providing 26 Years of Academic and Social Support to Appalachian Youth in West Virginia.J STEM Outreach. 2020 Oct;3(3):10.15695/jstem/v3i3.04. doi: 10.15695/jstem/v3i3.04. Epub 2020 Oct 21. J STEM Outreach. 2020. PMID: 34142020 Free PMC article.
-
A COMPARISON OF ACADEMIC PERFORMANCE MEASURES OF HSTA PARTICIPANTS WITH NON-HSTA PARTICIPANTS: IS IT POSSIBLE TO NARROW THE AFRICAN AMERICAN-WHITE ACHIEVEMENT GAP?J STEM Outreach. 2019 Dec;2(1):10.15695/jstem/v2i1.20. doi: 10.15695/jstem/v2i1.20. Epub 2019 Dec 10. J STEM Outreach. 2019. PMID: 32705077 Free PMC article.
-
Engaging rural youth in physical activity promotion research in an after-school setting.Prev Chronic Dis. 2005 Nov;2 Spec no(Spec No):A15. Epub 2005 Nov 1. Prev Chronic Dis. 2005. PMID: 16263048 Free PMC article.
-
The Stanford Medical Youth Science Program: 18 years of a biomedical program for low-income high school students.Acad Med. 2007 Feb;82(2):139-45. doi: 10.1097/ACM.0b013e31802d8de6. Acad Med. 2007. PMID: 17264691 Review.
-
Anatomy of a successful K-12 educational outreach program in the health sciences: eleven years experience at one medical sciences campus.Anat Rec. 2002 Aug 15;269(4):181-93. doi: 10.1002/ar.10136. Anat Rec. 2002. PMID: 12209556 Review.
Cited by
-
High School Students' Learning During the COVID-19 Pandemic: Perspectives from Health Sciences and Technology Academy Participants.J STEM Outreach. 2021;4(2):25838. doi: 10.15695/jstem/v4i2.09. Epub 2021 Jul 19. J STEM Outreach. 2021. PMID: 35815204 Free PMC article.
-
The Health Sciences and Technology Academy (HSTA): Providing 26 Years of Academic and Social Support to Appalachian Youth in West Virginia.J STEM Outreach. 2020 Oct;3(3):10.15695/jstem/v3i3.04. doi: 10.15695/jstem/v3i3.04. Epub 2020 Oct 21. J STEM Outreach. 2020. PMID: 34142020 Free PMC article.
-
A COMPARISON OF ACADEMIC PERFORMANCE MEASURES OF HSTA PARTICIPANTS WITH NON-HSTA PARTICIPANTS: IS IT POSSIBLE TO NARROW THE AFRICAN AMERICAN-WHITE ACHIEVEMENT GAP?J STEM Outreach. 2019 Dec;2(1):10.15695/jstem/v2i1.20. doi: 10.15695/jstem/v2i1.20. Epub 2019 Dec 10. J STEM Outreach. 2019. PMID: 32705077 Free PMC article.
-
The development and validation of an academic, work health sciences, and community intentions scale for out-of-school-time (OST) participants.Eval Program Plann. 2023 Feb;96:102190. doi: 10.1016/j.evalprogplan.2022.102190. Epub 2022 Nov 25. Eval Program Plann. 2023. PMID: 36455342 Free PMC article.
References
-
- Afterschool Alliance. (2015). Evaluations Backgrounder: A Summary of Formal Evaluations of Afterschool programs’ Impact on Academics, Behavior, Safety and Family Life. Retrieved March 9, 2018 from http://afterschoolalliance.org//documents/Evaluation_Backgrounder.pdf
-
- Berliner DC (2009). Poverty and Potential: Out-of-School Factors and School Success. Boulder and Tempe: Education and the Public Interest Center & Education Policy Research Unit; Retrieved March 8, 2018 from http://nepc.colorado.edu/publication/poverty-and-potential
-
- Civil Rights Act. (1964). Public Law 88–352. Retrieved March 9, 2018 from http://library.clerk.house.gov/referencefiles/PPL_CivilRightsAct_1964.pdf
Grants and funding
LinkOut - more resources
Full Text Sources