. 2021 Jan 1;31(1):341-355.
doi: 10.1093/cercor/bhaa229.

Normative Analysis of Individual Brain Differences Based on a Population MRI-Based Atlas of Cynomolgus Macaques

Affiliations

Normative Analysis of Individual Brain Differences Based on a Population MRI-Based Atlas of Cynomolgus Macaques

Qiming Lv et al. Cereb Cortex. .

Abstract

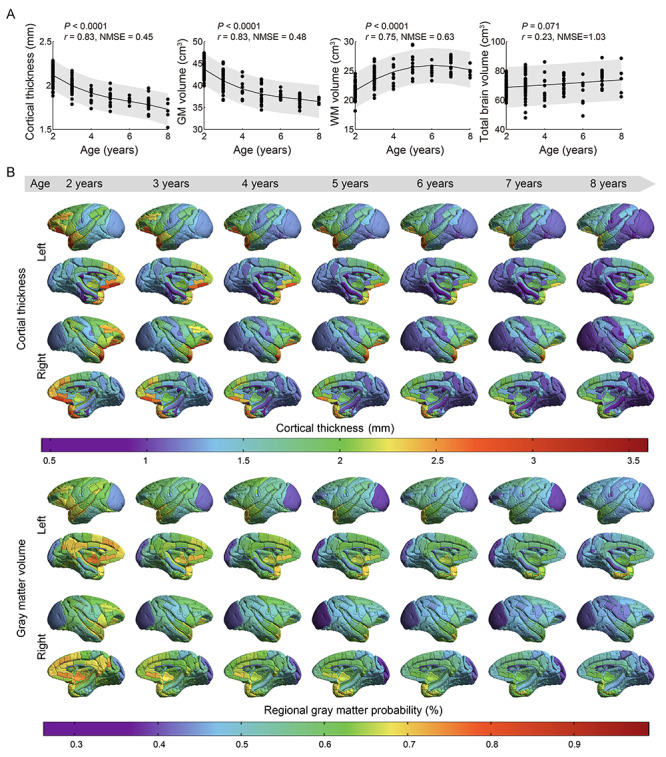
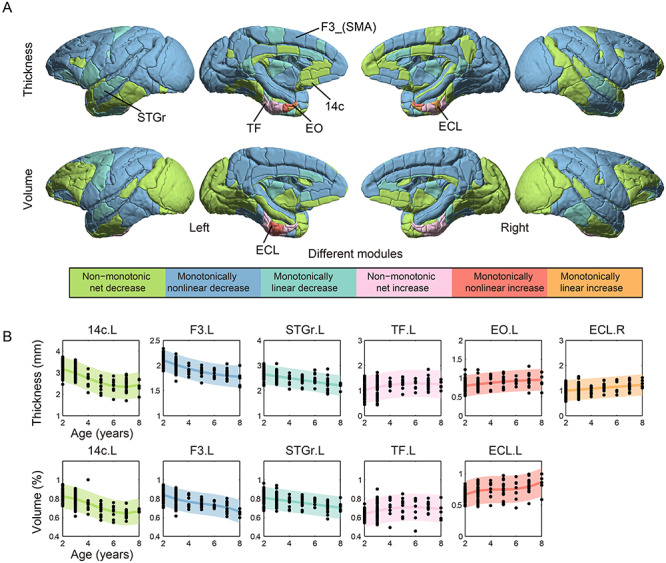
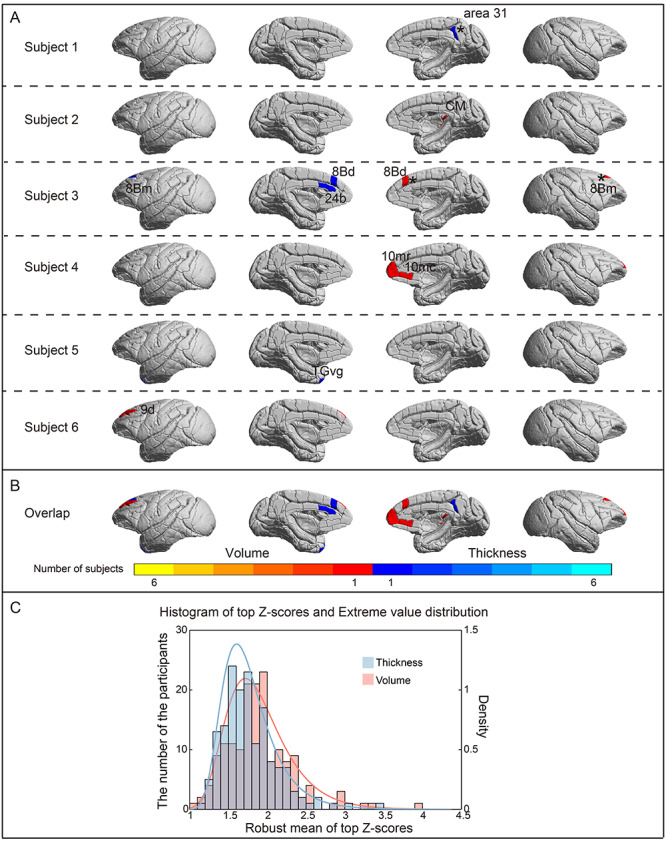
The developmental trajectory of the primate brain varies substantially with aging across subjects. However, this ubiquitous variability between individuals in brain structure is difficult to quantify and has thus essentially been ignored. Based on a large-scale structural magnetic resonance imaging dataset acquired from 162 cynomolgus macaques, we create a species-specific 3D template atlas of the macaque brain, and deploy normative modeling to characterize individual variations of cortical thickness (CT) and regional gray matter volume (GMV). We observed an overall decrease in total GMV and mean CT, and an increase in white matter volume from juvenile to early adult. Specifically, CT and regional GMV were greater in prefrontal and temporal cortices relative to early unimodal areas. Age-dependent trajectories of thickness and volume for each cortical region revealed an increase in the medial temporal lobe, and decreases in all other regions. A low percentage of highly individualized deviations of CT and GMV were identified (0.0021%, 0.0043%, respectively, P < 0.05, false discovery rate [FDR]-corrected). Our approach provides a natural framework to parse individual neuroanatomical differences for use as a reference standard in macaque brain research, potentially enabling inferences regarding the degree to which behavioral or symptomatic variables map onto brain structure in future disease studies.

Keywords: brain atlas; cortical thickness; cynomolgus macaque; individual differences; normative model.


Figures

Figure 1
Figure 1
Pipeline of the cynomolgus monkey template creation. (A) Preprocessing. T1-weighted images of the brain were collected from 162 cynomolgus monkeys. A set of 5–7 MRI volumes were obtained from each subject. All images were aligned and subject to motion correction, intensity bias correction before being averaged within 1 subject. (B) Template creation. A symmetric group-wise normalization template building algorithm was applied to the preprocessed images to obtain the whole-head template. The whole-head template was then skull-stripped manually to obtain the brain-only template. The D99 digital parcellation was warped to the current template space for cortical labeling. (C) Generating tissue probability maps. The skull-stripped T1-weighted images were segmented, reformatted, and averaged to obtain tissue probability maps. (D) Surface generation. The segmented GM and WM masks and the reformatted parcellations of the label map were used to create the surface files. 3D-printed GM surface is also presented. (E) Cortical thickness. Cortical thickness of the present template was calculated for next-step analysis.
Figure 2
Figure 2
The cynomolgus monkey template. Axial slices showing the brain template (A) and tissue probability maps for GM, WM, and CSF (B–D) and tissue segmentation (GM, red; WM, blue; CSF, green) (E). Nonlinear alignment was applied to the D99 digital anatomical atlas to propagate labels into the present template (F). Cortical thickness map is overlaid on the T1 template (G). Deformation vector fields were calculated for all the monkey brains and averaged to form the MPD image (H). The color scale represents the level of displacement. Warm color indicates larger voxel displacement. Note that structures located in the center of the brain display the least amount of displacement.
Figure 3
Figure 3
Comparison between the MRI template and the corresponding histological map. A coronal slice with delineated subcortical areas in the MRI volume (A) and corresponding histological section (B). A histological map was generated from the SMI-32 stained section. Note that the labeled subregions, thalamic nuclei, and other subcortical structures, such as subthalamic nucleus, zona incerta, and red nucleus are evident in the current MRI template. The anatomical labeling of sulci is depicted on the brain surface. Arsp, arcuate sulcus spur; cs, central sulcus; iar, inferior arcuate sulcus; lf, lateral fissure; lus, lunate sulcus; ps, principal sulcus; sar, superior arcuate sulcus; sts, superior temporal sulcus.
Figure 4
Figure 4
Cortical surfaces and 3D printing. GM and WM surfaces were reconstructed from segmentations of the template (AB). These surface maps were painted with D99 labels (C) and photographed after 3D printing (D).
Figure 5
Figure 5
Age trajectories and spatial distribution of cortical volume and thickness. (A) Both the total GMV and mean CT show monotonic decreasing trajectories from age 2 to 8 years, whereas the total WMV presents an inverted U-shape increasing trajectory throughout the juvenile and adolescence periods followed by a decline in early adulthood (NMSE = 0.45, 0.48, 0.63, respectively; Pearson’s correlation, P < 0.0001, r = 0.83, 0.83, 0.75, respectively, P < 0.05, FDR-corrected). The total brain volume exhibits a modest, gradual increase trend (NMSE = 1.03; Pearson’s correlation, P = 0.071, r = 0.23, P < 0.05, FDR-corrected). Shaded bands indicate 95% prediction intervals. (B) Spatial distribution of CT and regional GMV across the whole brain at different ages. CT and regional GMV show overall decreases within this age range. The temporal pole, medial frontal and other prefrontal cortices have greater thickness and regional GMV than the sensory, visual, and limbic cortices at all developmental stages.
Figure 6
Figure 6
Developmental modules of synchronized thickness and volume change. (A) Modules composed of regions with similar maturational trajectories for CT and regional GMV during the juvenile period, adolescence, and early adulthood. Six normative developmental modules are identified by the annual rate of thickness or volume change: monotonically linear decrease/increase (cyan/orange), monotonically nonlinear decrease/increase (blue/red), and nonmonotonic net decrease/increase (green/pink). Growth trajectories of CT and regional GMV decrease linearly and nonlinearly with advancing age in most cortical regions, except that the medial temporal cortex (including parahippocampal, entorhinal, and perirhinal cortices), increase over time. (B) Typical regional-wise normative models of CT and regional GMV changes are shown for each module, including 14c (area 14c), ECL (entorhinal cortex, caudal limiting division), EO (entorhinal cortex, olfactory division), F3_SMA (agranular frontal area F3, supplementary motor area), STGr (rostral superior temporal gyrus), TF (area TF of the parahippocampal cortex). The module of monotonically linear increase (orange color) was not found in the developmental trajectory of GMV (Fig. S6). Brain regions with no significant correlation between measured and predicted values and high NMSE are shown in Figure S7 and Tables S1, S2. Color-coded shaded areas indicate 95% prediction intervals. L, left; R, right.
Figure 7
Figure 7
Individual deviations from the normative model. (A) Subject-level Z-score maps showing brain regions that deviate from the normative model in CT (blue color) and regional GMV (red color) (color: |Z| > 3.3, P < 0.001, uncorrected; black star: |Z| > 4, P < 0.05, FDR-corrected). The deviating regions in these subjects were different and widespread in prefrontal, temporal, and cingulate cortices, including 8 Bd (area 8B, dorsal subdivision), 8Bm (area 8B, medial subdivision), 9d (area 9, dorsal subdivision), 10mr (area 10 m), 10mc (area 10c), 24b (area 24b in the anterior cingulate cortex), 31 (area 31 in the posterior cingulate cortex), CM, TGvg. The CT of right area 31, and left TGvg and the GMV of right CM have greater values than would be predicted by the normative model and the CT of left 8Bm, 8 Bd, 24b and the GMV of right 8 Bd, 8Bm, 10mr, 10mc, and left 9d have reduced values relative to ones predicted by the normative model. (B) Region overlap of individual deviations in the monkey cohort. There was no overlap of deviating brain regions between any 2 subjects. The color bar represents the number of deviating subjects. (C) Extreme value histogram and extreme value distribution of CT and volume.

Similar articles

Cited by

References

    1. Avants BB, Epstein CL, Grossman M, Gee JC. 2008. Symmetric diffeomorphic image registration with cross-correlation: evaluating automated labeling of elderly and neurodegenerative brain. Med Image Anal. 12:26–41. - PMC - PubMed
    1. Avants BB, Tustison NJ, Song G, Cook PA, Klein A, Gee JC. 2011. A reproducible evaluation of ANTs similarity metric performance in brain image registration. NeuroImage. 54:2033–2044. - PMC - PubMed
    1. Avants BB, Yushkevich P, Pluta J, Minkoff D, Korczykowski M, Detre J, Gee JC. 2010. The optimal template effect in hippocampus studies of diseased populations. NeuroImage. 49:2457–2466. - PMC - PubMed
    1. Ball G, Seal ML. 2019. Individual variation in longitudinal postnatal development of the primate brain. Brain Struct Funct. 224:1185–1201. - PubMed
    1. Belmonte Juan Carlos I, Callaway Edward M, Caddick SJ, Churchland P, Feng G, Homanics Gregg E, Lee K-F, Leopold David A, Miller Cory T, Mitchell Jude F et al. . 2015. Brains, genes, and primates. Neuron. 86:617–631. - PMC - PubMed

Publication types