

Mechanism and inhibition of the papain-like protease, PLpro, of SARS-CoV-2
- PMID: 32845033
- PMCID: PMC7461020
- DOI: 10.15252/embj.2020106275
Mechanism and inhibition of the papain-like protease, PLpro, of SARS-CoV-2
Abstract
The SARS-CoV-2 coronavirus encodes an essential papain-like protease domain as part of its non-structural protein (nsp)-3, namely SARS2 PLpro, that cleaves the viral polyprotein, but also removes ubiquitin-like ISG15 protein modifications as well as, with lower activity, Lys48-linked polyubiquitin. Structures of PLpro bound to ubiquitin and ISG15 reveal that the S1 ubiquitin-binding site is responsible for high ISG15 activity, while the S2 binding site provides Lys48 chain specificity and cleavage efficiency. To identify PLpro inhibitors in a repurposing approach, screening of 3,727 unique approved drugs and clinical compounds against SARS2 PLpro identified no compounds that inhibited PLpro consistently or that could be validated in counterscreens. More promisingly, non-covalent small molecule SARS PLpro inhibitors also target SARS2 PLpro, prevent self-processing of nsp3 in cells and display high potency and excellent antiviral activity in a SARS-CoV-2 infection model.
Keywords: COVID-19; ISG15; papain-like protease; small molecule inhibitor; ubiquitin.
© 2020 The Authors.
Conflict of interest statement
The authors declare that they have no conflict of interest.
Figures
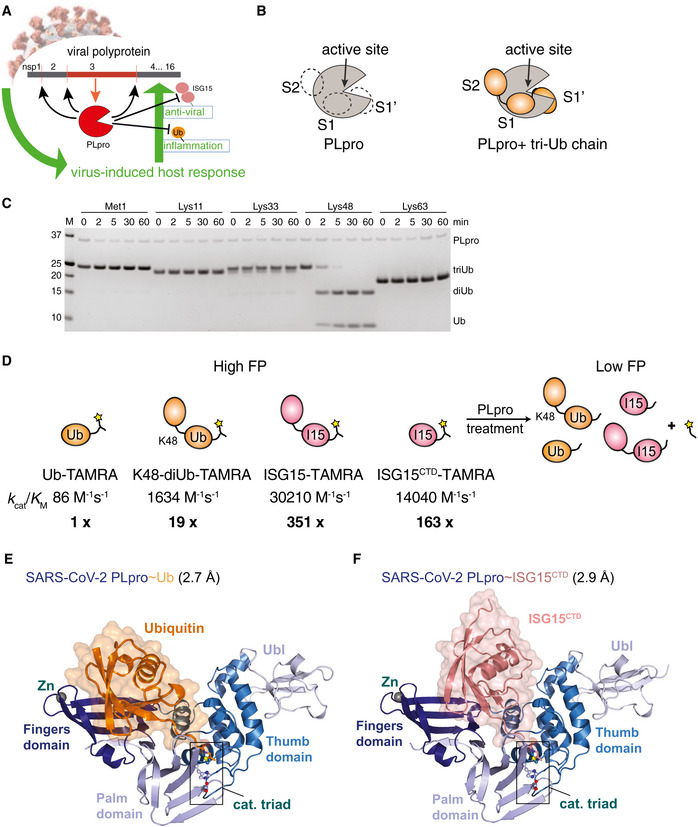
- A
Cartoon of coronavirus PLpro activities. PLpro is encoded as one of various domains of the 1,900 amino acid non‐structural protein nsp3 and is thought to have three functions: (i) cleaving the viral polyprotein to generate mature nsp1, nsp2 and nsp3; (ii) hydrolysing ubiquitin chains important for inflammatory responses and (iii) removing interferon‐stimulated gene 15 (ISG15) modifications from proteins, reversing antiviral responses.
- B
Schematic of ubiquitin‐binding sites in SARS PLpro, which binds Lys48‐triubiquitin via S2, S1 and S1′ ubiquitin‐binding sites. Hydrolysis occurs between ubiquitin molecules bound at S1 and S1′.
- C
Time course analysis of triubiquitin (2 μM) hydrolysis using 250 nM SARS2 PLpro, resolved on a Coomassie‐stained SDS–PAGE gel. Linkage‐specific cleavage of Lys48‐linked triubiquitin to di‐ and monoubiquitin resembles SARS PLpro activity (Békés et al, 2015, 2016). See Appendix Fig S1B–D for gel‐based cleavage quantification.
- D
Overview of the catalytic efficiencies of PLpro. A fluorescence polarisation (FP) assay was used to derive the catalytic efficiencies (k cat/K M) of PLpro for the depicted substrates. Catalytic efficiencies were calculated from data shown in Appendix Fig S1A, as described in Materials and Methods. Substrate preference is indicated by x‐fold activity relative to Ub‐TAMRA cleavage.
- E
Crystal structure at 2.7 Å resolution of SARS2 PLpro with subdomains coloured in shades of blue, bound to ubiquitin propargylamine (Ub‐PA, orange). Catalytic triad residues are shown in ball‐and-stick representation, and a Zn ion is indicated as a grey sphere. Also see Appendix Fig S2 and Table 1.
- F
Crystal structure at 2.9 Å resolution of SARS2 PLpro (blue) bound to ISG15 C‐terminal domain propargylamide (ISGCTD‐PA, salmon). Also see Appendix Fig S2 and Table 1.
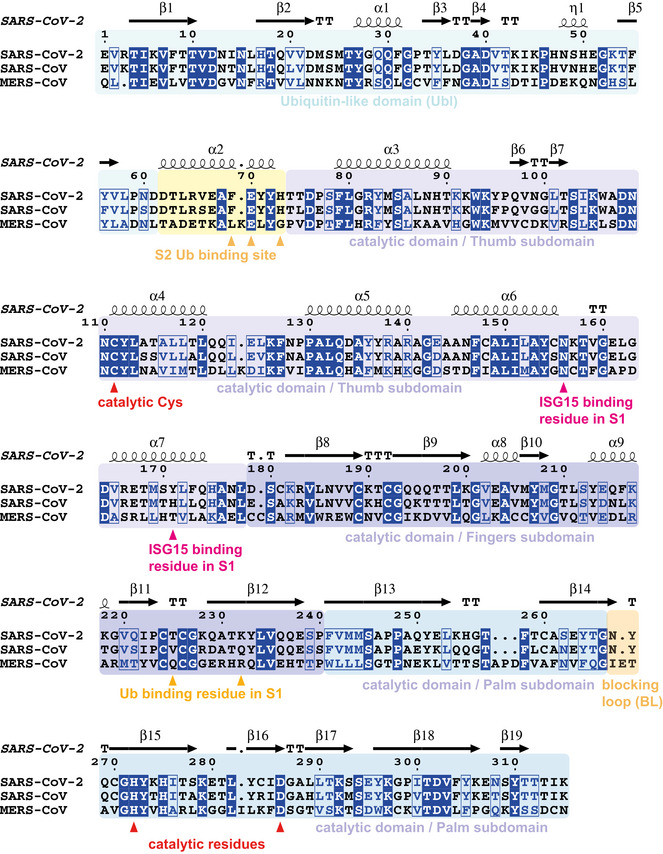
Sequence alignment generated with T‐coffee/ESPRIPT (Gouet et al, 2003; Magis et al, 2014) aligning PLpro sequences from SARS2, SARS and MERS. Sequence numbering and secondary structure elements are shown according to the high‐resolution apo structure of SARS-CoV‐2 PLpro (pdb 6wrh, unpublished). T, turn. Domains and subdomains are boxed in different colours, and catalytic triad, as well as residues mutated in this study, is indicated.
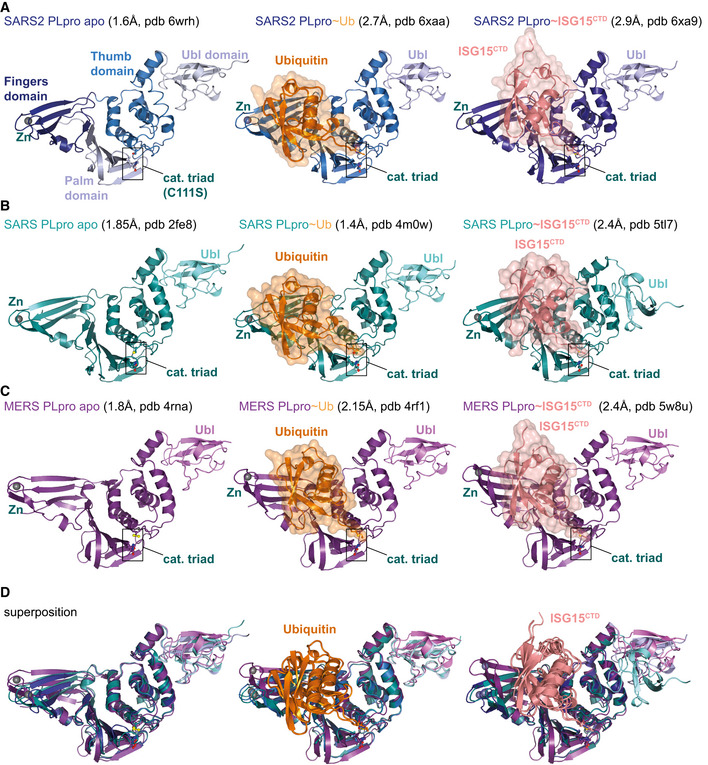
- A
left, the unpublished structure of apo SARS2 PLpro (pdb 6wrh, 1.6 Å, determined by the Centre for Structural Genomics of Infectious Disease (CSGID)) is coloured in analogy with Figs 1E and EV1, indicating Thumb, Fingers and Palm subdomain. The PLpro fold forms an open right hand that holds the ubiquitin fold, guiding its C‐terminus into the active site. PLpro contains an N‐terminal Ubl domain of unknown function, and this domain can vary in orientation. The high‐resolution structure was generated with a catalytic Cys to Ser mutation; a more common catalytic Cys to Ala mutant destabilises PLpro (Fig EV3D). Middle, structure of SARS2 PLpro bound to ubiquitin (orange, covered by a semi‐transparent surface). Right, structure of SARS2 PLpro bound to the C‐terminal domain of ISG15 (ISG15CTD, salmon, under a semi‐transparent surface). Also see Fig 1. In ubiquitin and ISG15CTD complexes, propargylamide‐based suicide probes (Ekkebus et al, 2013) covalently modify catalytic Cys111.
- B
left, SARS PLpro apo (1.85 Å, pdb 2fe8 (Ratia et al, 2006)), middle, SARS PLpro bound to ubiquitin (1.4 Å, pdb 4m0w (Chou et al, 2014)), right, SARS PLpro bound to the C‐terminal domain of ISG15 (2.4 Å, pdb 5tl7 (Daczkowski et al, 2017a)).
- C
left, MERS PLpro apo (1.84 Å, pdb 4rna (Lee et al, 2015)), middle, MERS PLpro bound to ubiquitin (2.15 Å, pdb 4rf1 (Bailey‐Elkin et al, 2014)), right, MERS PLpro bound to the C‐terminal domain of ISG15 (2.4 Å, pdb 5w8u (Daczkowski et al, 2017b)).
- D
Superpositions of PLpro structures with S1 site occupied by different modifiers. Overall, PLpro shows high similarity, extending to the position and orientation of the N‐terminal Ubl domain, with the notable exception of a distinct position of the Ubl in the SARS complex with ISG15CTD (pdb 5tl7 (Daczkowski et al, 2017a)). The second most variable region concerns the Fingers subdomain, which shows varying degrees of “openness.” Superposition shows that the structures of SARS and SARS2 bound to individual modifiers are highly similar, and the modifiers adapt identical orientations and engage in similar interactions with PLpro. MERS PLpro seems to vary on the theme of ubiquitin versus ISG15 recognition, by binding both modifiers similarly. In the MERS ubiquitin complex, the Fingers are more closed, and the ubiquitin is pushed towards the Thumb domain, to adopt a similar orientation and interaction as seen for ISG15 bound to MERS. MERS PLpro ubiquitin complexes have been determined with “open” and more “closed” Fingers (Bailey‐Elkin et al, 2014).
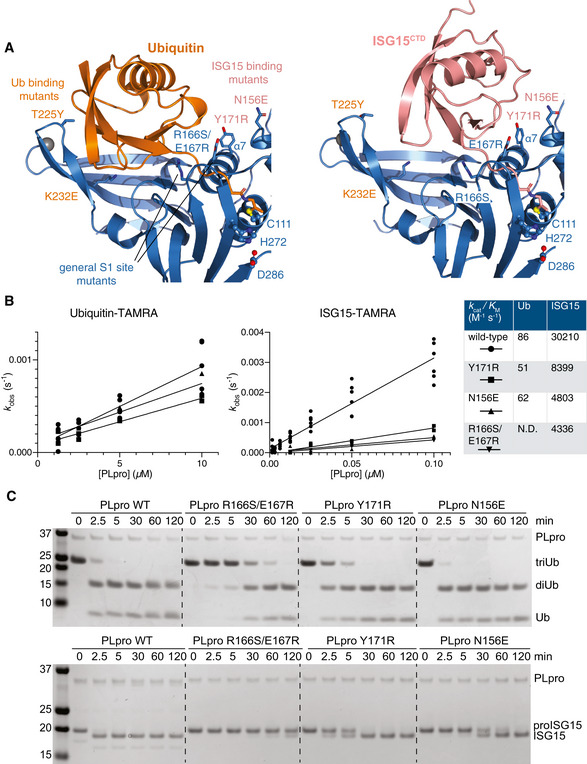
- A
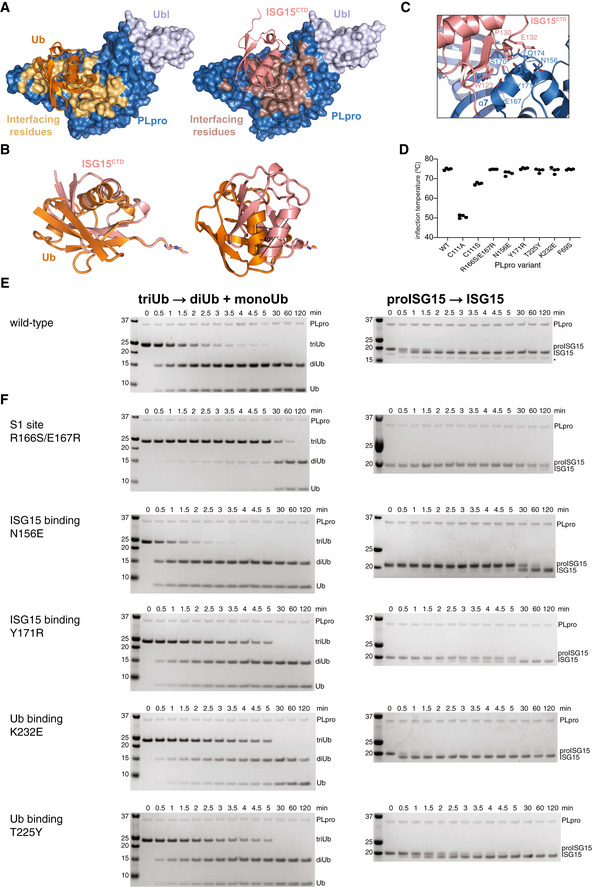
Detail of the S1 ubiquitin‐binding site of SARS2 PLpro, bound to ubiquitin (left) and ISG15 (right), highlighting differential interactions of ubiquitin with the Fingers subdomain, and of ISG15 with the Thumb subdomain of PLpro. Labelled residues were mutated, see Fig EV3.
- B
Fluorescence polarisation assays against ubiquitin‐TAMRA and ISG15‐TAMRA using indicated SARS2 PLpro variants performed in technical triplicate and n = 2 for each mutant, and compared to wild‐type PLpro as shown in Appendix Fig S1A. Catalytic efficiencies were calculated as described in Materials and Methods.
- C
Gel‐based analysis of PLpro variant activity against Lys48‐triubiquitin and proISG15. Experiments were performed in duplicate. Also see Fig EV3.
- A
Ubiquitin and ISG15 binding site analysis based on PISA analysis, indicating interface residues on SARS2 PLpro.
- B
Superposition of Ub‐PA (orange) and ISG15CTD‐PA (salmon) as bound to SARS2 PLpro highlights the different binding modes with a ˜ 40° rotation between the two proteins.
- C
Details of the binding of ISG15CTD and the Thumb domain of SARS2 PLpro. Interacting residues shown as sticks.
- D
Mutations in S1 and S2 sites were introduced in PLpro, and the enzyme variants were expressed in bacteria, purified and tested for integrity by assessing the inflection temperature, indicating the transition of folded to unfolded protein. With exception of mutating the catalytic Cys to Ala, which was severely destabilised and precipitated during purification, all other mutants showed similar stability to wild‐type PLpro. Inflection temperature values were determined in technical duplicate from experiments performed twice.
- E, F
Triubiquitin cleavage to mono‐ and diubiquitin (left) and proISG15 cleavage to mature ISG15 (right) were compared side‐by-side over a time course, resolved on SDS–PAGE gels, and visualised by Coomassie staining. Experiments were performed in duplicate with 250 nM enzyme and 2 μM substrate; all gels are shown in Source Data. (E), Activity of wild‐type PLpro, reproduced from Appendix Fig S1B and C, for comparison. (F), S1 site mutants as indicated. See Fig 2.
- A
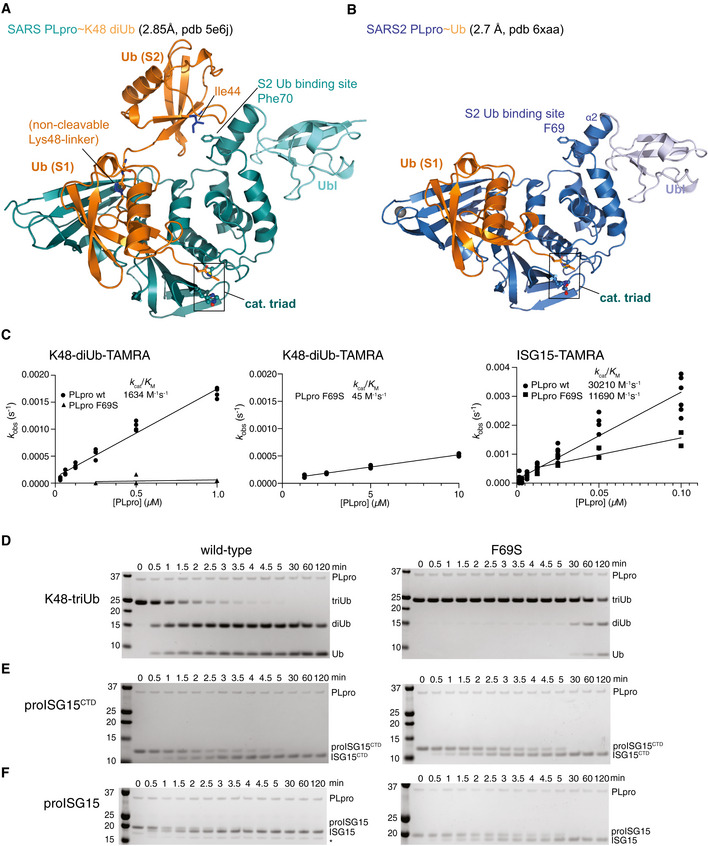
A previous structure of SARS PLpro bound to a non‐hydrolysable, Lys48‐linked diubiquitin probe (pdb 5e6j (Békés et al, 2016)) explained the noted preference of PLpro for longer Lys48‐linked chains. While the proximal ubiquitin unit occupies the S1 site in a highly similar fashion in SARS˜Ub and SARS2˜Ub structures (see (B), Figs 2A and EV2), the second, distal, ubiquitin unit binds to the α2 helix of PLpro, through a common binding mode involving the ubiquitin Ile44 patch. On helix α2, a central Phe70 in SARS PLpro residue is flanked by residues involved in polar contacts.
- B
Structure of the SARS2 PLpro˜Ub complex. The S2 site consisting of α2 helix with Phe69 residue is fully conserved in SARS2 PLpro (Fig EV1).
- C
Calculated enzymatic efficiencies for K48‐diUb-TAMRA cleavage, followed by fluorescence polarisation with PLpro wild‐type (reproduced from Appendix Fig S1A), and PLpro F69S. (Left) Using the same concentration range of SARS2 PLpro, the F69S mutant activity could not be fitted; (middle) a higher concentration recovered an activity slightly lower as compared to PLpro cleaving ubiquitin‐TAMRA (45 versus 86 M−1 s−1, compare Fig 1D, Appendix Fig S1A). (Right) A ˜ 3‐fold lower efficiency for PLpro F69S cleaving ISG15‐TAMRA yields values similar to cleavage of ISG15CTD‐TAMRA (Appendix Fig S1A), suggesting that the S2 site contributes the difference in binding for the N‐terminal Ubl‐fold. Experiments for F69S were performed in technical triplicate and biological duplicate; wild‐type data are reproduced from experiments shown in Fig 1D, Appendix Fig S1A.
- D–F
Gel‐based analysis showing hydrolysis time course of triubiquitin (D), proISG15CTD (E) and proISG15 (F) using wild‐type PLpro (left, wild‐type gels reproduced from Appendix Fig S1B–D to enable direct comparison) or PLpro F69S (right). PLpro F69S has a strong effect on triubiquitin hydrolysis (D), no marked effect on hydrolysis of proISG15CTD (E) and reduces proISG15 cleavage to the same levels as proISG15CTD (compare E, F), Experiments were performed in duplicate.
- A
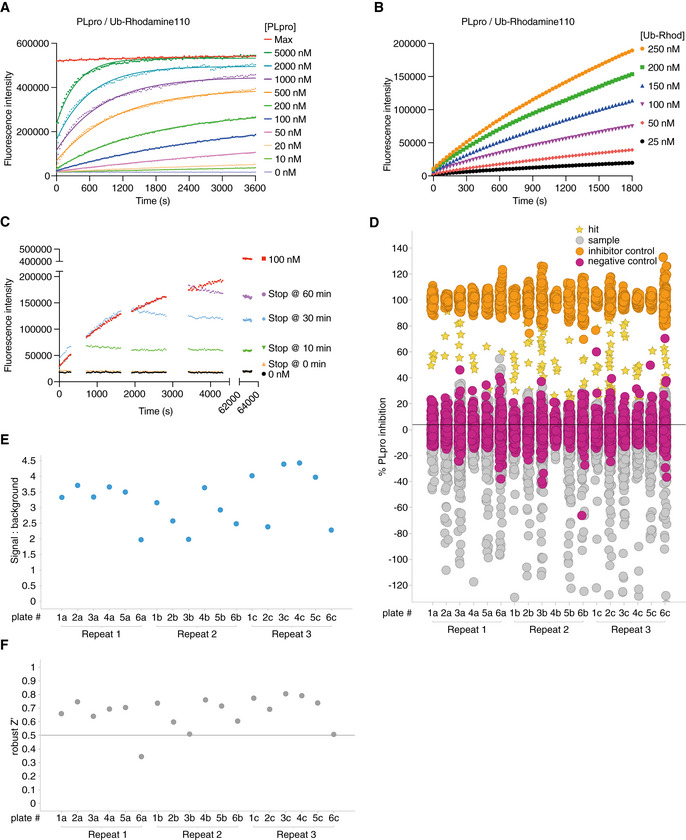
Suitable SARS2 PLpro concentrations were determined by kinetic analysis of increasing Ub‐Rhodamine fluorescence over 1 h (3,600 s). Concentrations ranged from 10 to 5,000 nM with sufficient signal obtained with 50 nM SARS2 PLpro at a constant concentration of 100 nM Ub‐Rhodamine. Maximal signal (Max) indicates pre‐incubated Ub‐Rhodamine with 25 nM PLpro for 1 h, to achieve complete cleavage of Ub‐Rhodamine, before measurement.
- B
To determine the optimal substrate concentration, 50 nM SARS2 PLpro was incubated with 25–250 nM Ub‐Rhodamine for 30 min (1,800 s). A final concentration of 100 nM Ub‐Rhodamine was selected, which was well below K M for SARS2 PLpro, in the linear range of the reaction, with a signal to background (S:B) above 3 at 12 min (720 s). 12 min was the timepoint selected for end‐point assays.
- C
Enzymatic reactions were stopped with addition of citric acid at a final concentration of 10 mM at indicated timepoints. The assay was benchmarked against compound rac5c (see below, Figs 5 and EV5). Rac5c inhibited SARS2 PLpro activity with an IC50 of 0.81 μM (Fig 5C, see Materials and Methods, Appendix Table S1).
- D
Results from the complete screen, by plate number (also see Dataset EV1).
- E
Signal:background analysis from the whole screen by plate number. 17 out of 18 plates met the quality control criteria (S:B > 2).
- F
Robust Z′ analysis of the whole screen by plate number. Plate 6a, which did not meet quality criteria in S:B and robust Z′ analysis, was excluded from analysis.
- A
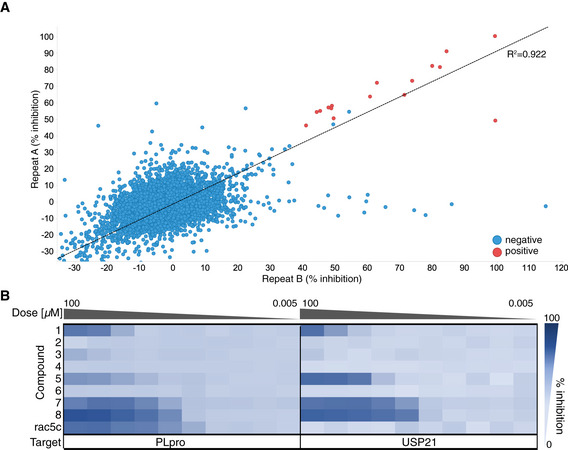
High‐throughput screening of SARS2 PLpro was performed against 5,576 approved drugs and late‐stage clinical compounds, in 1,536‐well format using Ub‐Rhodamine (see Materials and Methods). Two replicates out of three are shown; hit compounds were those that inhibited PLpro activity by more than 40% in all three replicates. Correlation (R 2) between all screens exceeded 0.89. See Fig EV4 for assay design and quality control, and Materials and Methods.
- B
Hit compounds and compound rac5c (see Fig 5) were further assessed in 10‐point IC50 titrations using the Ub‐Rhodamine assay, using a starting concentration of 100 μM serially diluted in 1:3 steps. Degree of inhibition is shown as a titration heat‐map from dark (full inhibition) to light blue (low/no inhibition). The catalytic domain of human USP21 (Ye et al, 2011) was used as a counterscreen. Each PLpro hit compound showed either no activity in the titration analysis or an identical inhibition profile against PLpro and USP21, suggesting assay interference. Rac5c was specific for SARS2 PLpro and did not inhibit USP21 even at the highest concentration of 100 μM. IC50 assays were performed in technical triplicate in two independent experiments.
- A
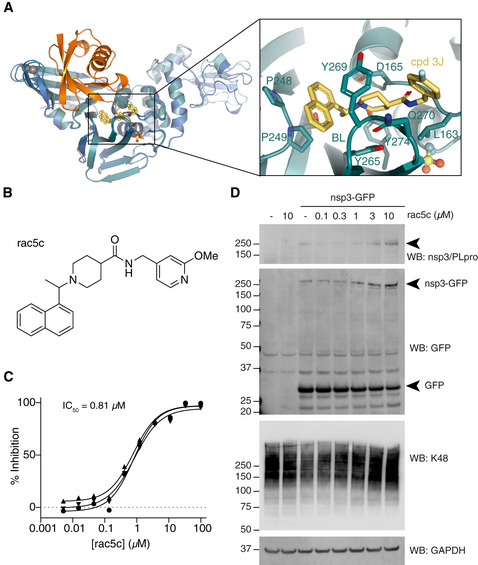
Structure of SARS PLpro bound to compound 3j (cyan/yellow, pdb 4ovz (Baez‐Santos et al, 2014)) superposed with SARS2 PLpro˜Ub (blue/orange). The inset shows compound 3j bound near the active site. See Fig EV5A and B for further details.
- B
Chemical structure of rac5c. See Appendix Supplementary Methods for detail on compound synthesis and characterisation.
- C
In vitro inhibition (IC50) for rac5c inhibiting SARS2 PLpro. Experiments were performed using the HTS assay (Fig 4), in technical triplicate in three independent experiments. A geometric mean was used to determine IC50.
- D
Full‐length nsp3 was expressed from a C‐terminally GFP‐tagged vector in HEK293T cells and treated with increasing concentrations of rac5c for 24 h. GFP is released from the C‐terminus, presumably by nsp3 protease activity. Nsp3 can be detected by a SARS/SARS2 PLpro antibody (see Fig EV5E for antibody validation). Lysates were blotted for Lys48‐linked polyubiquitin with a linkage‐specific antibody (K48). Experiments were performed in duplicate with similar results. Also see Fig EV5F and G, and Source Data for uncropped blots.
- A
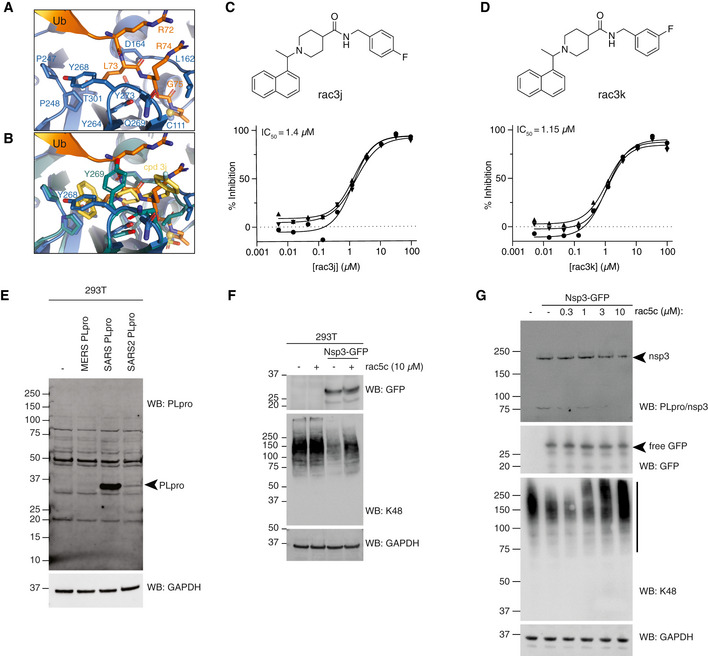
Structure of SARS2 PLpro bound to the ubiquitin C‐terminal tail in the active site, compare with Fig 5A.
- B
Superposition of ubiquitin tail in SARS2 PLpro, and compound 3j in SARS PLpro (pdb 4ovz (Baez‐Santos et al, 2014)) shows an identical binding for compounds in SARS2 PLpro and highlights the change in Tyr268/269 in SARS2 PLpro and SARS PLpro, respectively.
- C, D
Compounds rac3j and rac3k, racemic versions of 3j and 3k from (Baez‐Santos et al, 2014), and their in vitro biochemical IC50 values determined by the HTS assay technical triplicate and in three independent experiments (as for rac5c in Fig 5C).
- E
Immunoblot characterisation of the PLpro antibody on HEK 293T cells overexpressing PLpro from MERS, SARS or SARS2. Cell lysates were immunoblotted 48 h post‐transfection. PLpro antibody is cross‐reactive with SARS and SARS2, but not MERS PLpro.
- F
Immunoblot analysis showing the effect of rac5c (10 μM for 24 h) on Lys48‐polyubiquitin chain disassembly by nsp3, 48 h post‐transfection in HEK 293T cells. In this experiment, nsp3 expression was inferred by release of free GFP. Importantly, rac5c has no effect on global Lys48 chains in untransfected HEK293T cells.
- G
Experiment as in Fig 5D, with a clearer effect of nsp3 on K48‐linked polyubiquitin.
- A
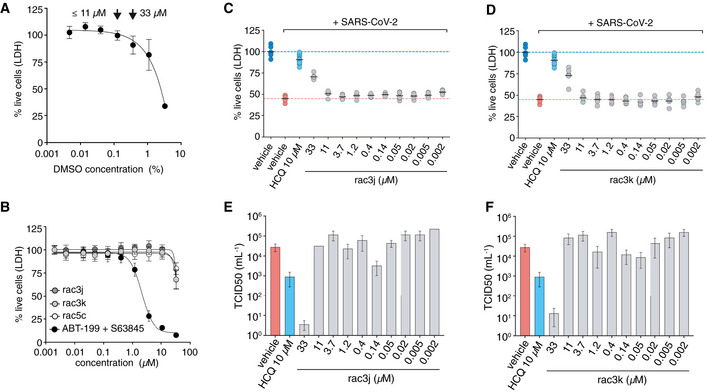
Vero cells were tested for compatibility with DMSO concentrations, revealing low toxicity at concentrations < 0.1% (v/v) but more substantial cytotoxicity at higher concentrations (0.3% and above). This limited the range of compound concentrations useable for infection studies; at concentrations up to 11 μM, 0.1% (v/v) DMSO was used as vehicle, at 33 μM compound concentration, 0.3% (v/v) DMSO was used. Higher concentrations of compound could not be tested due to this limitation. Data represent mean values ± SD from n = 12 technical replicates pooled from n = 2 independent experiments.
- B
Toxicity titration of compounds rac3j, rac3k and rac5c on Vero cells. At 33 μM compound concentration, cellular toxicity is ˜ 25%. ABT‐199 and S63845 are death‐inducing compounds (Souers et al, 2013; Kotschy et al, 2016) used as a control. Data are shown as mean ± SD with n = 12 technical replicates pooled from n = 2 independent experiments for rac3j, rac3k and the controls (ABT‐199 and S63845) and n = 18 technical replicates pooled from n = 3 independent experiments for rac5c.
- C, D
CPE assays to assess cell killing activity of SARS‐CoV-2 in Vero cells left untreated (DMSO control) or treated with compounds rac3j (C) and rac3k (D). One experiment with 6 biological replicates is shown (black line, mean), and compared to HCQ‐treated cells (10 μM) with pooled data from 2 experiments with n = 6, as in Fig 6B. The 33 μM compound concentration was performed at 0.3% (v/v) DMSO and significantly rescued infected cells despite underlying cytotoxicity in Vero cells (see A, B).
- E, F
TCID50 analysis of infectious virus for rac3j, rac3k, from the experiments performed in (C) and (D), respectively. Data are representative of 1 experiment out of 2, with n = 6 per experiment, bars represent the mean TCID50 value with error bars showing SD. HCQ control was performed within the same experiment.
- A
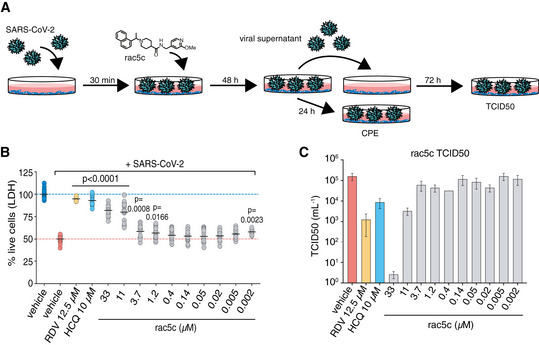
Vero cells were infected with SARS‐CoV-2 and analysed as shown in the cartoon (see Materials and Methods).
- B
Reduction in SARS‐CoV-2 induced cytopathic effect with rac5c, Remdesivir (RDV) and hydroxychloroquine (HCQ) treatment. DMSO 0.3% (v/v) was required to keep 33 μM rac5c in solution (see Fig EV6A and B). Mean (black line) is provided for 18 samples in each group, representing 3 independent experiments with 6 biological replicates per experiment across the different concentrations of rac5c. HCQ data are pooled from 2 independent experiments and RDV from 1 experiment using 6 biological repeats. P values were calculated using a one‐way ANOVA, with regular Dunnet's post hoc test for multiple comparisons between treatment arms and infected/vehicle‐treated control using a single pooled variance.
- C
TCID50 data, mean and SD, for one representative experiment from (B) with 6 technical replicates.
Similar articles
-
The complex structure of GRL0617 and SARS-CoV-2 PLpro reveals a hot spot for antiviral drug discovery.Nat Commun. 2021 Jan 20;12(1):488. doi: 10.1038/s41467-020-20718-8. Nat Commun. 2021. PMID: 33473130 Free PMC article.
-
Native Mass Spectrometry Reveals Binding Interactions of SARS-CoV-2 PLpro with Inhibitors and Cellular Targets.ACS Infect Dis. 2024 Oct 11;10(10):3597-3606. doi: 10.1021/acsinfecdis.4c00444. Epub 2024 Sep 20. ACS Infect Dis. 2024. PMID: 39303064
-
Structure-Based Screening to Discover New Inhibitors for Papain-like Proteinase of SARS-CoV-2: An In Silico Study.J Proteome Res. 2021 Jan 1;20(1):1015-1026. doi: 10.1021/acs.jproteome.0c00836. Epub 2020 Dec 22. J Proteome Res. 2021. PMID: 33350309
-
The SARS-coronavirus papain-like protease: structure, function and inhibition by designed antiviral compounds.Antiviral Res. 2015 Mar;115:21-38. doi: 10.1016/j.antiviral.2014.12.015. Epub 2014 Dec 29. Antiviral Res. 2015. PMID: 25554382 Free PMC article. Review.
-
Analysis of Structures of SARS-CoV-2 Papain-like Protease Bound with Ligands Unveils Structural Features for Inhibiting the Enzyme.Molecules. 2025 Jan 23;30(3):491. doi: 10.3390/molecules30030491. Molecules. 2025. PMID: 39942596 Free PMC article. Review.
Cited by
-
Myricetin inhibits transmissible gastroenteritis virus replication by targeting papain-like protease deubiquitinating enzyme activity.Front Microbiol. 2024 Jul 10;15:1433664. doi: 10.3389/fmicb.2024.1433664. eCollection 2024. Front Microbiol. 2024. PMID: 39050632 Free PMC article.
-
The FDA-approved drug Auranofin has a dual inhibitory effect on SARS-CoV-2 entry and NF-κB signaling.iScience. 2022 Oct 21;25(10):105066. doi: 10.1016/j.isci.2022.105066. Epub 2022 Sep 3. iScience. 2022. PMID: 36093378 Free PMC article.
-
Development of potent and selective inhibitors targeting the papain-like protease of SARS-CoV-2.Cell Chem Biol. 2021 Jun 17;28(6):855-865.e9. doi: 10.1016/j.chembiol.2021.04.020. Epub 2021 Apr 27. Cell Chem Biol. 2021. PMID: 33979649 Free PMC article.
-
Small molecules in the treatment of COVID-19.Signal Transduct Target Ther. 2022 Dec 5;7(1):387. doi: 10.1038/s41392-022-01249-8. Signal Transduct Target Ther. 2022. PMID: 36464706 Free PMC article. Review.
-
Investigating Derivatives of Tanshinone IIA Sulfonate Sodium and Chloroxine for Their Inhibition Activities against the SARS-CoV-2 Papain-like Protease.ACS Omega. 2022 Dec 12;7(51):48416-48426. doi: 10.1021/acsomega.2c06675. eCollection 2022 Dec 27. ACS Omega. 2022. PMID: 36591160 Free PMC article.
References
-
- Aragão D, Aishima J, Cherukuvada H, Clarken R, Clift M, Cowieson NP, Ericsson DJ, Gee CL, Macedo S, Mudie N et al (2018) MX2: a high‐flux undulator microfocus beamline serving both the chemical and macromolecular crystallography communities at the Australian Synchrotron. J Synchrotron Radiat 25: 885–891 - PMC - PubMed
MeSH terms
Substances
Associated data
- Actions
- Actions
Grants and funding
- MRF2002119/Department of Health | National Health and Medical Research Council (NHMRC)/International
- GNT1178122/Department of Health | National Health and Medical Research Council (NHMRC)/International
- GNT0637350/Department of Health | National Health and Medical Research Council (NHMRC)/International
- GNT1117089/Department of Health | National Health and Medical Research Council (NHMRC)/International
- IRIISS grant 361646/Department of Health | National Health and Medical Research Council (NHMRC)/International
LinkOut - more resources
Full Text Sources
Other Literature Sources
Molecular Biology Databases
Miscellaneous
