. 2020 Oct 15;31(22):2452-2462.
doi: 10.1091/mbc.E19-10-0586. Epub 2020 Aug 26.

Dynamics of Tpm1.8 domains on actin filaments with single-molecule resolution

Affiliations

Dynamics of Tpm1.8 domains on actin filaments with single-molecule resolution

Ilina Bareja et al. Mol Biol Cell. .

Abstract

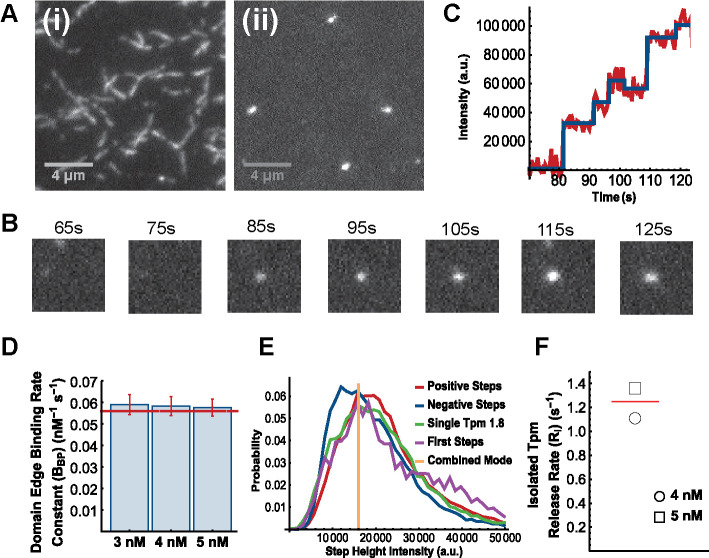
Tropomyosins regulate the dynamics and functions of the actin cytoskeleton by forming long chains along the two strands of actin filaments that act as gatekeepers for the binding of other actin-binding proteins. The fundamental molecular interactions underlying the binding of tropomyosin to actin are still poorly understood. Using microfluidics and fluorescence microscopy, we observed the binding of the fluorescently labeled tropomyosin isoform Tpm1.8 to unlabeled actin filaments in real time. This approach, in conjunction with mathematical modeling, enabled us to quantify the nucleation, assembly, and disassembly kinetics of Tpm1.8 on single filaments and at the single-molecule level. Our analysis suggests that Tpm1.8 decorates the two strands of the actin filament independently. Nucleation of a growing tropomyosin domain proceeds with high probability as soon as the first Tpm1.8 molecule is stabilized by the addition of a second molecule, ultimately leading to full decoration of the actin filament. In addition, Tpm1.8 domains are asymmetrical, with enhanced dynamics at the edge oriented toward the barbed end of the actin filament. The complete description of Tpm1.8 kinetics on actin filaments presented here provides molecular insight into actin-tropomyosin filament formation and the role of tropomyosins in regulating actin filament dynamics.


Figures

FIGURE 1:
FIGURE 1:
Real time observation of Tpm1.8 assembly and disassembly on actin filaments by TIRF microscopy. (A) Microfluidics and TIRF setup. (B) Schematic of the steps leading to decoration of an actin filament with tropomyosin: (1) A tropomyosin molecule (red) binds to a random site on one of the two strands on a naked actin filament attached to the surface via spectrin-actin seeds (green). (2) Domain elongation: tropomyosin molecules then bind at adjacent sites and form head-to-tail overlap complexes with the already bound tropomyosin molecule to extend the domain toward both the pointed and barbed ends of the actin filament. (3) Domain appearance and elongation occurs on both strands of the actin filament, as shown by a second (blue) tropomyosin strand. (4) Finally, the double helical actin filament is coated by two tropomyosin chains. The process of dissociation occurs by reversing the process, whereby tropomyosin can dissociate from either of the two ends of the tropomyosin strands located on both strands. (C) Kymographs and snapshots from a time-lapse series of a single actin filament showing Tpm1.8 association (top) and dissociation (bottom) after injection and wash-out of mNeonGreen-Tpm1.8, respectively. The two levels of fluorescence intensity correspond to Tpm1.8 domains on either one or both actin strands. Orange arrow heads: nucleation points during association and points where dissociation starts after mNeonGreen-Tpm1.8 wash-out. Arrows indicate the slopes used to measure the elongation rate toward either end.
FIGURE 2:
FIGURE 2:
Tpm 1.8 domains grow and shrink faster at the domain edge directed towards the barbed end than the pointed end of the actin filament. (A) Tpm1.8 concentration dependence of domain elongation rates toward the barbed and pointed ends of the actin filament. The solid lines represent linear fits of the data, whereby the y-axis intercept of each fit line gives the shrinkage rate for the respective end, the x-axis intercept gives the critical concentration and the slope gives the elongation rate constant. Points represent the mean and error bars represent the standard deviation; N (number of filaments [slopes measured towards pointed/barbed end]) = 11 [2/13] (3 nM); 20 [35/66] (4 nM); 40 [73/116] (5 nM); 48 [109/121] (6 nM); 52 [99/110] (7 nM); 38 [73/90] (8 nM); 58 [148/178] (10 nM). (B) Comparison of shrinkage rates of Tpm1.8 at the two edges of a Tpm1.8 domain. The values for the shrinkage rates obtained from y-axis intercepts in (A) are represented by dotted lines. N (number of slopes) = 78 (pointed end), 111 (barbed end); p = 6.6E-14, unpaired Student’s t-test, after Welch’s correction. (C) Schematic of the binding of tropomyosin molecules to either end of an existing domain on an actin filament with corresponding potential energy diagrams of the reaction. N, N-terminal end; C, C-terminal end; Ea, activation energy.
FIGURE 3:
FIGURE 3:
Tpm1.8 kinetics are unaffected by the presence of a Tpm1.8 domain on the opposite strand of the actin filament. (A) Plots of tropomyosin domain elongation kinetics toward the barbed and pointed ends of the actin filament as a function of Tpm1.8 concentration, with the data for both strands of the actin filament separated. The lines represent linear fits to the data. Data for pointed end/1st strand, N (number of slopes) = 25 (4 nM), 45 (5 nM), 63 (6 nM), 57 (7 nM), 46 (8 nM), 79 (10 nM); pointed end/2nd strand, N = 8 (4 nM), 16 (5 nM), 38 (6 nM), 35 (7 nM), 16 (8 nM), 49 (10 nM); barbed end/1st strand, N = 38 (4 nM), 71 (5 nM), 73 (6 nM), 72 (7 nM), 58 (8 nM), 89 (10 nM); barbed end/2nd strand, N = 18 (4 nM), 23 (5 nM), 32 (6 nM), 23 (7 nM), 15 (8 nM), 59 (10 nM). (B) Comparison of shrinkage kinetics of Tpm1.8 toward the two edges of a Tpm1.8 domain, with the data for both strands of the actin filament separated. The values for the dissociation rates obtained from y-axis intercepts in (A) are represented by dotted lines. N (number of slopes) = 16 (pointed end, 1st strand), 46 (pointed end, 2nd strand), 20 (barbed end, 1st strand), 82 (barbed end, 2nd strand); p = 1.34E-12 (pointed end versus barbed end) and p = 0.89 (1st strand versus 2nd strand) using two way ANOVA (Tukey test). (C) Frequency of the second Tpm1.8 domain nucleating opposite the already decorated region of the actin filament observed in 198 kymographs (“Observed”). To test for cooperativity of nucleation, this observed frequency of spatial coincidence is compared to the probability of spatial coincidence that is expected when the second domain nucleates at a random location in the undecorated region of the actin filament (“Expected”); one-tailed t-test (p = 0.26).
FIGURE 4:
FIGURE 4:
Single-molecule kinetics of Tpm1.8 on naked actin filaments and at the edges of diffraction-limited domains. (A) Assembly of mNeonGreen-Tpm1.8 on unlabelled actin filaments attached non-specifically to the surface. (i) TIRF image of actin filaments after complete decoration with mNeonGreen-Tpm1.8 (endpoint of the assembly process). (ii) TIRF image of actin filaments (unlabelled) with short mNeonGreen-Tpm1.8 domains that appeared shortly after injection of mNeonGreen-Tpm1.8 at a concentration of 3 nM. (B) Time-lapse images showing nucleation and growth of a diffraction-limited mNeonGreen-Tpm1.8 domain on an unlabelled actin filament. (C) Intensity trace of the mNeonGreen-Tpm1.8 segment shown in (B) recorded with an imaging frequency of 2 Hz with step fit (blue line) to identify times of addition/dissociation of Tpm1.8 molecules on the domain undergoing net elongation. (D) Combined rate constant for binding at both domain edges (RBP) determined from step fitting of intensity traces of individual segments. The same rate constant determined from kymographs is shown for comparison. N (number of positive step times) = 13504 (3 nM), 15002 (4 nM), 14895 (5 nM). Errors represent the 95% CI of the residual of the fits (E) Distribution of mNeonGreen-Tpm1.8 intensity (green, determined by the intensity of molecules sparsely adhered to a clean glass surface) overlayed with intensity distributions of the first positive step (purple, binding of a mNeonGreen- Tpm1.8 molecule to a stretch of naked actin filament), all positive steps (red; binding events) and negative steps (blue; dissociation events) obtained from the step fitting of intensity traces of individual mNeonGreen-Tpm1.8 domains. N (number of events) = 12364 (single mNeonGreen-Tpm1.8 photobleaching), 4767 (first steps), 48168 (positive steps), 44641 (negative steps). (F) Estimated release rate (RI) for an isolated mNeonGreen-Tpm1.8 molecule that binds to the actin filament (see Supplementary Figure 6 for details). N (number of single molecule events) = 9213 (4 nM), 15850 (5 nM).
FIGURE 5:
FIGURE 5:
Analysis of domain appearance. (A) A simplified model of the growth pathway for a newly formed domain. Single (isolated) Tpm molecules bound to actin are in state 1. Single molecules that dissociate move to the 0 state at the release rate, RI. Alternatively, a second molecule may bind to the isolated Tpm (1), moving it to state 2. Addition of Tpm to states containing one or more molecules is governed by the elongation rate (cBBPRPB, where c is the Tpm concentration, BBP and RPB are the rate constants for binding and release at both edges of the domain). The probability of each reaction is given by dividing each rate by the sum of the rates of reactions out of the relevant state. (B) Plot of the probability of domain appearance as a function of concentration calculated using the model in (A). The inset shows the low concentration regime of the curve. (C) Domain appearance rate measured experimentally (red dots) from single filaments kymographs (Supplementary Figure 7), and fitted with the nucleation model (blue curve) with the rate constant (BI) for binding of an isolated Tpm to the naked actin filament as the only free parameter, yielding a value of BI = 455 nm–1 M–1 s–1.
FIGURE 6:
FIGURE 6:
Simulated kymographs of Tpm1.8 assembly on actin filaments obtained with a kinetic model reproduce the features of kymographs from experiments. (A) Schematic representation of the model for tropomyosin kinetics on actin filaments. All binding (and dissociation) processes occur by the addition of single Tpm1.8 molecules (shown in red). (B) Comparison of experimental and simulated kymographs at a range of Tpm1.8 concentrations. The lengths of filaments from the experiment are 8.449, 8.608, 9.591 and 9.619 µm for 4, 6, 8 and 10 nM Tpm1.8, respectively. The time of acquisition is 55.84, 39.87, 23.34 and 20 min for 4, 6, 8 and 10 nM Tpm1.8, respectively. The simulated kymographs are 8 µm in length. Kymographs are representative of the types of kymographs randomly generated by the simulation.

Similar articles

Cited by

References

    1. Appaduray MA, Masedunskas A, Bryce NS, Lucas CA, Warren SC, Timpson P, Stear JH, Gunning PW, Hardeman EC (2016). Recruitment kinetics of tropomyosin Tpm3.1 to actin filament bundles in the cytoskeleton is independent of actin filament kinetics. PLoS One , e0168203. - PMC - PubMed
    1. Brayford S, Bryce NS, Schevzov G, Haynes EM, Bear JE, Hardeman EC, Gunning PW (2016). Tropomyosin promotes lamellipodial persistence by collaborating with Arp2/3 at the leading edge. Curr Biol , 1312–1318. - PMC - PubMed
    1. Brooker HR, Geeves MA, Mulvihill DP (2016). Analysis of biophysical and functional consequences of tropomyosin-fluorescent protein fusions. FEBS Lett , 3111–3121. - PMC - PubMed
    1. Bryce NS, Schevzov G, Ferguson V, Percival JM, Lin JJ-C, Matsumura F, Bamburg JR, Jeffrey PL, Hardeman EC, Gunning P, Weinberger RP (2003). Specification of actin filament function and molecular composition by tropomyosin isoforms. Mol Biol Cell , 1002–1016. - PMC - PubMed
    1. Carlier M-F, Romet-Lemonne G, Jégou A (2014). Actin filament dynamics using microfluidics. Methods Enzymol 3–17. - PubMed

Publication types

LinkOut - more resources