. 2020 Oct 15;31(22):2425-2436.
doi: 10.1091/mbc.E19-08-0439-T. Epub 2020 Aug 26.

XK is a partner for VPS13A: a molecular link between Chorea-Acanthocytosis and McLeod Syndrome

Affiliations

XK is a partner for VPS13A: a molecular link between Chorea-Acanthocytosis and McLeod Syndrome

Jae-Sook Park et al. Mol Biol Cell. .

Abstract

Vps13 is a highly conserved lipid transfer protein found at multiple interorganelle membrane contact sites where it mediates distinct processes. In yeast, recruitment of Vps13 to different contact sites occurs via various partner proteins. In humans, four VPS13 family members, A-D, are associated with different diseases. In particular, vps13A mutants result in the neurodegenerative disorder Chorea-Acanthocytosis (ChAc). ChAc phenotypes resemble those of McLeod Syndrome, caused by mutations in the XK gene, suggesting that XK could be a partner protein for VPS13A. XK does, in fact, exhibit hallmarks of a VPS13A partner: it forms a complex with VPS13A in human cells and, when overexpressed, relocalizes VPS13A from lipid droplets to subdomains of the endoplasmic reticulum. Introduction of two different ChAc disease-linked missense mutations into VPS13A prevents this XK-induced relocalization. These results suggest that dysregulation of a VPS13A-XK complex is the common basis for ChAc and McLeod Syndrome.


Figures
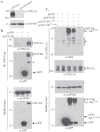
FIGURE 1:
FIGURE 1:
Coimmunoprecipitation of VPS13A and XK. (A) Lysates from human HAP1 cells containing either VPS13A or a 197 nucleotide deletion within exon 11 of VPS13A, vps13A-∆e11–– were probed with either α-VPS13A antibodies or α-GAPDH antibodies as a loading control. (B) Lysates from untransfected HeLa cells or cells transfected with plasmids expressing GFP (pEGFP-C1) or GFP-XK (pcDNA3.1(+)-N-eGFP-XK). (Top panels) GFP-Trap was used to precipitate GFP containing proteins and the precipitates were probed with either α-VPS13A or α-GFP antibodies. The asterisk indicates a likely GFP-XK degradation product. (Bottom panels) Soluble lysates before immunoprecipitation were examined by Western blot using α-GAPDH or α-GFP antibodies. (C) Lysates from untransfected HeLa cells or cells transfected with plasmids expressing GFP (pEGFP-C1), GFP-XK (pcDNA3.1(+)-N-eGFP-XK), GFP-XK1-370 (pJS135), or GFP-XK371-444 (pJS129). (Top panels) VPS13A immunoprecipitates using α-VPS13A probed with either α-GFP or α-VPS13A antibodies. The asterisk marks the position of likely GFP-XK degradation products and background bands. (Bottom panels) The soluble lysates before immunoprecipitation were examined by Western blot using α-GAPDH or α-GFP antibodies.
FIGURE 2:
FIGURE 2:
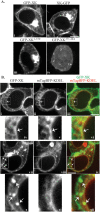
Localization of GFP-XK. (A) HEK293T cells were transfected with plasmids expressing GFP-XK (pcDNA3.1(+)-N-eGFP-XK), XK-GFP (pJS136), GFP-XK1-370 (pJS135), or GFP-XK371-444 (pJS129) and examined by fluorescence microscopy. (B) HEK293T cells were transfected with plasmids expressing GFP-XK (pcDNA3.1(+)-N-eGFP-XK) and the ER marker mTagBFP-KDEL (pEFIRES-mTagBFP-KDEL). Panels i–vi show a representative cell where GFP-XK displays a reticular pattern overlapping with the ER marker. Panels iv–vi are higher magnification views of the boxed areas in panels i–iii, respectively. The arrow indicates a region where the GFP-XK signal colocalizes with ER marker. Panels vii–xii show a representative cell where GFP-XK displays a punctate pattern. Panels x–xii are higher magnification views of the boxed areas in panels vii–ix, respectively. The arrows highlight examples of GFP-XK foci that lack corresponding foci of ER signal. Scale bars = 10 μm.
FIGURE 3:
FIGURE 3:
VPS13A^mCherry localizes to lipid droplets and the ER. (A) HEK293T cells transfected with a plasmid expressing VPS13A^mCherry (pVPS13A^mCherry) and stained with the lipid droplet marker BODIPY 493/503. (B) HEK293T cells transfected with plasmids expressing VPS13A^mCherry and ER marker mTagBFP-KDEL display a partial colocalization of VPS13A^mCherry and ER marker. Dashed lines indicate the cell outlines. Insets show higher magnification views of the boxed regions. Scale bars = 10 μm.
FIGURE 4:
FIGURE 4:
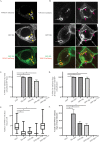
Colocalization of GFP-XK and VPS13A^mCherry in human cells. HEK293T cells were transfected with plasmids expressing VPS13A^mCherry and various versions of GFP-XK as indicated. (A) Representative cell showing colocalization of GFP-XK and VPS13A^mCherry in cytoplasmic foci (yellow arrows). Scale bar = 10 μm. (B) Representative cell showing GFP-XK and VPS13A^mCherry colocalization in ringlike structures (white arrows) and linear elements (pink arrows). (C) Quantification of VPS13A^mCherry colocalization in foci containing various GFP-XK proteins. Data are the average of at least three experiments with more than 25 foci scored in each experiment. Asterisks indicate p value < 0.00002 by unpaired t test. In graphs C–F, error bars represent one SD. (D) Quantification of VPS13A^mCherry/GFP-XK colocalization in rings and linear elements. Data are the average of three or more experiments with at least 20 cells scored in each experiment and at least 20 total rings or linear elements scored for the XK-GFP, GFP-XK, and GFP-XK1-370 constructs. *p < 0.0001 by one-way ANOVA with Dunnett’s test. (E) The number of VPS13A^mCherry foci per cell in cells coexpressing either GFP alone or the indicated GFP-XK fusions. Data are the average of at least three experiments with more than 25 foci scored for each construct in each experiment. At least 101 total foci scored for each construct. Horizontal lines indicate median values, boxes represent three quartiles, and whiskers indicate the range of values. *p < 0.0001 by unpaired t test. (F) The fraction of cells displaying rings or lines of VPS13A^mCherry fluorescence when coexpressing different GFP constructs. The fraction of cells displaying at least one ring or linear element is shown. Values are averages of three independent experiments with at least 19 cells scored per experiment. *p < 0.0005, unpaired t test
FIGURE 5:
FIGURE 5:
VPS13A^mCherry localization to lipid droplets is altered by GFP-XK expression. HEK293T cells were transfected with VPS13A^mCherry (pVPS13A^mCherry) without (left panels) or with (right panels) mTagBFP-XK (pJS143-E6) and stained with the lipid droplet dye BODIPY 493/503. Yellow arrows highlight examples of VPS13A^mCherry foci and pink arrows highlight examples of lipid droplets stained with BODIPY Green. Numbers below indicate the percentage of VPS13A^mCherry foci overlapped with the lipid droplet marker ± range. Data are the average of two independent experiments. In the absence of GFP-XK 255 foci were scored, while 96 foci were scored for cells containing GFP-XK. Scale bars = 10 μm. For illustration purposes, the cells shown have a greater than average number of VPS13A^mCherry foci (Figure 4).
FIGURE 6:
FIGURE 6:
VPS13A^mCherry and GFP-XK colocalize at the ER and mitochondria. HEK293T cells cotransfected with VPS13A^mCherry and GFP-XK or mTagBFP-XK were either stained with the lipid droplet marker BODIPY 493/503 or cotransfected with an additional plasmid expressing an ER marker (pEFIRES-mTagBFP-KDEL) or a mitochondrial marker (mito-BFP). (A) Representative cell showing the localization of a VPS13A^mCherry/mTagBFP-XK focus (yellow arrow) relative to a lipid droplet. (B) Representative cell showing the localization of a VPS13A^mCherry/GFP-XK focus (yellow arrow) relative to the ER. (C) Representative cell showing the localization of a VPS13A^mCherry/GFP-XK focus (yellow arrow) relative to the mitochondrial marker. Scale bars = 10 μm.
FIGURE 7:
FIGURE 7:
The disease mutation W2460R alters VPS13A^mCherry localization (A) Lysates of untransfected HEK293T cells, or cells transfected with single plasmids expressing VPS13A^mCherry (pVPS13A^mCherry) or GFP-XK (pcDNA3.1(+)-N-eGFP-XK), or two plasmids expressing wild-type VPS13A^mCherry or VPS13AW2460R^mCherry (pJS141-E4) with GFP-XK were analyzed by co-IP using polyclonal anti-XK antibodies and Western blot using anti-VPS13A antibodies, anti-XK antibodies, or anti-GAPDH antibodies as a loading control. (B) Localization of VPS13AW2460R^mCherry was examined in HEK293T cells cotransfected with plasmids expressing VPS13AW2460R^mCherry (pJS141-E4) and the ER marker mTagBFP-KDEL (pEFIRES-mTagBFP-KDEL). (C) VPS13AW2460R^mCherry localization was examined in HEK293T cells stained with the lipid droplet dye BODIPY 493/503. (D) Distribution of VPS13AW2460R^mCherry in cells cotransfected with plasmids expressing VPS13AW2460R^mCherry (pJS141-E4) and GFP-XK (pcDNA3.1(+)-N-eGFP-XK). (E) Distribution of VPS13AI90K^mCherry in cells cotransfected with VPS13AI90K^mCherry (pJS144-B2) and GFP-XK (pcDNA3.1(+)-N-eGFP-XK). Arrows in D and E indicate rings of GFP-XK in the ER. Scale bars = 10 μm.

Similar articles

Cited by

References

    1. Bankaitis VA, Johnson LM, Emr SD (1986). Isolation of yeast mutants defective in protein targeting to the vacuole. Proc Nat Acad Sci USA , 9075–9079. - PMC - PubMed
    1. Bean BDM, Dziurdzik SK, Kolehmainen KL, Fowler CMS, Kwong WK, Grad LI, Davey M, Schluter C, Conibear E (2018). Competitive organelle-specific adaptors recruit Vps13 to membrane contact sites. J Cell Biol , 3593–3607. - PMC - PubMed
    1. Brickner JH, Fuller RS (1997). SOI1 encodes a novel, conserved protein that promotes TGN-endosomal cycling of Kex2p and other membrane proteins by modulating the function of two TGN localization signals. J Cell Biol , 23–36. - PMC - PubMed
    1. Dobson-Stone C, Danek A, Rampoldi L, Hardie RJ, Chalmers RM, Wood NW, Bohlega S, Dotti MT, Federico A, Shizuka M, et al (2002). Mutational spectrum of the CHAC gene in patients with chorea-acanthocytosis. Eur J Hum Genet , 773–781. - PubMed
    1. Friedman JR, Lackner LL, West M, DiBenedetto JR, Nunnari J, Voeltz GK (2011). ER tubules mark sites of mitochondrial division. Science , 358–362. - PMC - PubMed

Publication types

MeSH terms

Substances

Supplementary concepts