. 2020 Oct 15;31(22):2437-2451.
doi: 10.1091/mbc.E20-06-0415. Epub 2020 Aug 26.

NuMA interaction with chromatin is vital for proper chromosome decondensation at the mitotic exit

Affiliations

NuMA interaction with chromatin is vital for proper chromosome decondensation at the mitotic exit

Ashwathi Rajeevan et al. Mol Biol Cell. .

Abstract

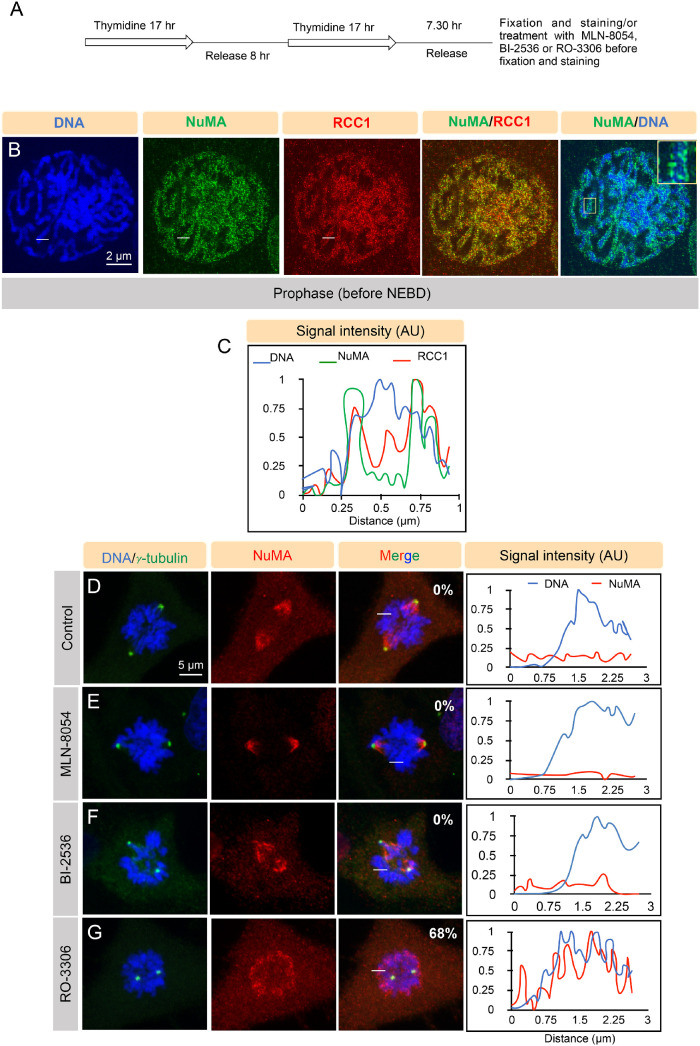
NuMA is an abundant long coiled-coil protein that plays a prominent role in spindle organization during mitosis. In interphase, NuMA is localized to the nucleus and hypothesized to control gene expression and chromatin organization. However, because of the prominent mitotic phenotype upon NuMA loss, its precise function in the interphase nucleus remains elusive. Here, we report that NuMA is associated with chromatin in interphase and prophase but released upon nuclear envelope breakdown (NEBD) by the action of Cdk1. We uncover that NuMA directly interacts with DNA via evolutionarily conserved sequences in its C-terminus. Notably, the expression of the DNA-binding-deficient mutant of NuMA affects chromatin decondensation at the mitotic exit, and nuclear shape in interphase. We show that the nuclear shape defects observed upon mutant NuMA expression are due to its potential to polymerize into higher-order fibrillar structures. Overall, this work establishes the spindle-independent function of NuMA in choreographing proper chromatin decompaction and nuclear shape by directly associating with the DNA.


Figures

FIGURE 1:
FIGURE 1:
NuMA is transiently associated with chromatin in the interphase nucleus. (A) Domain organization of NuMA with mono-FLAG (FL) and AcGFP-tag at the N-terminus (referred to as AcGFP-NuMA). The coiled-coil domain, the region mediating interaction with microtubules (MTs), and the nuclear localization signal (NLS) are shown. (B) Immunoblot analysis of protein extracts prepared from the mitotically synchronized HeLa Kyoto cells, which are transfected with scrambled siRNAs (Control), siRNAs against NuMA 3′-UTR for 72 h, or left untreated and stably expressing AcGFP-NuMA. Extracts were probed with antibodies against NuMA and β-actin. Transgenic AcGFP-NuMA protein is shown by a blue asterisk that is migrating above the endogenous protein. The values below the NuMA immunoblot represent the band intensity with respect to the intensity value from the control sample, which was kept as 1. The molecular mass is indicated in kilodaltons (kDa). (C–I) FRAP analysis of HeLa Kyoto cells that are stably expressing AcGFP-NuMA (C, F), transiently transfected with AcGFP-NuMA(1–2057) (D, G) or AcGFP-NuMA(1–2115m) (E, H) and are depleted for endogenous NuMA. The GFP signal is shown in green, and the time is indicated in seconds (s). The unbleached and bleached regions of the cell are shown by yellow and white circles, respectively. The GFP recovery profile of the bleached area corrected for photobleaching is plotted for 80 s for all three conditions. Note the half-time of recovery (t1/2) of cells expressing AcGFP-NuMA is ∼13 s, which is remarkably slow in comparison with AcGFP-tagged NLS (nuclear localization signal) -expressing cells (t1/2 = ∼1.5 s) (I). Analogous t1/2 value (∼12.2 s) was obtained in cells which are transiently transfected with AcGFP-NuMA (unpublished data). Also, note that rapid recovery profile in cells expressing AcGFP-NuMA(1–2057) (t1/2 = ∼3.6 s) or AcGFP-NuMA(1–2115m) (t1/2 = ∼4.2 s) in comparison to that of AcGFP-NuMA (I). Statistical significance is calculated by two-tailed Student’s t test (n > 10 for all; error bars: SD for F–H and SEM for I).
FIGURE 2:
FIGURE 2:
Cdk1 activity is critical for releasing NuMA from chromatin upon mitotic entry. (A) hTERT-RPE1 cell synchronization scheme for enriching cells in the prophase following double-thymidine release. Cells were fixed after 7.30 h of double-thymidine release for obtaining a maximum number of cells in prophase. Cells were treated with DMSO (Control), Aurora A inhibitor MLN-8054 (250 nM for 1 h), Plk1 inhibitor BI-2536 (300 nM for 30 min), or Cdk1 inhibitor RO-3306 (20 µM for 10 min) before fixation. (B) Higher-resolution images of prophase synchronized hTERT-RPE1 cells immunostained for NuMA (green) and RanGEF RCC1 (red). DNA is visualized in blue (see Materials and Methods). Inset on the upper right on the merge between NuMA and DNA shows that NuMA enriches at the periphery of condensed chromatin in prophase cells. (C) Line-scan plot of DNA (in blue), NuMA (in green), and RCC1 (in red) was created using an area shown as a white line in panel B. Similarly for the other figures, a white line on the images represents the area that was utilized to make a line-scan plot. (D–G) hTERT-RPE1 cells synchronized in prophase, as indicated in panel A, are treated either with DMSO control (D), MLN-8054 (E), BI-2536 (F), or RO-3306 (G). After fixation, these cells are stained for NuMA (red) and γ-tubulin (green). The percentage of cells showing chromosomal retention of NuMA signal in cells treated with the various inhibitors is indicated on the corresponding images in the merge panel. Line-scan plots on the right represent the DNA and NuMA intensity for an area that is represented by the white line under various conditions. Note the retention of NuMA on chromatin in prometaphase cells that were treated with Cdk1 inhibitor RO-3306 compared with the control cells. Also, check Supplemental Figure S3 for control experiments (n > 20 cells in each condition and experiments were repeated four times).
FIGURE 3:
FIGURE 3:
NuMA interacts with the DNA with the evolutionarily conserved region present in its C-terminus. (A) Schematic representation of GFP-tagged NuMA constructs used for the experiments that are shown on the right; the regions mediating interaction with microtubules (MTs), and the nuclear localization signal (NLS) are represented. (B–F) Images from the 4D time-lapse confocal microscopy of HeLa cells stably expressing mCherry-H2B and transiently transfected with GFP-NuMA(1411–2115) (B), GFP-NuMA(1700–2115) (C), GFP-NuMA(1760–2115) (D), GFP-NuMA(1991–2115) (E), or GFP-NuMA(2058–2115) (F). The GFP signal is shown in green. Time is indicated in minutes with t = 0 corresponding to the last frame of metaphase before the onset of chromosome segregation. Note the enrichment of GFP signal on the metaphase chromosome for cells expressing GFP-NuMA(1760–2115), GFP-NuMA(1991–2115), and GFP-NuMA(2058–2115). (G) Chromosomal intensity quantification scheme of a metaphase cell; black boxes indicate the area used for the quantification of the signal intensity. The ratio of the chromosomal to cytoplasmic GFP-signal intensity is plotted over time for GFP-NuMA(1411–2115) and GFP-NuMA(2058–2115). p < 0.0001 between GFP-NuMA(1411–2115) and GFP-NuMA(2058–2115) for all the time points studied. Statistical significance is calculated by two-tailed Student’s t test (n = 10 cells for all cases; error bars: SD). (H, I) Images from the 4D-time-lapse confocal microscopy of HeLa cells in prophase before nuclear envelope breakdown (NEBD) that are stably expressing mCherry-H2B and transiently transfected with GFP-NuMA(1411–2115) (H) or GFP-NuMA(1411–2057) (I). Note that the GFP signal is homogeneously distributed in the nucleus in GFP-NuMA(1411–2057) expressing cells in comparison to the cells expressing GFP-NuMA(1411–2115) where the signal is localized to chromatin. Line-scan plot is shown on the right. (J) Sequence alignments of NuMA DNA-binding region (2058–2115) with NuMA orthologues (Homo sapiens NM_006185.2, Mus musculus NP_598708.3, Gallus gallus NP_001177854.1, Xenopus laevis NP_001081559.1). The basic amino acids (arginine and lysine residues) are highlighted in red. Note that the majority of basic amino acids are conserved across these species. (K) Schematic representation of AcGFP-tagged full-length NuMA (AcGFP-NuMA) or NuMA that is either deleted (AcGFP-NuMA(1–2057)) or mutated (AcGFP-NuMA(1–2115m)) for the last 58 aa. The coiled-coil domain, the region mediating interaction with microtubules (MTs), and the nuclear localization signal (NLS) are shown. (L, M) Gel mobility shift assay of pUC19 plasmid (400 ng) that is incubated with the indicated concentration of E. coli–generated recombinant proteins against bacterial histone-like protein HU, hexahistidine-NuMA N-ter (indicated as NuMA N-ter), and hexahistidine-NuMA(2058–2115) (indicated as NuMA(2058–2115)) (L). Or with HU, NuMA N-ter, hexahistidine-NuMA(1877–2115) (indicated as NuMA(1877–2115)), and hexahistidine-NuMA(1877–2057) (indicated as NuMA(1877–2057)) (M). Yellow arrowheads indicate the retardation of pUC19 plasmid DNA upon the increasing concentration of NuMA(2058–2115) and NuMA(1877–2115), but not with NuMA(1877–2057) missing the last 58 aa.
FIGURE 4:
FIGURE 4:
NuMA–DNA interaction is vital for DNA decompaction and proper nuclear architecture. (A–C) Images from the 4D-time-lapse confocal microscopy of HeLa cells stably expressing mCherry-H2B and depleted of endogenous NuMA by RNAi using siRNAs sequences targeting 3′UTR of NuMA (see the depletion efficiency of siRNAs in Figure 1B). These cells, as indicated, are transfected with AcGFP-NuMA (A), AcGFP-NuMA(1–2057) (B), or AcGFP-NuMA(1–2115m) (C). The GFP signal is shown in green, and the mCherry signal is in red. Time is indicated in minutes (min), time “0” min being the last frame of metaphase before the onset of chromosome segregation (also see corresponding Supplemental Movies S4–S6). (D) Schematic representation for the measurement of the chromosomal volume ([v] in µm3) for the cells shown in A–C for 39 min post anaphase onset and their quantification. Note the significantly reduced chromosomal volume of cells expressing AcGFP-NuMA(1–2057) and AcGFP-NuMA(1–2115m) when compared with AcGFP-NuMA from 27 min onward (p < 0.05 from t = 27 min until t = 39 min for all data points between cells expressing AcGFP-NuMA and AcGFP-NuMA(1–2057) or AcGFP-NuMA(1–2115m)). Statistical significance is calculated by two-tailed Student’s t test (n ≥ 8 cells; error bars: SD). (E, F) Images from the 4D-time-lapse confocal microscopy of HeLa Kyoto cells stably expressing mCherry-LaminB1 and depleted of endogenous NuMA by RNAi using siRNAs sequences targeting 3′UTR of NuMA. These cells, as indicated, are transfected with either AcGFP-NuMA (E) or AcGFP-NuMA(1–2057) (F). The GFP signal is shown in green and the mCherry signal in red. Time is indicated in hours (h), time “0” being the last frame of metaphase before the onset of chromosomes segregation. The images and the quantification for the nuclear volume (in panel H) were started at time 0.5 h post anaphase onset, when mCherry-LaminB1 significantly decorated the nuclear envelope after nuclear envelope reformation. (G) 3D surface reconstruction of daughter nuclei shown in panels E and F. 3D rendering was performed in Imaris (https://imaris.oxinst.com/) using AcGFP signal. (H) Quantification of the nuclear volume (in µm3) for the cells shown in E and F (see Materials and Methods). Please note the significantly reduced nuclear volume for cells expressing AcGFP-NuMA(1–2057). p < 0.05 for t = 0.5 and 1.5 h, and p < 0.0001 for t = 2.5–4.5 h. Statistical significance is calculated by two-tailed Student’s t test (n ≥ 10; error bars: SD). (I–K) HeLa Kyoto cells in interphase are partly depleted of endogenous NuMA by RNAi using siRNAs sequences targeting 3′UTR of NuMA and transfected with AcGFP-NuMA (I) or AcGFP-NuMA(1–2057) (J, K). Cells were stained for GFP (green), and DNA is visualized in gray. Note the cells that express AcGFP-NuMA(1–2057) form puncta and fibrillar structure that are completely missing from cells expressing the wild-type form of NuMA (see also Supplemental Figure S5, A–E). Also, see the impact of AcGFP-NuMA(1–2057) expression on the nuclear shape. The percentage of cells showing puncta or fibrillar structure is indicated on the images. (L) Quantification of circularity (see Materials and Methods) of nuclei in cells expressing AcGFP-NuMA, or AcGFP-NuMA(1–2057) (n = 70 cells; error bars: SD).
FIGURE 5:
FIGURE 5:
NuMA lacking the DNA-binding potential assembles into higher-order structures in the nucleus. (A) Images from the 4D-time-lapse confocal microscopy of HeLa cells stably expressing mCherry-H2B and transfected with AcGFP-NuMA. Time is indicated in minutes (min). Quantification on the right represents the percentage of cells that show homogeneous distribution of NuMA while conducting ∼9 h of live recording (n = 20 cells). Also, see corresponding Supplemental Movie S7. (B–D) Images from the 4D-time-lapse confocal microscopy of HeLa cells stably expressing mCherry-H2B and transfected with AcGFP-NuMA(1–2057). The expression of AcGFP-NuMA(1–2057) leads to higher-order assemblies within the nucleus. These assemblies are categorized into three groups: homogeneous to puncta formation (B), homogeneous to the solid fibrillar network (C), or puncta to the solid fibrillar network (D). Quantification on the right represents the percentage of cells that are grouped into these categories while conducting 9 h of live imaging (n = 68 cells). Also, see corresponding Supplemental Movies S8–S10. (E) Images from the time-lapse recording of HeLa Kyoto cells stably expressing mCherry-LaminB1 and transfected with AcGFP-NuMA(1–2057). The expression of AcGFP-NuMA(1–2057) leads to solid fibrillar networks. Insets of the areas (i and ii) are shown on the right with the line-scan intensity of mCherry-LaminB1 and of AcGFP-NuMA(1–2057) signal at the dashed white line covering a portion of the nuclear envelope. Note the decrease in the mCherry-LaminB1 intensity at those regions where AcGFP-NuMA(1–2057)–based fibrillar networks are mechanically rupturing the nuclear envelope (n > 10 cells).
FIGURE 6:
FIGURE 6:
NuMA regulates DNA decondensation and nuclear shape via its ability to associate with chromatin. (A, B) Model for the NuMA function during mitotic exit (A) and in the interphase nuclei (B). In the control cells, wild-type NuMA interacts with chromatin during nuclear envelope reformation, and this allows proper chromatin decondensation in telophase/early G1 phase of the cell cycle. However, in cells that express DNA-binding–deficient mutant of NuMA, chromosomes mass in the newly formed daughter cells remains compact, and therefore the volume of the nucleus in the newly formed daughter cells remains significantly smaller (A). In the interphase this NuMA mutant exists in three different forms: homogeneous, puncta, and solid fibrillar network, and these higher-order assemblies, including puncta and solid fibrillar network, mechanically deform the nuclear architecture (B).

Similar articles

Cited by

References

    1. Abad PC, Lewis J, Mian IS, Knowles DW, Sturgis J, Badve S, Xie J, Lelievre SA (2007). NuMA influences higher order chromatin organization in human mammary epithelium. Mol Biol Cell , 348–361. - PMC - PubMed
    1. Antonin W, Neumann H (2016). Chromosome condensation and decondensation during mitosis. Curr Opin Cell Biol , 15–22. - PubMed
    1. Baarlink C, Plessner M, Sherrard A, Morita K, Misu S, Virant D, Kleinschnitz EM, Harniman R, Alibhai D, Baumeister S, et al. (2017). A transient pool of nuclear F-actin at mitotic exit controls chromatin organization. Nat Cell Biol , 1389–1399. - PubMed
    1. Batty P, Gerlich DW (2019). Mitotic chromosome mechanics: how cells segregate their genome. Trends Cell Biol , 717–726. - PubMed
    1. Chandramouly G, Abad PC, Knowles DW, Lelièvre SA (2007). The control of tissue architecture over nuclear organization is crucial for epithelial cell fate. J Cell Sci , 1596–1606. - PubMed

Publication types

MeSH terms