

Machine learning for a combined electroencephalographic anesthesia index to detect awareness under anesthesia
- PMID: 32845935
- PMCID: PMC7449480
- DOI: 10.1371/journal.pone.0238249
Machine learning for a combined electroencephalographic anesthesia index to detect awareness under anesthesia
Abstract
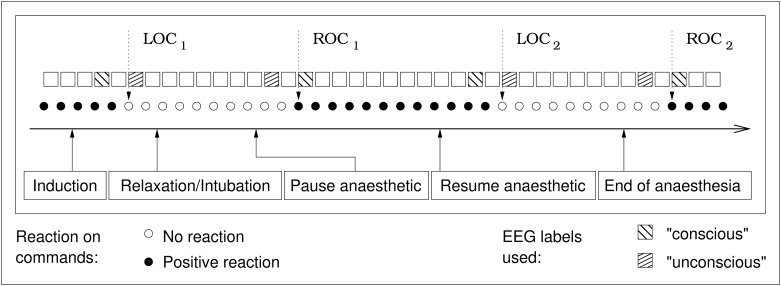
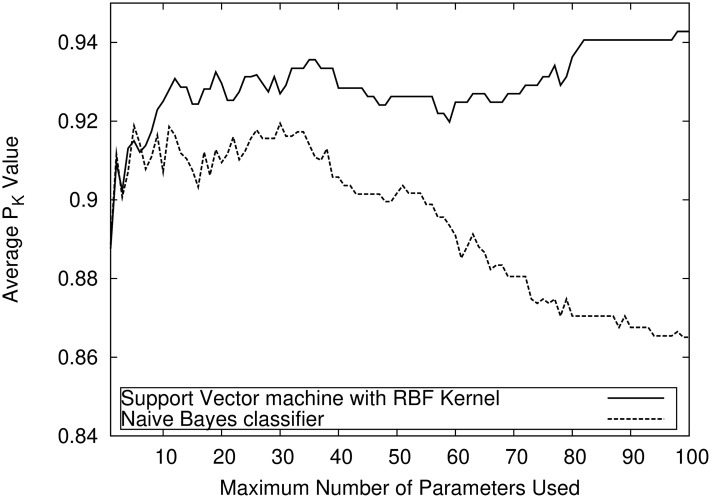
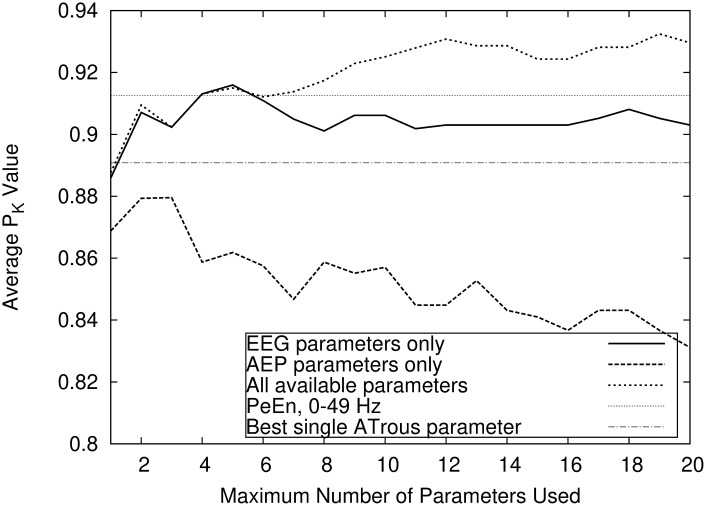
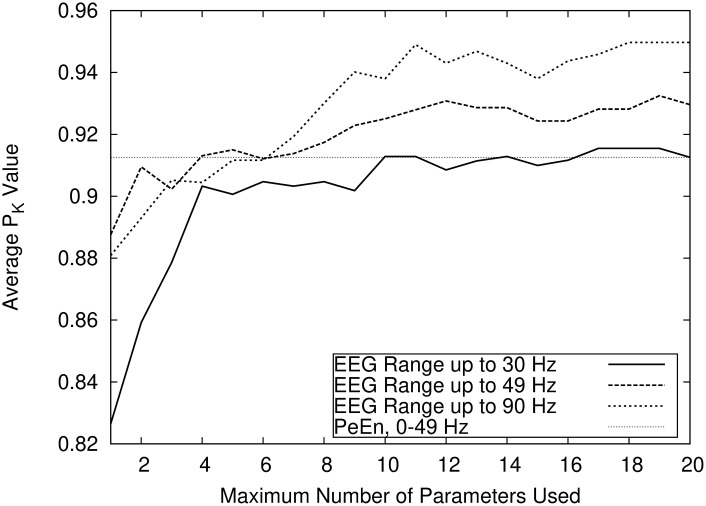
Spontaneous electroencephalogram (EEG) and auditory evoked potentials (AEP) have been suggested to monitor the level of consciousness during anesthesia. As both signals reflect different neuronal pathways, a combination of parameters from both signals may provide broader information about the brain status during anesthesia. Appropriate parameter selection and combination to a single index is crucial to take advantage of this potential. The field of machine learning offers algorithms for both parameter selection and combination. In this study, several established machine learning approaches including a method for the selection of suitable signal parameters and classification algorithms are applied to construct an index which predicts responsiveness in anesthetized patients. The present analysis considers several classification algorithms, among those support vector machines, artificial neural networks and Bayesian learning algorithms. On the basis of data from the transition between consciousness and unconsciousness, a combination of EEG and AEP signal parameters developed with automated methods provides a maximum prediction probability of 0.935, which is higher than 0.916 (for EEG parameters) and 0.880 (for AEP parameters) using a cross-validation approach. This suggests that machine learning techniques can successfully be applied to develop an improved combined EEG and AEP parameter to separate consciousness from unconsciousness.
Conflict of interest statement
The study was funded by a commercial source (B.Braun AG Melsungen). The research and publication process was not influenced. This does not alter our adherence to PLOS ONE policies on sharing data and materials. Eberhard Kochs is holding related patents (EP 12 718 076.8/US 14/114,719 Methods for consciousness and pain monitoring, module for analyzing EEG signals, and EEG anesthesia monitor; EP 11 178 111.8/US14/124,024 Method and sytem for quantifying anaesthesia or a state of vigilance); the specific procedures newly described in the manuscript are not used in any of those patents.
Figures
Similar articles
-
A combination of electroencephalogram and auditory evoked potentials separates different levels of anesthesia in volunteers.Anesth Analg. 2009 May;108(5):1512-21. doi: 10.1213/ane.0b013e3181a04d4c. Anesth Analg. 2009. PMID: 19372330 Clinical Trial.
-
Detection of consciousness by electroencephalogram and auditory evoked potentials.Anesthesiology. 2005 Nov;103(5):934-43. doi: 10.1097/00000542-200511000-00006. Anesthesiology. 2005. PMID: 16249666 Clinical Trial.
-
Analysis of the EEG bispectrum, auditory evoked potentials and the EEG power spectrum during repeated transitions from consciousness to unconsciousness.Br J Anaesth. 1998 Jan;80(1):46-52. doi: 10.1093/bja/80.1.46. Br J Anaesth. 1998. PMID: 9505777
-
Use of cerebral monitoring during anaesthesia: effect on recovery profile.Best Pract Res Clin Anaesthesiol. 2006 Mar;20(1):181-9. doi: 10.1016/j.bpa.2005.08.001. Best Pract Res Clin Anaesthesiol. 2006. PMID: 16634424 Review.
-
Auditory evoked potentials.Best Pract Res Clin Anaesthesiol. 2006 Mar;20(1):129-39. doi: 10.1016/j.bpa.2005.07.012. Best Pract Res Clin Anaesthesiol. 2006. PMID: 16634420 Review.
Cited by
-
Understanding basic principles of Artificial Intelligence: a practical guide for intensivists.Acta Biomed. 2022 Oct 26;93(5):e2022297. doi: 10.23750/abm.v93i5.13626. Acta Biomed. 2022. PMID: 36300214 Free PMC article.
-
Artificial intelligence and its clinical application in Anesthesiology: a systematic review.J Clin Monit Comput. 2024 Apr;38(2):247-259. doi: 10.1007/s10877-023-01088-0. Epub 2023 Oct 21. J Clin Monit Comput. 2024. PMID: 37864754 Free PMC article.
-
Support-vector classification of low-dose nitrous oxide administration with multi-channel EEG power spectra.J Clin Monit Comput. 2024 Apr;38(2):363-371. doi: 10.1007/s10877-023-01054-w. Epub 2023 Jul 13. J Clin Monit Comput. 2024. PMID: 37440117 Free PMC article.
-
Artificial intelligence and anesthesia: a narrative review.Ann Transl Med. 2022 May;10(9):528. doi: 10.21037/atm-21-7031. Ann Transl Med. 2022. PMID: 35928743 Free PMC article. Review.
-
Harnessing Artificial Intelligence (AI) in Anaesthesiology: Enhancing Patient Outcomes and Clinical Efficiency.Cureus. 2024 Nov 10;16(11):e73383. doi: 10.7759/cureus.73383. eCollection 2024 Nov. Cureus. 2024. PMID: 39659330 Free PMC article. Review.
References
-
- Bruhn J, Röpcke H, Hoeft A. Approximate entropy as an electroencephalographic measure of anesthetic drug effect during desflurane anesthesia. Anesthesiology: The Journal of the American Society of Anesthesiologists. 2000;92(3):715–726. - PubMed
-
- Ferenets R, Lipping T, Anier A, Jantti V, Melto S, Hovilehto S. Comparison of entropy and complexity measures for the assessment of depth of sedation. IEEE Transactions on Biomedical Engineering. 2006;53(6):1067–1077. - PubMed
-
- Gajraj R, Doi M, Mantzaridis H, Kenny G. Comparison of bispectral EEG analysis and auditory evoked potentials for monitoring depth of anaesthesia during propofol anaesthesia. British journal of anaesthesia. 1999;82(5):672–678. - PubMed
-
- Inouye T, Shinosaki K, Sakamoto H, Toi S, Ukai S, Iyama A, et al. Quantification of EEG irregularity by use of the entropy of the power spectrum. Electroencephalography and clinical neurophysiology. 1991;79(3):204–210. - PubMed
-
- Jordan C, Weller C, Thornton C, Newton D. Monitoring evoked potentials during surgery to assess the level of anaesthesia. Journal of medical engineering & technology. 1995;19(2-3):77–79. - PubMed
Publication types
MeSH terms
Substances
LinkOut - more resources
Full Text Sources
Research Materials
