. 2020 Dec 7;217(12):e20191561.
doi: 10.1084/jem.20191561.

A loss-of-function NUAK2 mutation in humans causes anencephaly due to impaired Hippo-YAP signaling

Affiliations

A loss-of-function NUAK2 mutation in humans causes anencephaly due to impaired Hippo-YAP signaling

Carine Bonnard et al. J Exp Med. .

Abstract

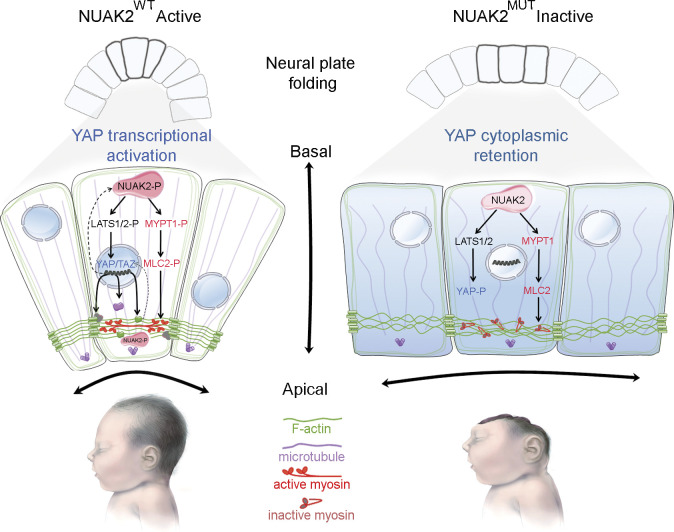
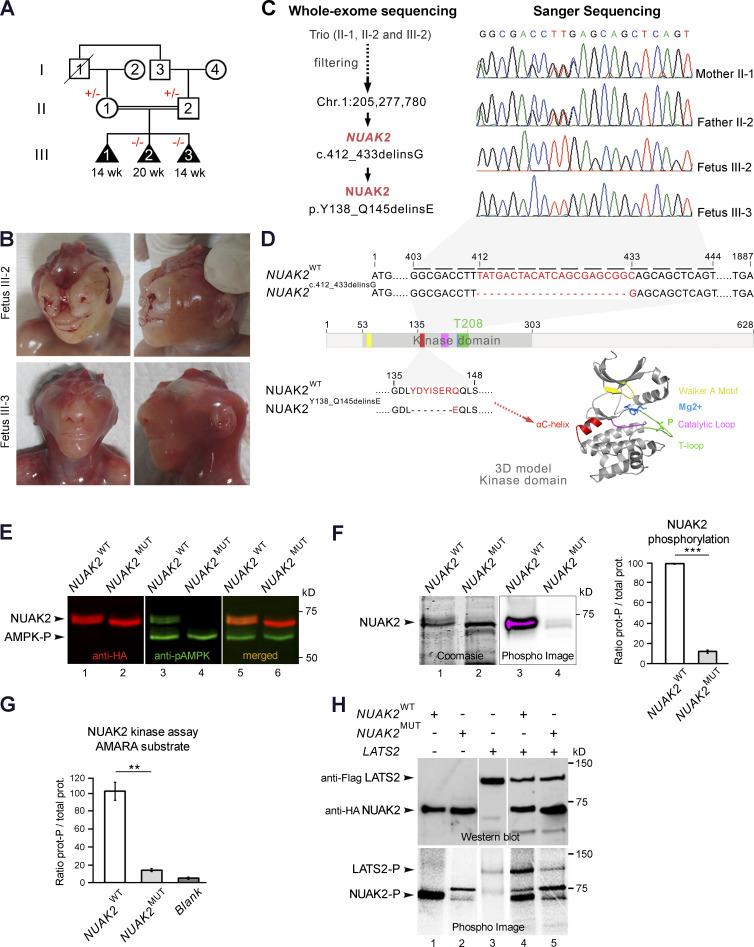
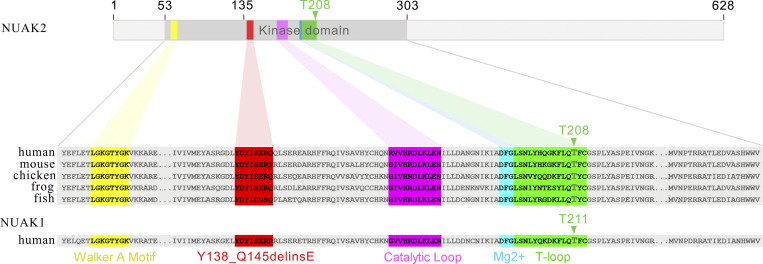
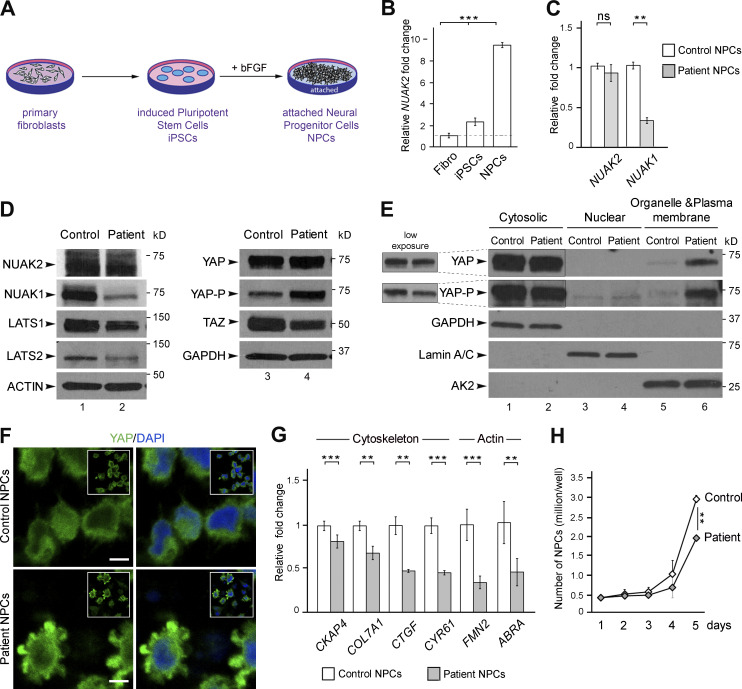
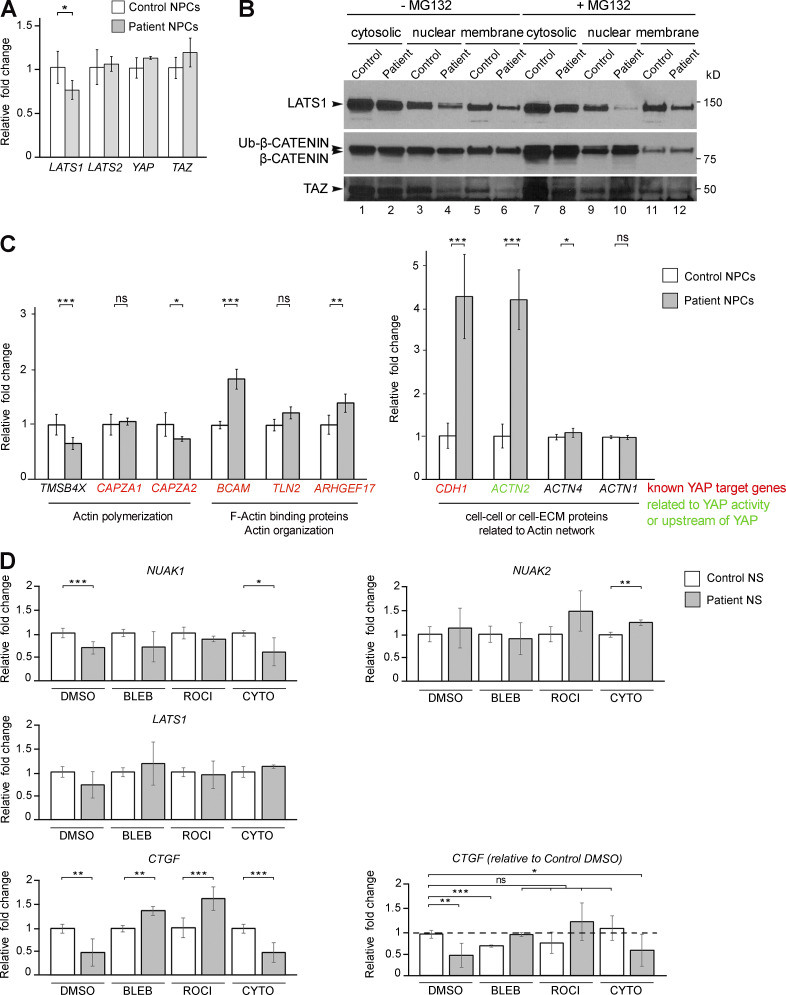
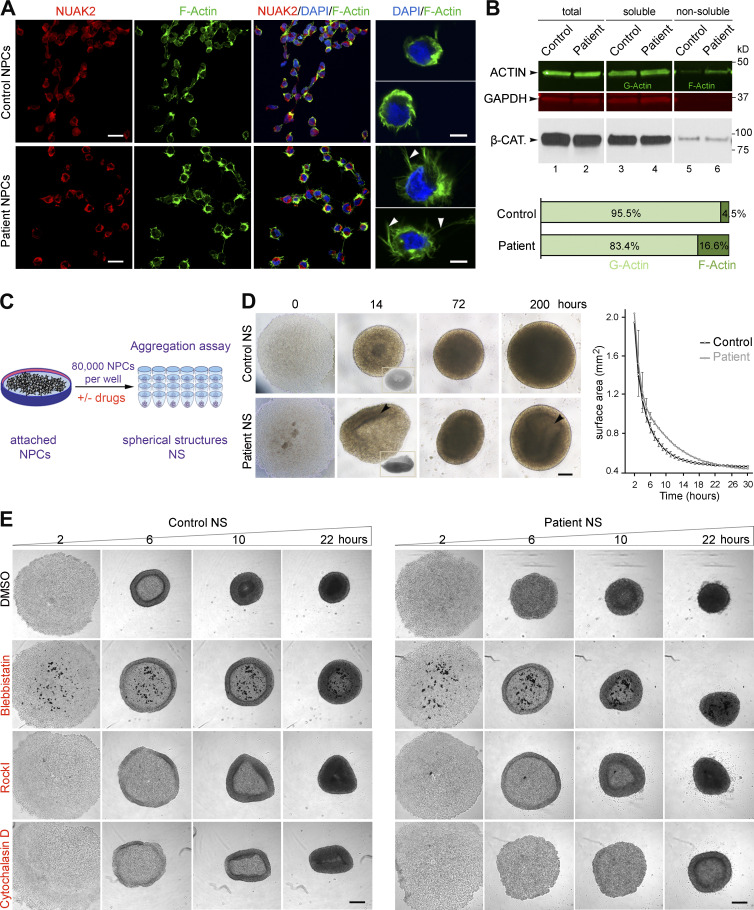
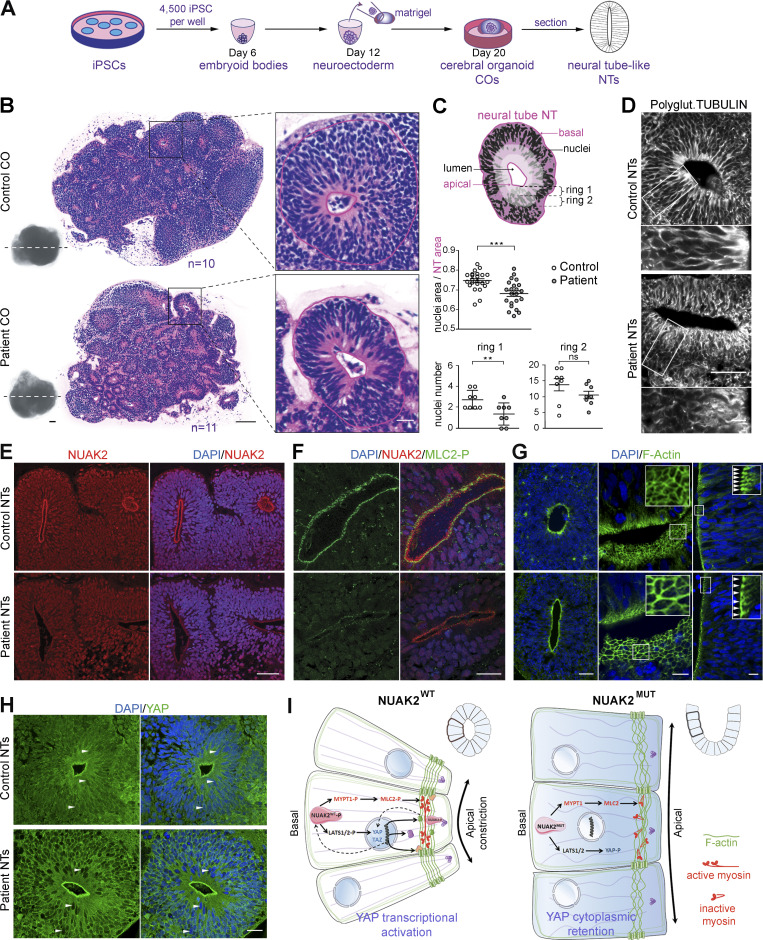
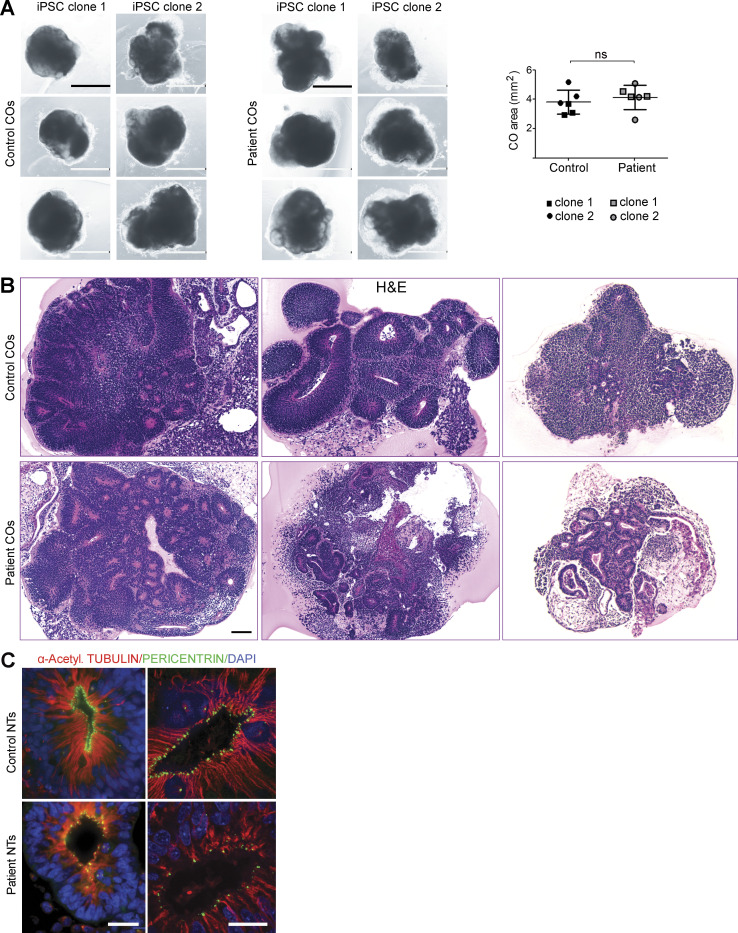
Failure of neural tube closure during embryonic development can result in anencephaly, one of the most common birth defects in humans. A family with recurrent anencephalic fetuses was investigated to understand its etiology and pathogenesis. Exome sequencing revealed a recessive germline 21-bp in-frame deletion in NUAK2 segregating with the disease. In vitro kinase assays demonstrated that the 7-amino acid truncation in NUAK2, a serine/threonine kinase, completely abrogated its catalytic activity. Patient-derived disease models including neural progenitor cells and cerebral organoids showed that loss of NUAK2 activity led to decreased Hippo signaling via cytoplasmic YAP retention. In neural tube-like structures, endogenous NUAK2 colocalized apically with the actomyosin network, which was disrupted in patient cells, causing impaired nucleokinesis and apical constriction. Our results establish NUAK2 as an indispensable kinase for brain development in humans and suggest that a NUAK2-Hippo signaling axis regulates cytoskeletal processes that govern cell shape during neural tube closure.


Conflict of interest statement

Disclosures: The authors declare no competing interests exist.

Figures

None
Graphical abstract
Figure 1.
Figure 1.
Abrogation of NUAK2 kinase activity causes anencephaly in three fetuses. (A) Pedigree of a consanguineous family from Turkey presenting with three consecutive anencephalic fetuses. Black triangle, abortion, affected state; diagonal line, deceased; +/−, heterozygous for NUAK2 mutation; −/−, homozygous for NUAK2 germline mutation. (B) Facial and profile images of affected fetuses III-2 at 20 wk and III-3 at 14 wk, both showing anencephaly, and fetus III-2, also displaying frontonasal dysplasia and clinical anophthalmia. (C) Exome sequencing of both parents and fetus III-2 delineated an in-frame deletion/insertion c.412_433delinsG in the NUAK2 gene. Sanger sequencing confirmed that NUAK2 mutation segregated with anencephaly in all family members. (D) Schematic representation of NUAK2 variant at the RNA and protein levels. The mutation causes a 7–amino acid deletion together with a 1–amino acid alteration annotated as p.Y138_Q145delinsE. Protein 3D structure prediction showed that mutated residues lie in the universally conserved αC-helix (red) of the NUAK2 kinase domain. Kinase domain is composed of a Walker-A motif (yellow) that binds to the γ-phosphate of ATP, a T-loop (green) that contains a threonine that is phosphorylated for kinase activation, a DFG motif (blue) that binds Mg2+ in catalysis, and a catalytic loop (pink) that interacts with substrate and catalytic residues. (E) Western blot of overexpressed HA-tagged NUAK2WT and NUAK2MUT showed that NUAK2MUT was not phosphorylated compared with NUAK2WT. Anti-pAMPK (T172) antibodies recognize the phosphorylated threonine T208 of NUAK2. (F) Phosphorylation assay using radioactive [32P]-ATP (Phospho Image) confirmed phosphorylation of NUAK2WT but not NUAK2MUT. Coomassie stain showed equal amount of WT and MUT NUAK2 proteins (prot.). (G) Kinase activity assay with radioactive [32P]-ATP showed significant decrease of phosphorylated AMARA peptide in presence of NUAK2MUT protein, as low as when kinase was not added in the reaction mixture (Blank). (H) Kinase activity assay repeated with LATS2, a NUAK2 substrate, showed decreased LATS2 phosphorylation in the presence of NUAK2MUT. Western blot showed equal amount of LATS2 and NUAK2 proteins. Phosphorylation and kinase assays were performed in duplicate and repeated in two independent experiments (E–H). **, P < 0.02; ***, P < 0.005.
Figure S1.
Figure S1.
Amino acid alignments of NUAK orthologs and paralog show high conservation of the mutated residues.
Figure 2.
Figure 2.
NUAK2 mutation affects Hippo-YAP signaling in patient NPCs. (A) Schematic representation of the different cell types generated from control and fetus III-3 skin biopsies. (B) Q-PCR showed higher level of NUAK2 transcripts in control NPCs compared with fibroblasts and iPSCs. Relative NUAK2 expression was normalized against the values for fibroblasts and set to 1 (indicated by a dashed line). (C) Q-PCR showed that while NUAK2 expression was unchanged in patient NPCs compared with control, transcript level of its paralog NUAK1 was significantly reduced. Relative NUAK2 and NUAK1 expression was normalized against the values for control NPCs and set to 1. Q-PCR was repeated in three independent experiments, using two sets of primers. (D) Western blot confirmed similar level of endogenous NUAK2, while NUAK1 was strikingly reduced in patient cells compared with control. LATS1 and LATS2 were reduced in patient cells compared with control, with more extent for LATS1. Phosphorylation of YAP (YAP-P), the main downstream effector of LATS1/2, was significantly increased in patient cells, while YAP level remained the same. TAZ, a paralog of YAP, was significantly decreased in patient cells compared with control. Protein extracts were performed on two control NPC clones and two patient NPC clones. For each NPC clone, at least three biological samples were revealed by Western blot. The same control and patient protein extracts were loaded on two 4–20% gels and revealed with different antibodies as shown in the figure. (E) Subcellular protein fractionation showed increased cytoplasmic localization of YAP in patient cells compared with control, especially in organelle and plasma membranes. Three independent fractionations were performed. (F) YAP immunofluorescence revealed increased level of YAP in the cytoplasm of mutant NPC compared with control. Two antibodies, mouse anti-YAP (Santa Cruz) and rabbit anti-YAP (Cell Signaling) gave the same result. Scale bar = 5 µm. (G) Q-PCR analysis of well-known YAP target genes showed significant reduction of YAP transcriptional activity in patient NPCs compared with control. All YAP targets encode proteins that control the cytoskeleton network including actin. For each gene, relative expression was normalized against the value for control NPCs and set to 1. Q-PCR was repeated at in two independent experiments. (H) Live-cell counting over 5 d in culture showed slower growth of NUAK2-mutated NPCs compared with control. Cells were harvested from three wells (of a 12-well plate). The values shown are the average ± SD of three technical replicates. **, P < 0.02; ***, P < 0.005; ns, not significant.
Figure S2.
Figure S2.
Transcriptional changes in NUAK2 mutant cells. (A) Q-PCR shows similar transcript level of Hippo components in both control and patient NPCs. (B) While the level of TAZ proteins was partly rescued in MG132-treated cells (lanes 4 and 6 vs. lanes 10 and 12), LATS2 remained lower in mutant cells. Results were confirmed in three independent Western blots. (C) Q-PCR showing transcriptional change in patient NPCs compared with control, especially in genes that are involved in actin polymerization, architecture, and dynamics. Transcription of YAP-targeted genes was significantly deregulated in patient cells compared with control. (D) Q-PCR showing transcriptional rescue of NUAK1 and CTGF in patient NS treated with BLEB and ROCK-I compared with control. Relative gene expression was normalized against the values for nontreated and treated control NS and set to 1. Q-PCR data represent the average ± SD of three technical replicates from two independent experiments. *, P < 0.05; **, P < 0.02; ***, P < 0.005; ns, not significant.
Figure 3.
Figure 3.
Defects in the actomyosin network in patient-derived NPCs cause abnormal cell aggregation. (A) Immunofluorescence on NPCs revealed close proximity of NUAK2 to F-actin as well as F-actin network expansion in patient NPCs compared with control (left panels). Scale bar = 20 µm. Higher-resolution images of representative cells showed that patient NPCs were enlarged and enriched with F-actin filopodial protrusions (arrowhead) compared with control cells (right panel). Scale bar = 5 µm. (B) G- and F-actin fractionation followed by quantitative Western blot showed increased F-actin in patient NPCs compared with control. GAPDH and β-CATENIN (β-CAT) served as loading controls for each protein fraction. Two independent fractionations were performed. (C) Schematic representation of aggregation assay, in which 80,000 NPCs seeded in low-attachment U-bottom microwells formed spherical structures (NS) over time. (D) Bright-field images illustrating representative spatiotemporal assembly and organization of NPCs during aggregation assay. Patient NPC aggregation was disorganized, failing to form donut-shaped pattern (14 h, inset) and spherical structures compared with control. Heterogeneous cell density (arrowhead) was observed in patient NS compared with control, suggesting lower proliferation. Scale bar = 200 µm. NS area measurement at sequential time points showed that patient NS aggregation was delayed compared with control (right graph). All experiments were repeated three times, with two different iPSC-derived NPC clones for control and patient. Surface area was calculated using ImageJ software, and represented values are the average ± SD of eight NS. (E) Bright-field images of NS after 2, 6, 10, and 22 h in culture, showing absence of outer ring formation in patient NPCs. Treatment with BLEB rescued ring formation in patient NPCs, as well as with ROCK-I, to a lesser extent. In contrast, treatment with cytochalasin D abrogated cell aggregation in both cell lines, more so in patient NPCs. All experiments were repeated independently three times. Scale bar = 250 µm.
Figure 4.
Figure 4.
NUAK2 controls apical actomyosin network in human COs. (A) Schematic representation of the culture workflow to generate COs from control and patient iPSCs. At 20 d, COs were fixed, sectioned, and used as a proxy to study NTs. Three batches of COs were independently performed using two control iPSC clones and two patient iPSC clones. For each iPSC clone, 8–16 COs were prepared (in 8–16 wells of a 96-well plate). (B) Representative image of H&E staining of control (n = 10) and patient (n = 11) CO sections shows multiple 2D NT structures that display features of the embryonic neural tube. Patient NT shows basal nucleus accumulation compared with control NT, in which nuclei were scattered along the apico-basal axis. Scale bars = 200, 100, and 20 µm (from left to right panels). (C) Schematic representation of a NT displaying total NT area (pink) and nucleus area (black), as well as two most apical subrings (rings 1 and 2, light pink). Ratio of nucleus area to NT area confirmed nucleus compaction in patient NT (n = 23) compared with control (n = 22; top graph). Number of nuclei was decreased apically (rings 1 and 2) in patient NT (n = 8) compared with control (n = 8; bottom graphs). (D) Polyglutaminated tubulin immunostaining on CO sections revealed disorganized and nonlinear microtubule network in mutant NT cells compared with control. Scale bars = 50 µm (top panel); 10 µm (lower panel). (E) Representative image of NUAK2 immunostaining on CO sections showing that, while NUAK2 localized in the nucleus of NECs, its apical concentration was significantly reduced in mutant NT compared with control. Scale bar = 50 µm. (F) Representative image of coimmunostaining of NUAK2 with phosphorylated MLC2 (MLC2-P) on CO sections, showing their proximal localization at the apical side of NT cells, with less extent in mutant NT. Scale bar = 20 µm. (G) Representative image of phalloidin staining revealing F-actin accumulation apically (left panel). Apical view of mutant NT revealed enlargement of NECs compared with control (middle panel, inset). Frontal view of patient NT confirmed enlargement of NECs compared with control (right panel, inset, white arrowheads). Scale bars = 50, 10, and 10 µm (from left to right panels). (H) Representative image of YAP immunostaining on CO sections revealing YAP cytoplasmic concentration in mutant NT cells compared with control. We also noted enrichment of YAP apically in both patient and control NTs, suggesting a possible interaction of NUAK2 and the actomyosin network during apical constriction. Scale bar = 20 µm. (I) Model showing the role of NUAK2 in regulating apical cell constriction and apicobasal cell elongation during neural tube formation. By regulating Hippo-YAP signaling, NUAK2 controls F-actin organization and dynamics. All immunostaining were confirmed at least three times using COs from different batches. **, P < 0.02; ***, P < 0.005; ns, not significant.
Figure S3.
Figure S3.
NUAK2 controls NT-like structures in human COs. (A) Images of control and patient COs derived from two different iPSC clones. Graph representing the size (area) of control and mutant COs (right panel). Scale bar = 1 mm. (B) H&E staining of CO sections revealed either general dysplasia with significantly fewer NT structures or nucleus disorganization in patient NT compared with control. Scale bar = 100 µm. (C) Coimmunostaining using α-acetylated tubulin and pericentrin confirmed microtubule disorganization and scattered centrosomes in NUAK2 mutant NECs compared with control. Scale bar = 20 µm. ns, not significant.

References

    1. Adzhubei, I.A., Schmidt S., Peshkin L., Ramensky V.E., Gerasimova A., Bork P., Kondrashov A.S., and Sunyaev S.R.. 2010. A method and server for predicting damaging missense mutations. Nat. Methods. 7:248–249. 10.1038/nmeth0410-248 - DOI - PMC - PubMed
    1. Altschul, S.F., Madden T.L., Schäffer A.A., Zhang J., Zhang Z., Miller W., and Lipman D.J.. 1997. Gapped BLAST and PSI-BLAST: a new generation of protein database search programs. Nucleic Acids Res. 25:3389–3402. 10.1093/nar/25.17.3389 - DOI - PMC - PubMed
    1. Aragona, M., Panciera T., Manfrin A., Giulitti S., Michielin F., Elvassore N., Dupont S., and Piccolo S.. 2013. A mechanical checkpoint controls multicellular growth through YAP/TAZ regulation by actin-processing factors. Cell. 154:1047–1059. 10.1016/j.cell.2013.07.042 - DOI - PubMed
    1. Arnold, K., Bordoli L., Kopp J., and Schwede T.. 2006. The SWISS-MODEL workspace: a web-based environment for protein structure homology modelling. Bioinformatics. 22:195–201. 10.1093/bioinformatics/bti770 - DOI - PubMed
    1. Bekri, A., Billaud M., and Thélu J.. 2014. Analysis of NUAK1 and NUAK2 expression during early chick development reveals specific patterns in the developing head. Int. J. Dev. Biol. 58:379–384. 10.1387/ijdb.140024jt - DOI - PubMed

Publication types

MeSH terms