. 2020 Aug 25;32(8):108067.
doi: 10.1016/j.celrep.2020.108067.

Single-Cell Transcriptome Profiling Reveals β Cell Maturation in Stem Cell-Derived Islets after Transplantation

Affiliations

Single-Cell Transcriptome Profiling Reveals β Cell Maturation in Stem Cell-Derived Islets after Transplantation

Punn Augsornworawat et al. Cell Rep. .

Erratum in

Abstract

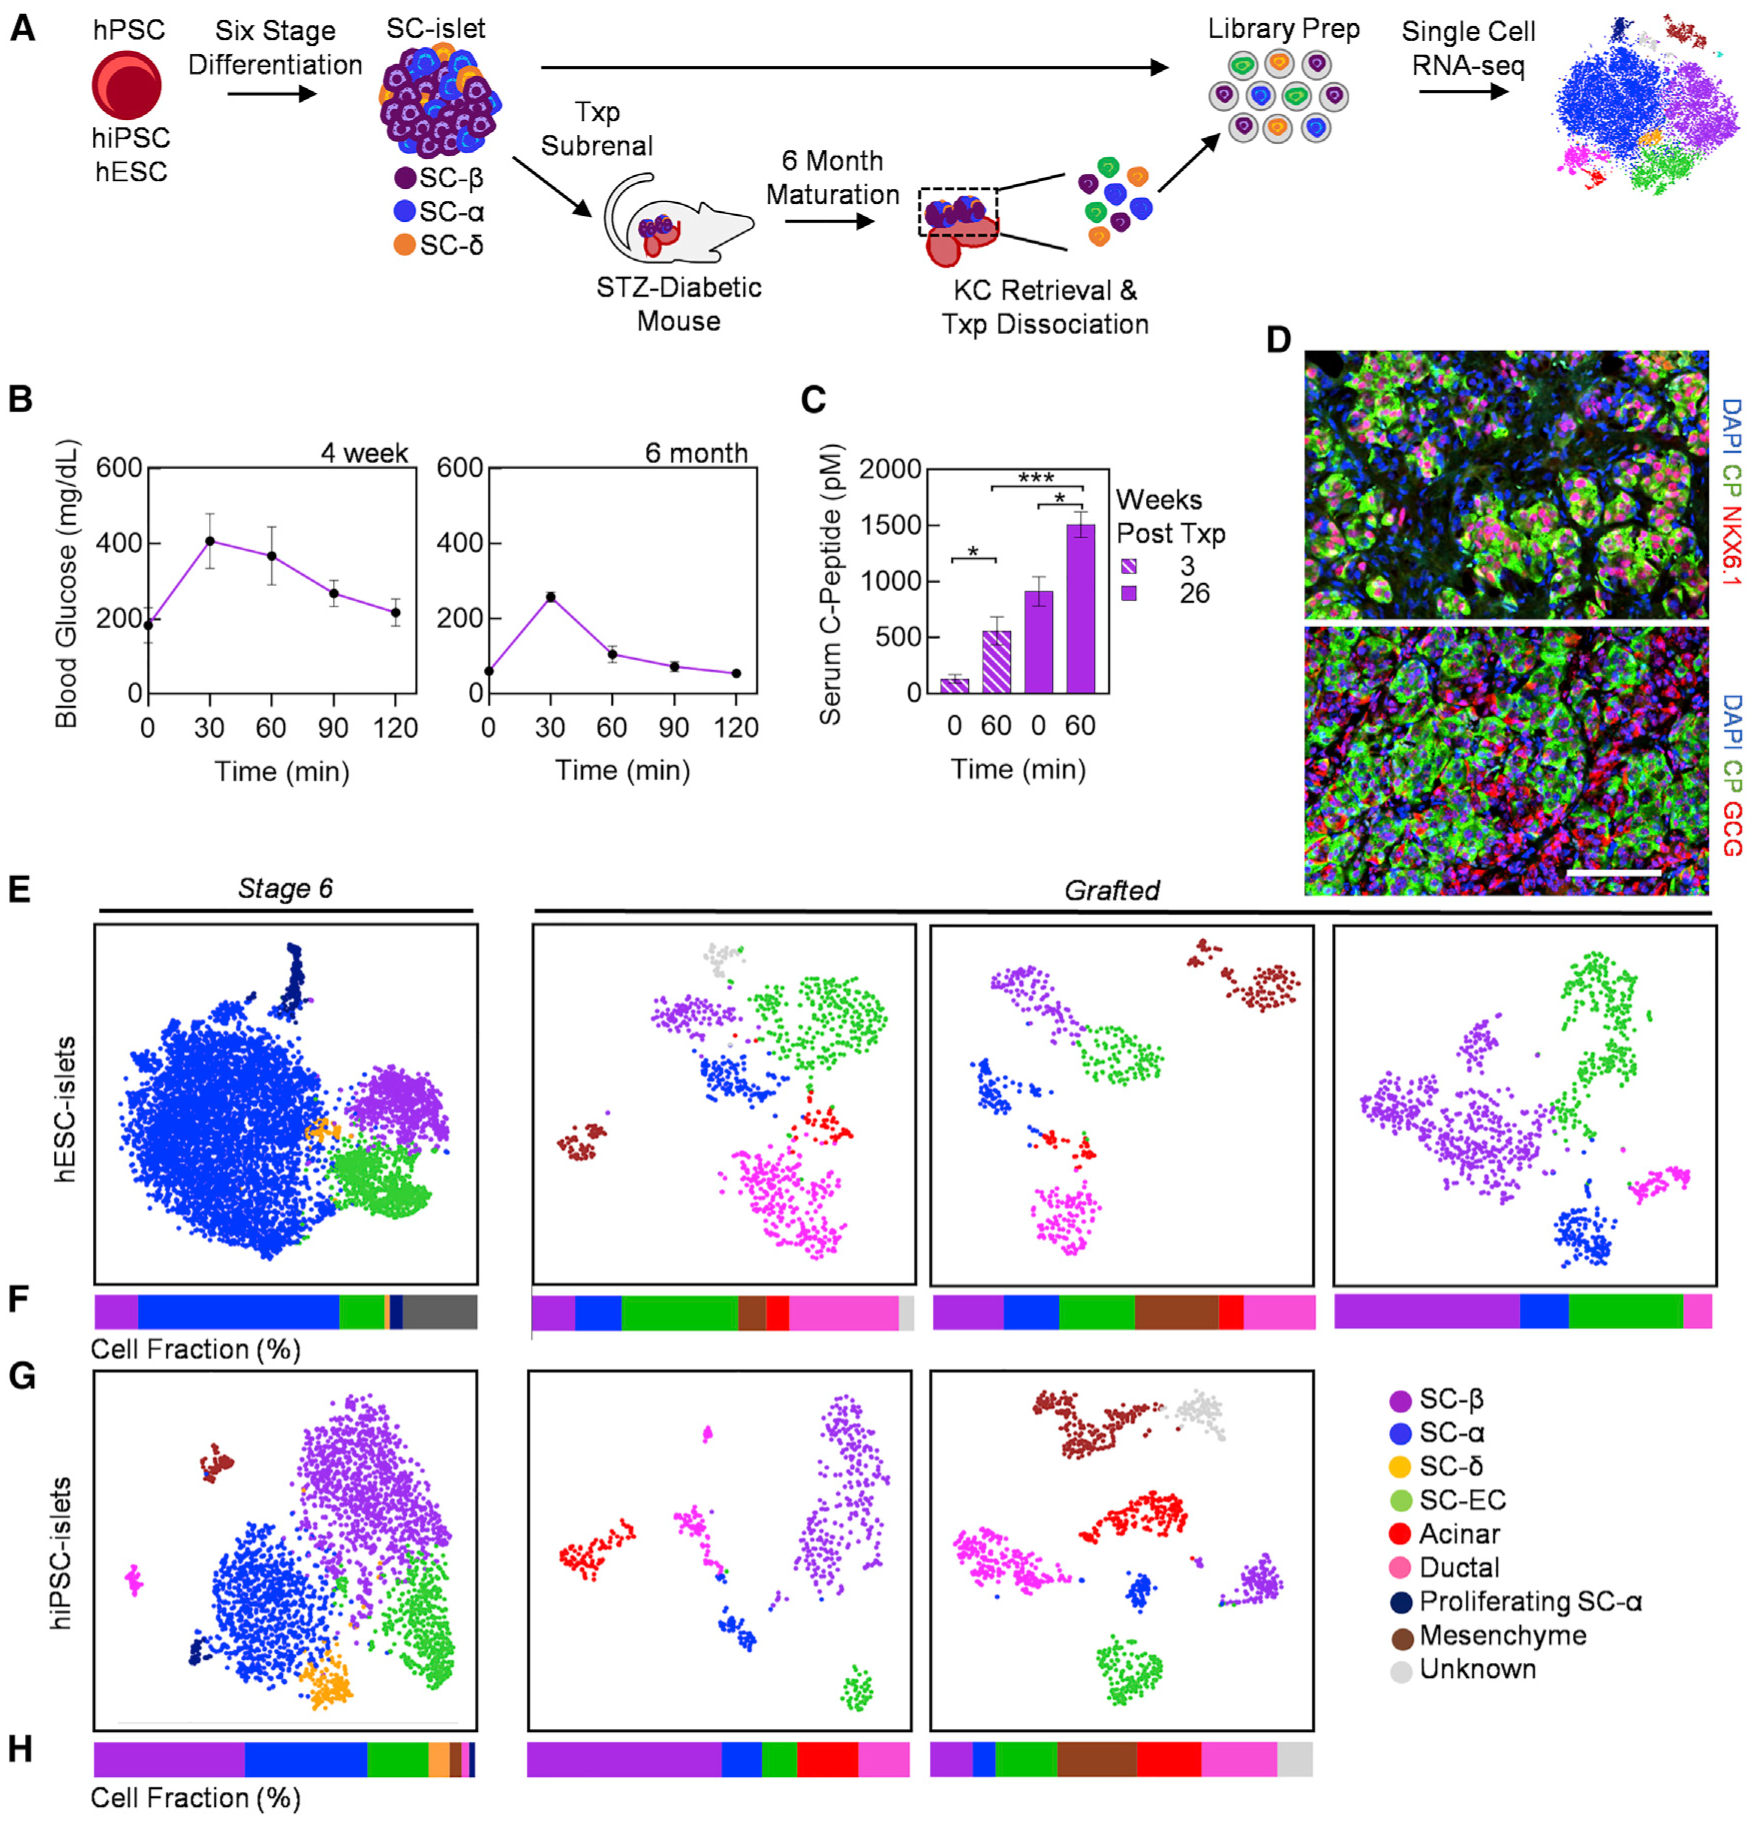
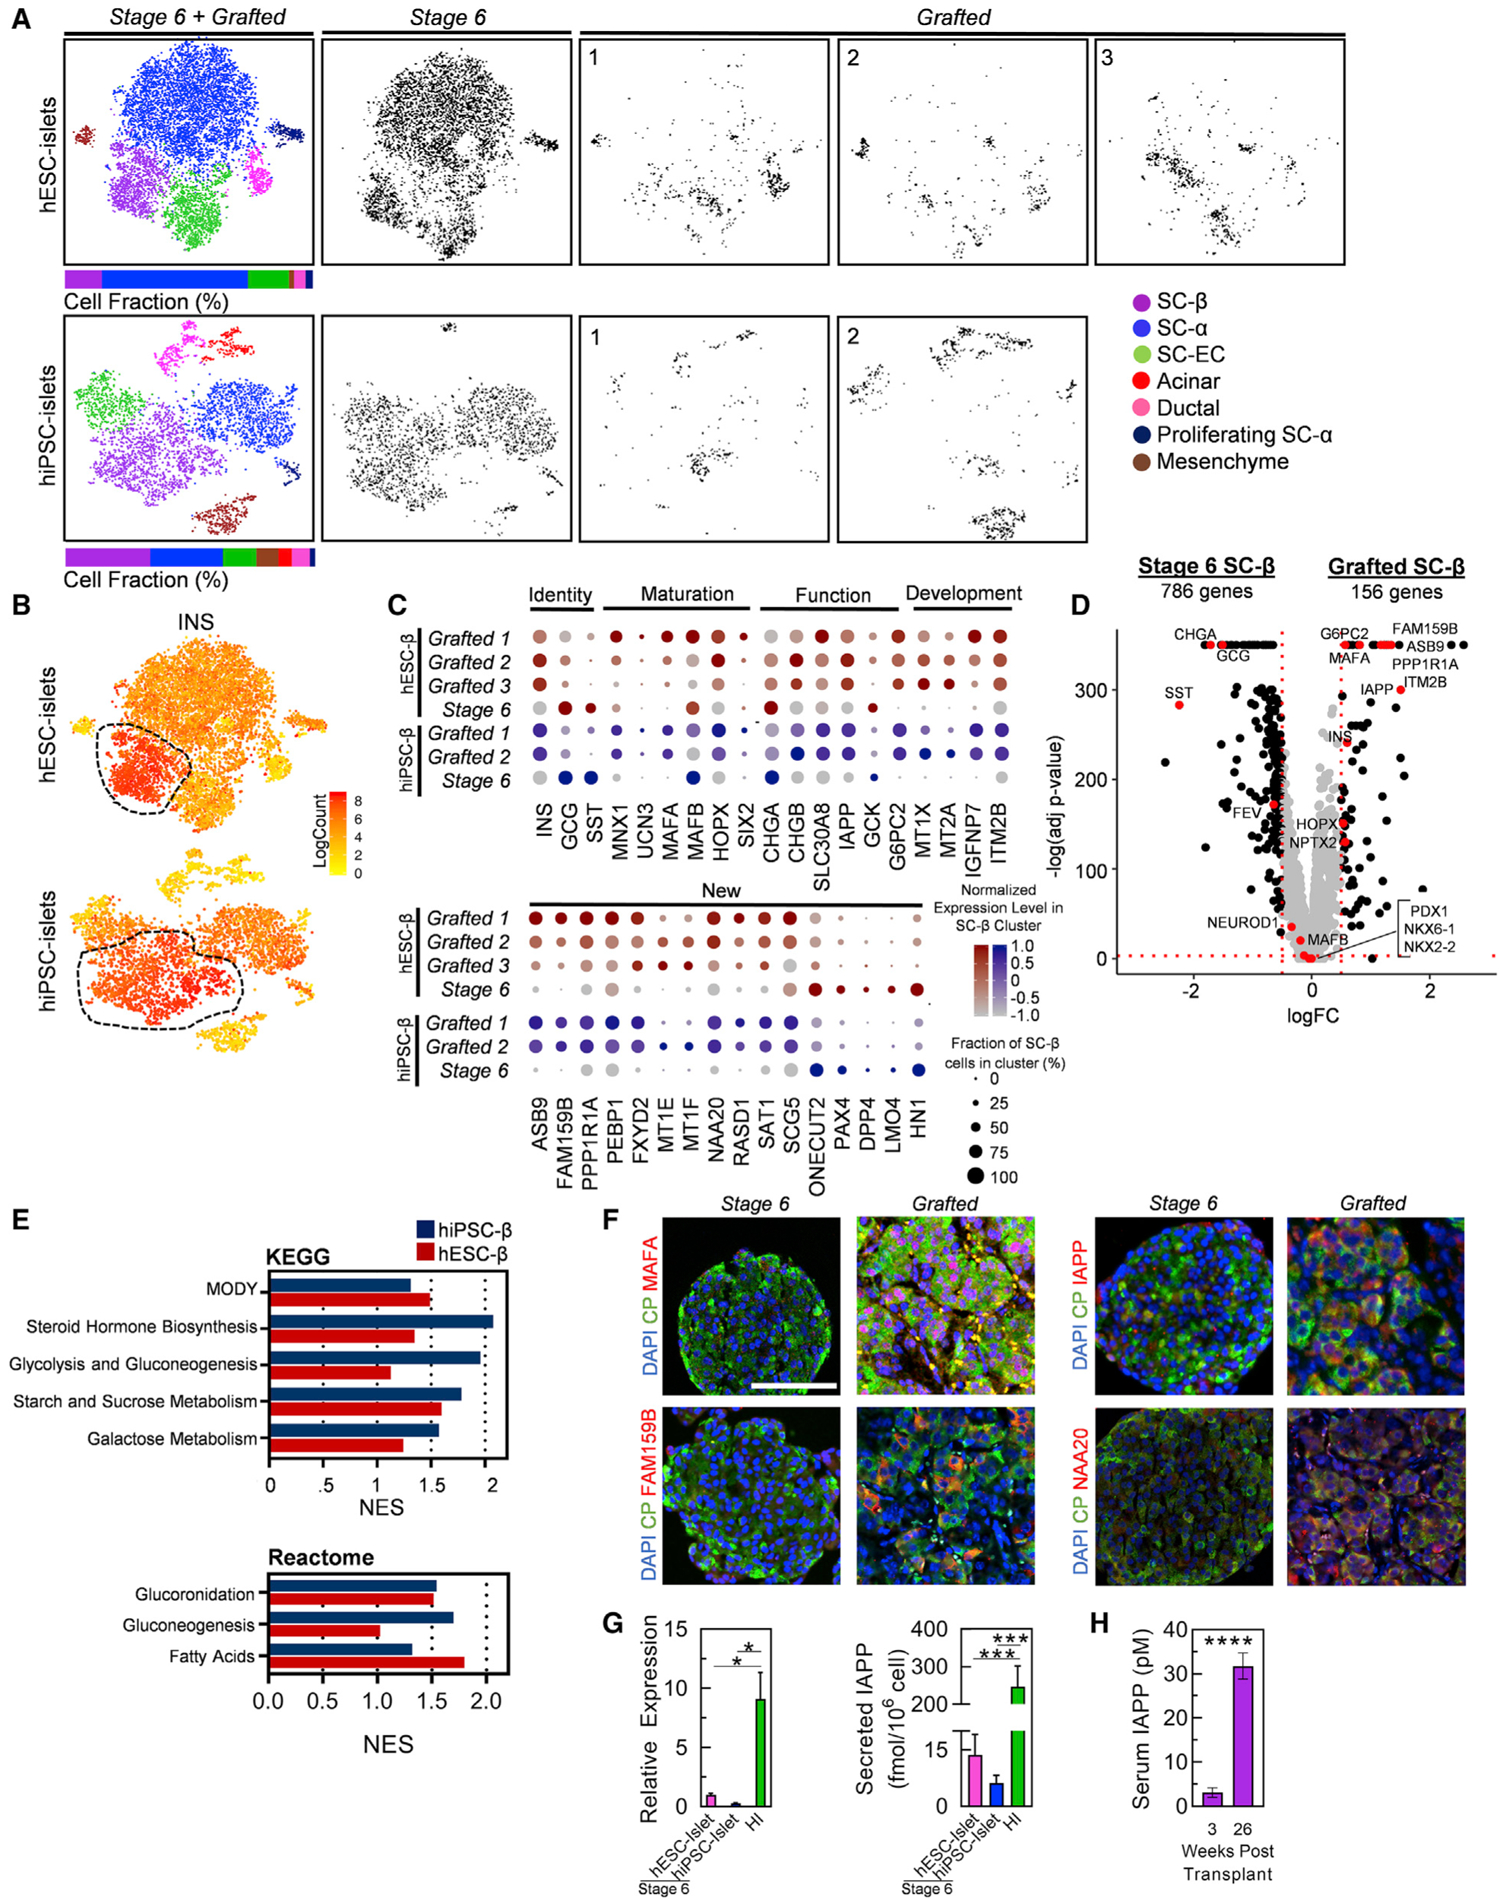
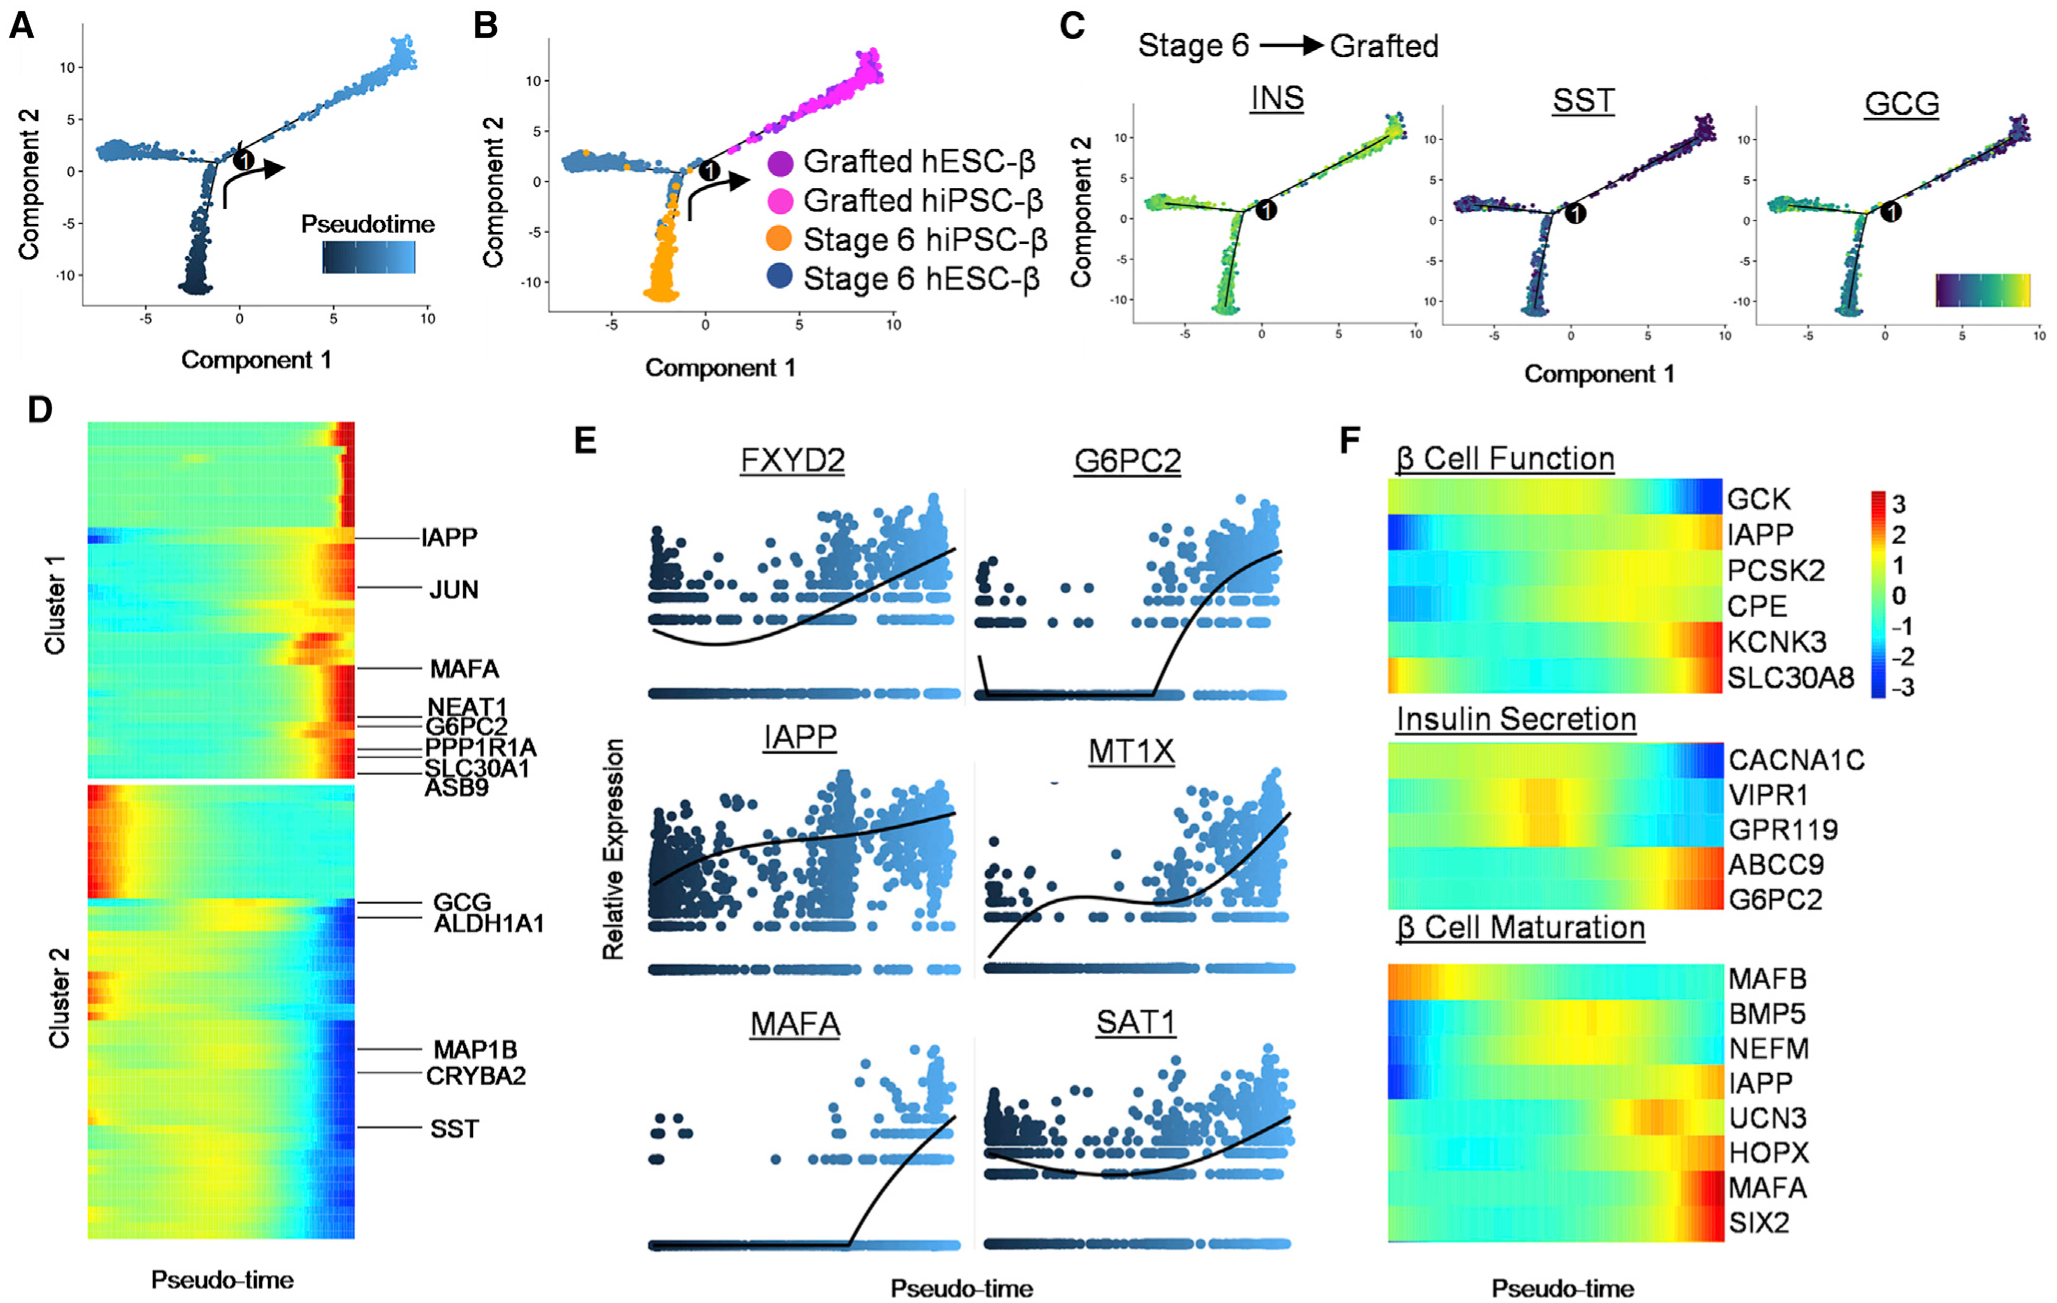
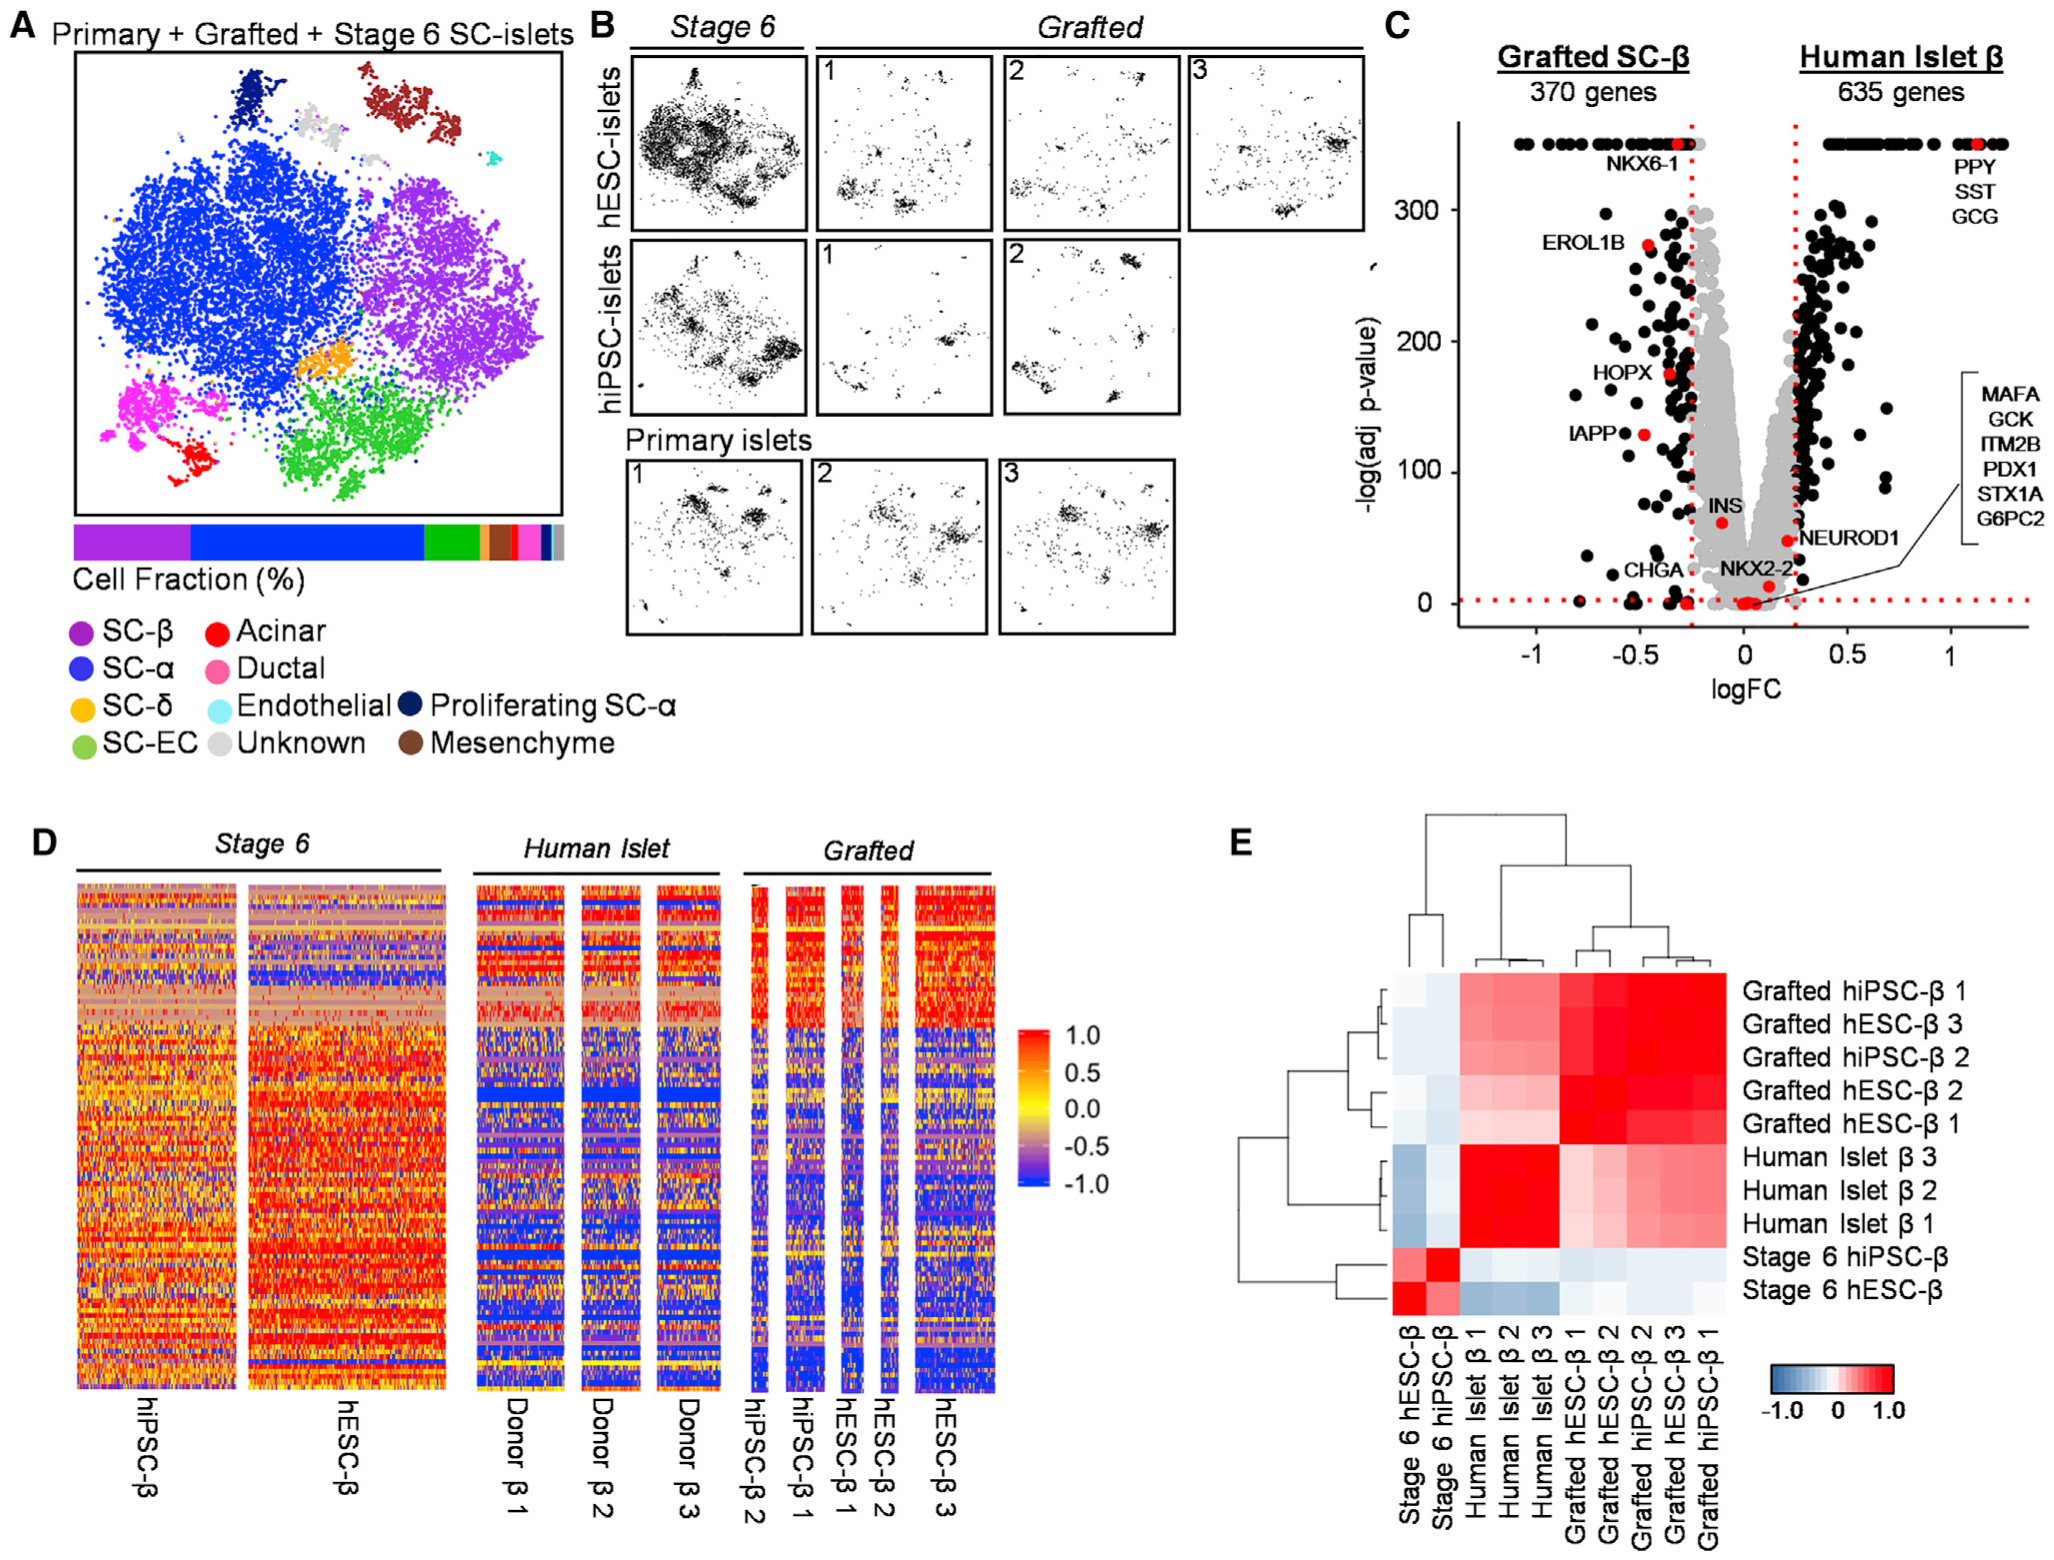
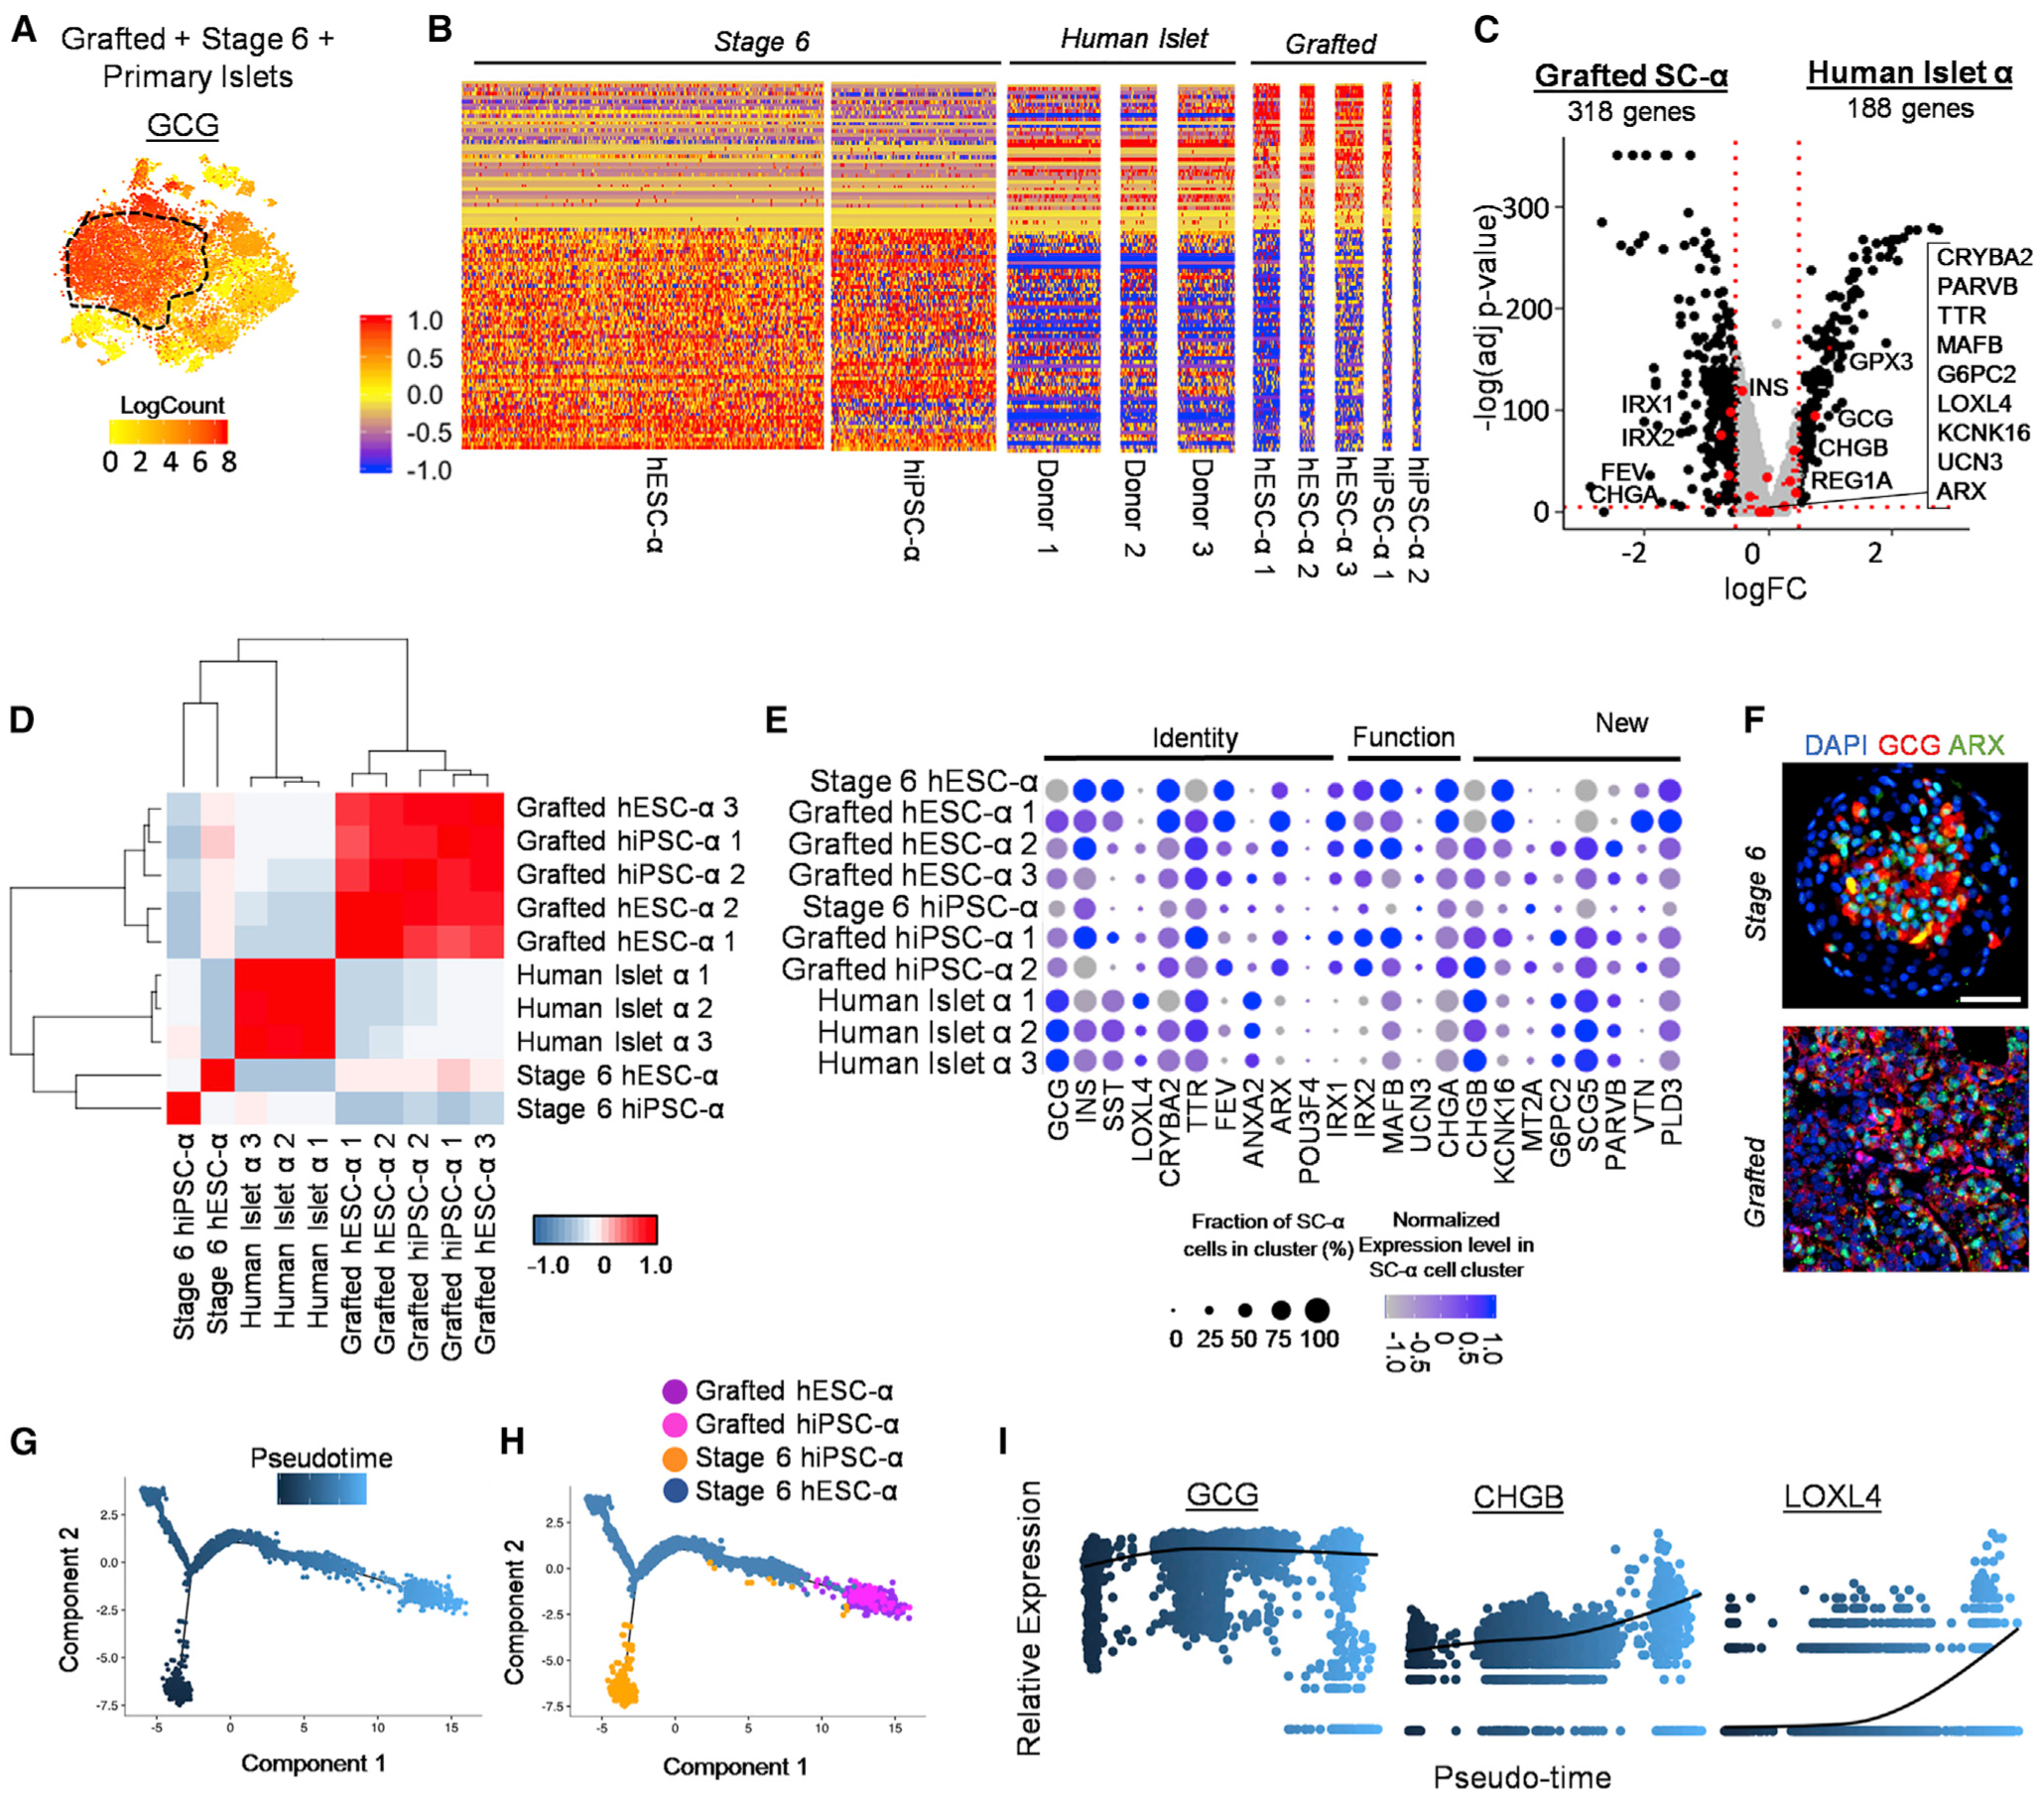
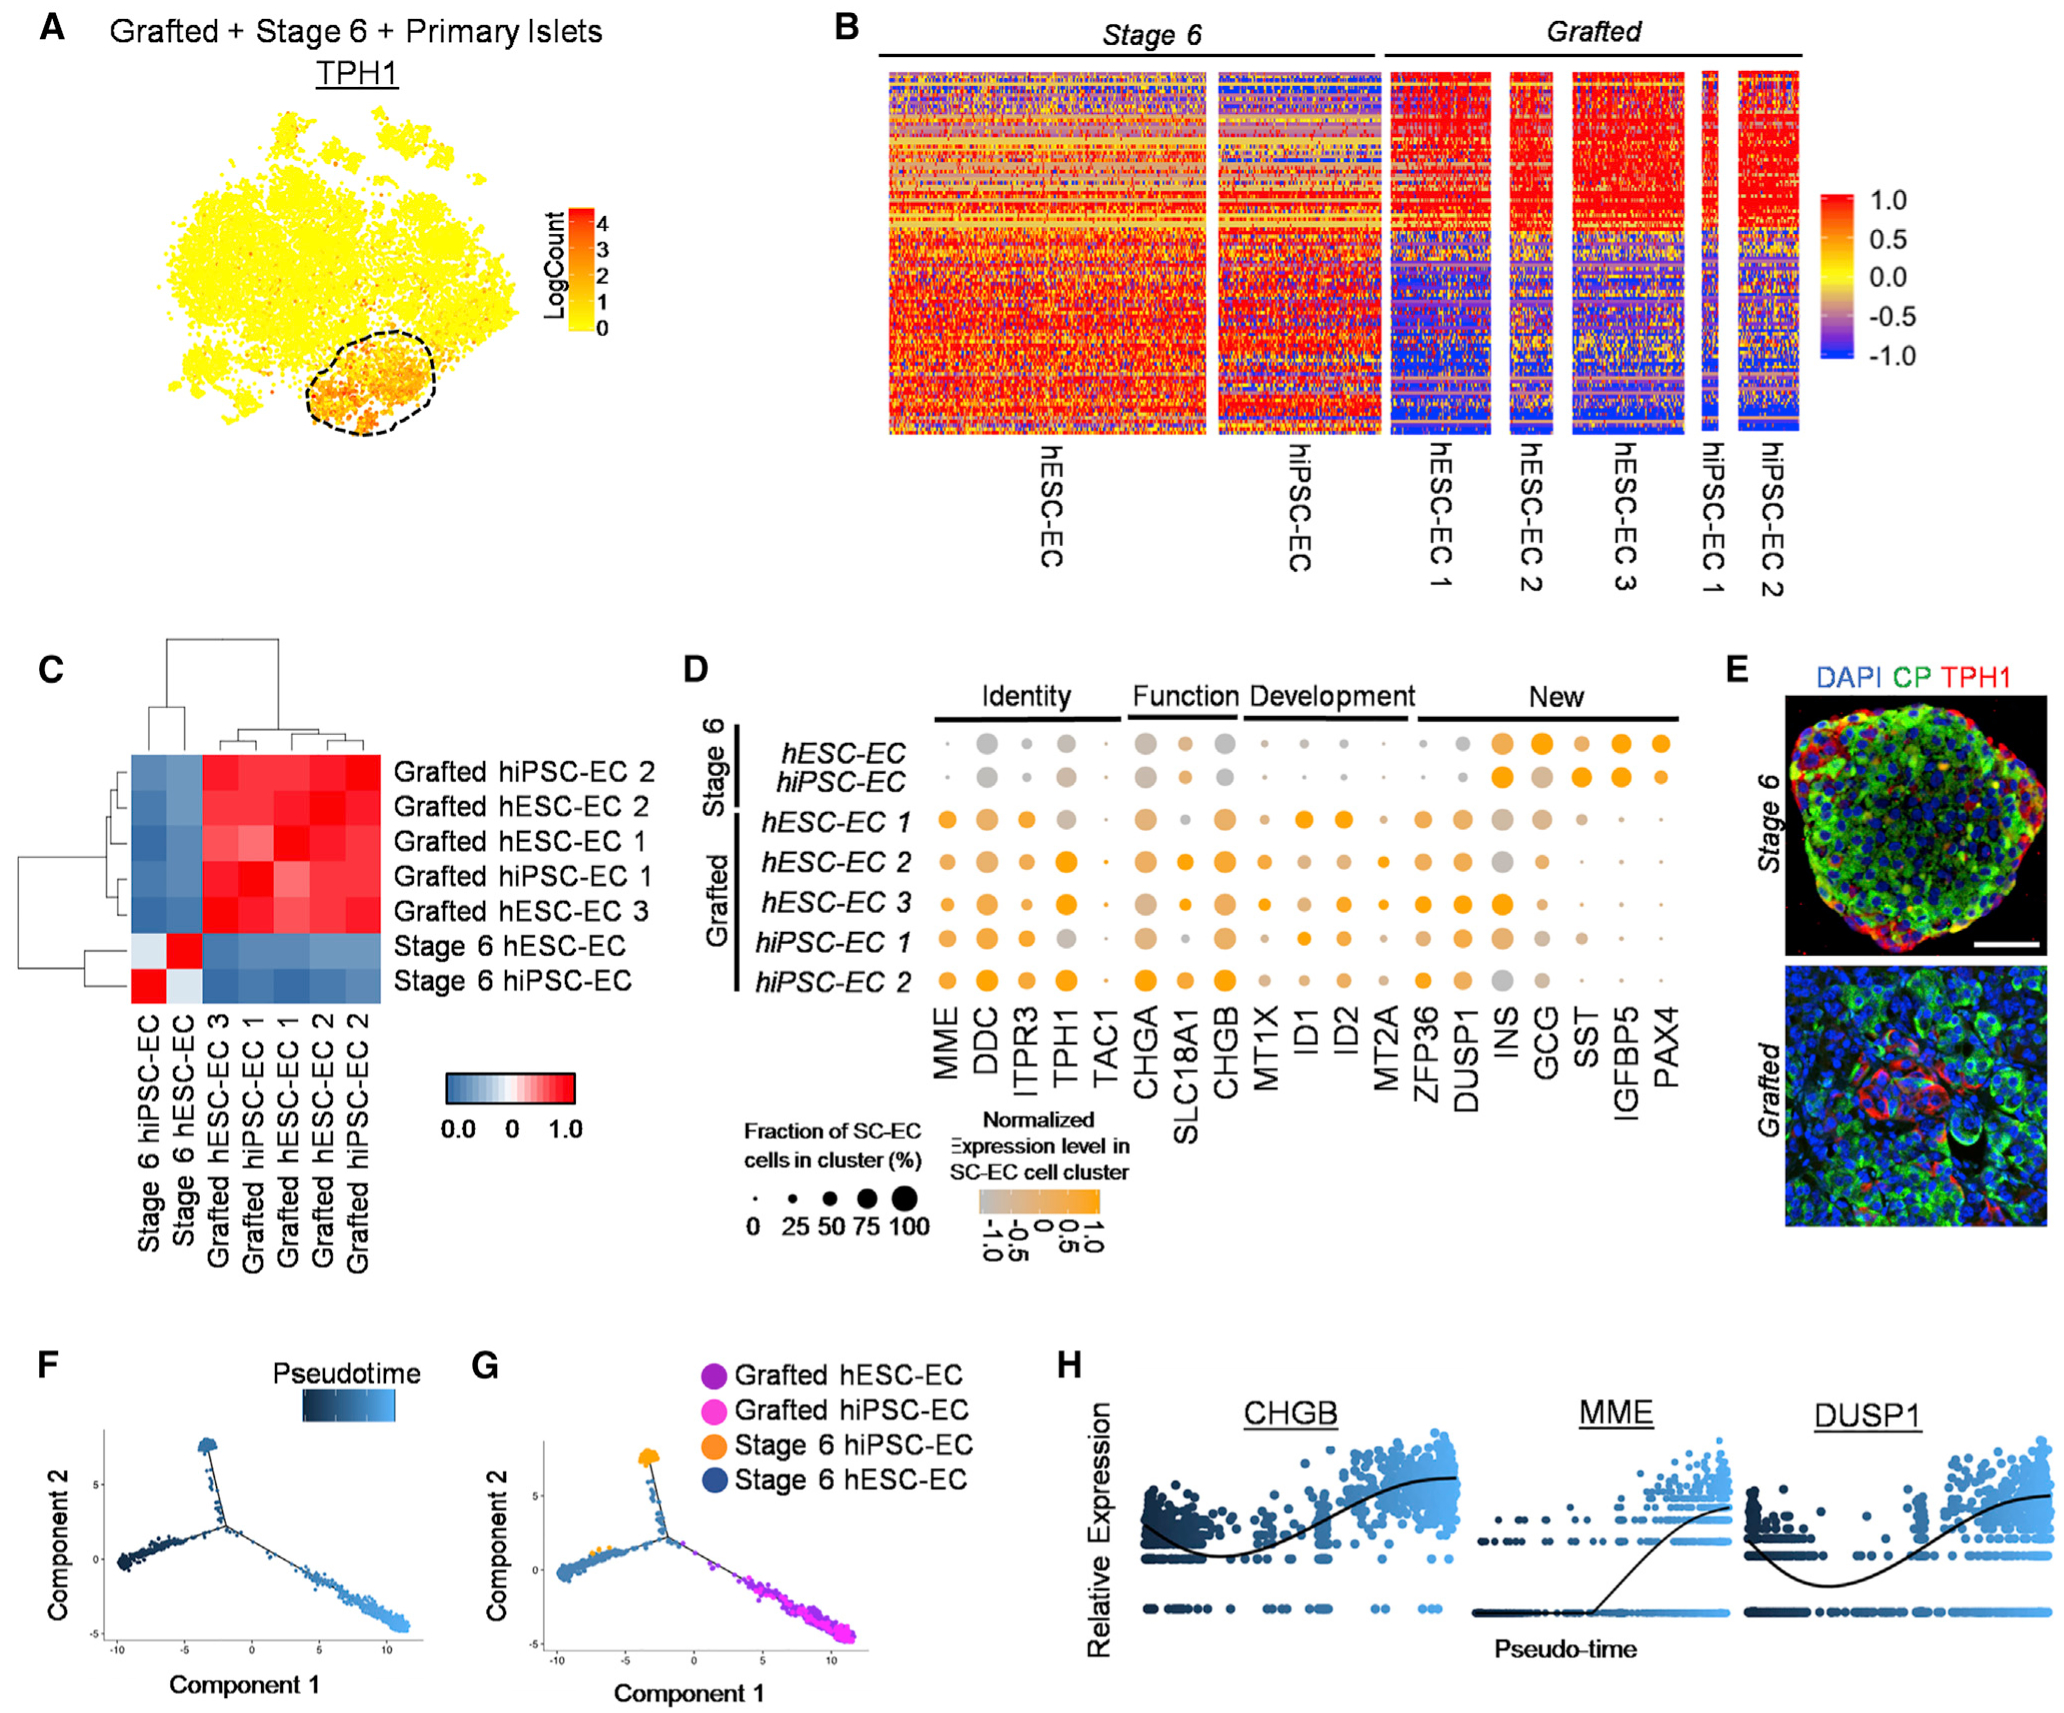
Human pluripotent stem cells differentiated to insulin-secreting β cells (SC-β cells) in islet organoids could provide an unlimited cell source for diabetes cell replacement therapy. However, current SC-β cells generated in vitro are transcriptionally and functionally immature compared to native adult β cells. Here, we use single-cell transcriptomic profiling to catalog changes that occur in transplanted SC-β cells. We find that transplanted SC-β cells exhibit drastic transcriptional changes and mature to more closely resemble adult β cells. Insulin and IAPP protein secretions increase upon transplantation, along with expression of maturation genes lacking with differentiation in vitro, including INS, MAFA, CHGB, and G6PC2. Other differentiated cell types, such as SC-α and SC-enterochromaffin (SC-EC) cells, also exhibit large transcriptional changes. This study provides a comprehensive resource for understanding human islet cell maturation and provides important insights into maturation of SC-β cells and other SC-islet cell types to enable future differentiation strategy improvements.

Keywords: IAPP; alpha cells; beta cells; diabetes; insulin; islets; sngle-cell RNA sequencing; stem cells; transcriptome.


Conflict of interest statement

Declaration of Interests L.V.-C. and J.R.M. are inventors on patent applications related to SC-β cell technology described in this manuscript.

Figures

Figure 1.
Figure 1.. Single-Cell Transcriptional Characterization of Stage 6 and Grafted hPSC-Islets Identifies Endocrine and Non-Endocrine Cell Populations
(A) Schematic summary of single-cell analysis of stage 6 SC-islets and grafted SC-islets following 6 months of in vivo maturation in diabetic mice. (B) Glucose tolerance test (GTT) at 4 weeks and 6 months after transplantation of SC-islets (n = 5). (C) In vivo glucose-stimulated CP secretion at 0 min, before, and 60 min after glucose injection at 3 and 26 weeks post-transplantation (n = 5). *p < 0.05, ***p < 0.001 by two-way unpaired t test. (D) Immunostaining of kidney graft explanted form SC-islet transplanted mice at 6 months. Scale bar, 100 μm. (E–H) Individual tSNE projection (E and G) and cell population fractions (F and H) from unsupervised cluster of stage 6 and grafted hESC- and hiPSC-islets. CHGA, chromogranin A; CP, C-peptide; EC, enterochromaffin; GCG, glucagon. Error bars represent SEM. See also Figure S1 and Table S2.
Figure 2.
Figure 2.. Comparison of Stage 6 and Grafted hiPSC-β and hESC-β Cell Transcriptomes
(A) Unsupervised clustering tSNE projections of hESC-islets and hiPSC-islets with islet cell-type identification and cell proportions for each individual sample (gray). (B) Heatmap of INS gene expression to distinguish SC-β Cell population for both hESC-islet and hiPSC-islet samples. (C) Normalized expression values for key β Cell identity, maturation, functional, developmental, and newly identified gene sets compared between stage 6 and grafted SC-β Cells for both hiPSC-β and hESC-β datasets. Percentage of cells positive for designated gene is represented by circle size, and saturation indicates low (gray) or high (blue/red) expression of the gene. (D) Volcano plot displaying fold change (FC) differences of β Cell genes between stage 6 and grafted SC-β Cells of all hESC- and hiPSC-derived samples combined. Dashed lines are drawn to define restriction of log FC value of 0.25 and −log of adjusted p value 0.001. Key β Cell genes are labeled and colored red. (E) KEGG and Reactome GSEA, quantified by the normalized enrichment score (NES), for pathways upregulated in grafted hESC-β (red) and hiPSC-β (blue) compared to stage 6 hESC-β or hiPSC-β Cells, respectively. NES values and gene lists are available in Table S4. (F) Immunostaining of stage 6 and 6-month kidney grafts containing SC-islets for identified β Cell maturation markers (red) co-stained with CP (green). Scale bar, 100 μm. (G) Analysis of IAPP gene expression with real-time PCR (left; n = 4) and secreted IAPP protein (right; n = 11, n = 8, n = 9 for stage 6 hESC-islet, stage 6 hiPSC-islet, and HIs, respectively) in vitro. *p < 0.05, ***p < 0.001 by two-way unpaired t test. (H) IAPP protein in serum of mice transplanted with SC-islets for 3 and 26 weeks (n = 5). ****p < 0.0001 by two-way unpaired t test. INS, insulin; MODY, maturity onset diabetes of the young; CHGB, chromogranin B; IAPP, islet amyloid polypeptide; HI, human islet. Error bars represent SEM. See also Figures S1 and S2 and Table S3.
Figure 3.
Figure 3.. Pseudo-Time Analysis Projects Stage 6 SC-β Cell Maturation into Grafted SC-β Cells after Transplantation
(A) Pseudo-time trajectory of stage 6 and grafted SC-β Cells with one branching point. (B) Distribution of SC-β Cells from grafted hESC-β (purple), grafted hiPSC-β (pink), stage 6 hiPSC-β (orange), and stage 6 hESC-β Cells (blue). (C) Changes in gene expression of endocrine hormones—INS, somatostatin (SST), and GCG—along pseudo-time projection for SC-β Cells. Scale: relative expression. (D) Analysis of top 100 branch-dependent genes determined based on clusters identified through pseudo-time analysis of SC-β Cells, found in Table S4. Scale: relative expression. (E) Relative expression level of selected β Cell genes along SC-β Cell pseudo-time. (F) Gene expression heatmap of select β Cell genes focused on function and maturation along pseudo-time. Scale: normalized expression. See also Figure S3 and Table S4.
Figure 4.
Figure 4.. Grafted SC-β Cells Resemble Primary Human β Cells Compared to Stage 6 SC-β Cells
(A) Unsupervised tSNE projection from 10 islet datasets including stage 6 hiPSC- and hESC-islets, three grafted hESC-islets, two grafted hiPSC-islets, and three primary HIs. (B) Individual location of different samples within combined tSNE projection. (C) Volcano plot displaying FC differences of β Cell genes between grafted SC-β (left) and HI β Cells (right). Dashed lines are drawn to define restriction of log FC value of 0.25 and −log of adjusted p value 0.001. Key β Cell genes are labeled and colored red. (D) Heatmap showing gene expression values for stage 6, grafted SC-β, and primary HI (donor) β Cells of the 100 most differentially expressed genes between stage 6 and grafted SC-β Cells listed in Table S6. Scale: normalized expression. (E) Pearson correlation matrix and hierarchical clustering to identify most similar populations among all β Cell samples using top 430 variable genes. Pearson correlation values detailed in Table S6. Scale: correlation coefficient. See also Figure S4 and Tables S4, S5, and S6.
Figure 5.
Figure 5.. Single-Cell Transcriptome and Pseudo-Time Analysis Indicates Stage 6 SC-α Cells Mature during Transplantation to More Closely Resemble HI α cells
(A) Heatmap of GCG gene expression to distinguish SC-α cell populations within tSNE plot from Figure 4A. (B) Normalized gene expression values for two stage 6 SC-α, five grafted SC-α, and three primary HI (donor) α cells of the 100 most differentially expressed genes between stage 6 and grafted SC-α cells listed in Table S6. Scale: normalized expression. (C) Volcano plot displaying FC differences of α cell genes between grafted SC-α (left) and HI α cells (right). Dashed lines are drawn to define restriction of log FC value of 0.25 and −log of adjusted p value 0.001. Key α cell genes are labeled and colored red. (D) Pearson correlation matrix and hierarchical clustering to identify most similar populations among all α cell samples using top 430 variable genes. Pearson correlation values detailed in Table S6. Scale: correlation coefficient. (E) Normalized expression values for key α cell identity, function, and newly identified genes among stage 6 SC-α, grafted SC-α, and primary human α cells. Percentage of cells positive for designated gene is represented by circle size, and saturation indicates low (gray) or high (blue) expression of the gene. (F) Immunostaining of stage 6 and 6-month kidney graft containing SC-islets for α cell markers. Scale bar, 50 μm. (G and H) Pseudotime trajectory (G) and distribution (H) of SC-α cells from seven hPSC-α samples. (I) Relative expression level of selected α cell genes along SC-α cell pseudo-time. Scale: relative expression. Each dot represents a different cell. See also Figure S5 and Tables S3, S4, and S6.
Figure 6.
Figure 6.. Analysis of Pseudo-Time and Single-Cell Transcriptomes of Stage 6 hPSC-ECs and Grafted hPSC-EC Cells Following Trans plantation
(A) Heatmap of TPH1 gene expression to distinguish SC-EC cell population within tSNE plot from Figure 4A. (B) Gene expression values for two stage 6 SC-EC cells and five grafted SC-EC cells for the 100 most differentially expressed genes between stage 6 and grafted SC-EC cells listed in Table S6. Scale: normalized expression. (C) Pearson correlation matrix and hierarchical clustering to identify most similar populations among all EC cell samples using top 430 variable genes. Scale: correlation coefficient. (D) Expression values for key EC cell identity, function, development, and newly identified genes between stage 6 and grafted SC-EC cells. (E) Immunostaining of stage 6 and 6-month kidney graft containing SC-islets for EC cell marker TPH1. Scale bar, 50 μm. (F and G) Distribution (F) of SC-EC cells along pseudo-time trajectory (G) from seven SC-EC samples. (H) Relative expression of select EC cell genes along SC-EC cell pseudo-time. Scale: relative expression. Each dot represents a different cell. TPH1, tryptophan hydroxylase 1. See also Figure S6 and Table S4.

Comment in

References

    1. Aguayo-Mazzucato C, and Bonner-Weir S (2010). Stem cell therapy for type 1 diabetes mellitus. Nat. Rev. Endocrinol 6, 139–148. - PubMed
    1. Atkinson MA, Eisenbarth GS, and Michels AW (2014). Type 1 diabetes. Lancet 383, 69–82. - PMC - PubMed
    1. Augsornworawat P, and Millman JR (2020). Single-cell RNA sequencing for engineering and studying human islets. Curr. Opin. Biomed. Eng 16, 27–33. - PMC - PubMed
    1. Augsornworawat P, Velazco-Cruz L, Song J, and Millman JR (2019). A hydrogel platform for in vitro three dimensional assembly of human stem cell-derived islet cells and endothelial cells. Acta Biomater. 97, 272–280. - PMC - PubMed
    1. Balboa D, Saarimäki-Vire J, Borshagovski D, Survila M, Lindholm P, Galli E, Eurola S, Ustinov J, Grym H, Huopio H, et al. (2018). Insulin mutations impair beta-cell development in a patient-derived iPSC model of neonatal diabetes. eLife 7, e38519. - PMC - PubMed

Publication types