. 2020 Sep 17;182(6):1519-1530.e17.
doi: 10.1016/j.cell.2020.07.035. Epub 2020 Aug 25.

Optical Mapping of cAMP Signaling at the Nanometer Scale

Affiliations

Optical Mapping of cAMP Signaling at the Nanometer Scale

Andreas Bock et al. Cell. .

Erratum in

  • Optical Mapping of cAMP Signaling at the Nanometer Scale.
    Bock A, Annibale P, Konrad C, Hannawacker A, Anton SE, Maiellaro I, Zabel U, Sivaramakrishnan S, Falcke M, Lohse MJ. Bock A, et al. Cell. 2021 May 13;184(10):2793. doi: 10.1016/j.cell.2021.04.043. Cell. 2021. PMID: 33989549 No abstract available.

Abstract

Cells relay a plethora of extracellular signals to specific cellular responses by using only a few second messengers, such as cAMP. To explain signaling specificity, cAMP-degrading phosphodiesterases (PDEs) have been suggested to confine cAMP to distinct cellular compartments. However, measured rates of fast cAMP diffusion and slow PDE activity render cAMP compartmentalization essentially impossible. Using fluorescence spectroscopy, we show that, contrary to earlier data, cAMP at physiological concentrations is predominantly bound to cAMP binding sites and, thus, immobile. Binding and unbinding results in largely reduced cAMP dynamics, which we term "buffered diffusion." With a large fraction of cAMP being buffered, PDEs can create nanometer-size domains of low cAMP concentrations. Using FRET-cAMP nanorulers, we directly map cAMP gradients at the nanoscale around PDE molecules and the areas of resulting downstream activation of cAMP-dependent protein kinase (PKA). Our study reveals that spatiotemporal cAMP signaling is under precise control of nanometer-size domains shaped by PDEs that gate activation of downstream effectors.

Keywords: FRET biosensors; G protein-coupled receptors; buffered diffusion; cell signaling; compartmentation; cyclic AMP; fluorescence fluctuation spectroscopy; nanodomains; phosphodiesterase; protein kinase A4.


Conflict of interest statement

Declaration of Interests The authors declare no competing interests.

Figures
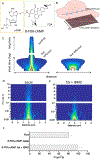
Figure 1.
Figure 1.. cAMP dynamics are highly restricted in intact cells.
(A) Molecular structure of fluorogenic 8-FDA-cAMP. Arrows highlight sites where intracellular esterases cleave both ester bonds. (B) Linescan approach used in our experiments. The focused laser beam (blue ellipsoids) is repeatedly scanned along the cell cytosol, giving rise to a kymograph containing the 8-FDA-cAMP fluorescence fluctuations (see STAR Methods) (C) Two simulated STICS functions are schematically illustrated, referring to fast (100 μm2/s) diffusion rates combined with binding (left) and fast diffusion rates alone (right). x-axis refers to the spatial, y-axis to the temporal dimension. (D) Average STICS function (11 different cells, three independent experiments) measured in the cytoplasm of intact HEK293 cells loaded for 30 min with 100 nM 8-FDA-cAMP under basal conditions. (E) Average STICS function (9 different cells, three independent experiments) measured in the cytoplasm of intact HEK293 cells loaded for 30 min with 100 nM 8-FDA-cAMP and stimulated for 5 min with fsk (10 μM)/IBMX (100 μM). (F) Measured diffusion coefficient in HEK293 cells extracted from the slope of the MSD in the range of 0–0.5 ms for FDA, 8-FDA-cAMP (from panel D) and 8-FDA-cAMP stimulated with fsk + IBMX (from panel E). Error bars are standard deviations.
Figure 2.
Figure 2.. cAMP dynamics are buffered via cAMP binding sites.
Average STICS function measured in a cytosol preparation of (A) HEK293 cells loaded for 30 min with 100 nM 8-FDA-cAMP (n=8). (B) as in (A) after the addition of unlabeled cAMP (100 μM) (n=6). (C) HEK293 cells expressing EGFP (n=6) and (D) HEK293 cells expressing the fusion protein Epac1-camps-PDE4A1 (n=4). (E) Relationship between molecular weight and diffusion coefficients. Orange crosses represent the diffusion coefficients extracted from the fit of the average STICS function (Eq. 1, STAR Methods) derived from panels (A-D) and FDA alone. The diffusion coefficients are plotted against the molecular weight of each compound. Red dots represent the theoretical diffusion coefficients based on the Stokes-Einstein relation D=KT6πηR. The power law dependence on the molecular weight (exponent = −0.3) is superimposed to the data as a blue dotted line.
Figure 3.
Figure 3.. Genetically-encoded nanorulers map cAMP gradients around single PDE molecules in intact cells.
(A,B) Design of FRET-based nanorulers to identify low cAMP nanodomains in intact cells. Tethering the FRET-based cAMP sensor Epac1-camps to a PDE allows measuring cAMP concentrations in the direct vicinity of a single PDE molecule (A). Incorporation of nanometer linkers based on single alpha helical domains between Epac1-camps and a PDE allows measuring the cAMP gradient at defined distances away from the PDE (B). (C) Isoproterenol (Iso, 10 μM) stimulation leads to an increase in cAMP levels which are detected by Epac1-camps (note upward-reflected trace). (D) When Epac1-camps and PDE4A1 are expressed at equimolar levels but not tethered, a rise in cAMP levels is still detected upon Iso stimulation. (E) However, when tethering PDE4A1 to Epac1-camps (which measures cAMP levels in direct vicinity of PDE4A1), no rise in cAMP is detected upon Iso stimulation. (F) Separating Epac1-camps and PDE4A1 with a 10 nm linker leads to a similar response than observed in the equimolar expression in (D). (C-F) Average traces of corrected and normalized FRET ratios in HEK293 cells transfected with Epac1-camps (C), Epac1-camps-IRES2-PDE4A1 (i.e. individual but roughly equimolar expression of sensor and PDE) (D), Epac1-camps-PDE4A1 (= tethered) (E), and Epac1-camps-SAH10nm-PDE4A1 (=10 nm distance) (F), treated consecutively with isoproterenol (Iso, 10 μM), the PDE4-inhibitor roflumilast (300 nM), and fsk (10 μM)/IBMX (100 μM). Traces are representative for 8, 13, 19, and 14 independent experiments, respectively. The solid lines indicate the mean, shaded areas the s.e.m. FRET traces are normalized to baseline (set to 0%) and maximal stimulation upon fsk/IBMX treatment (set to 100%). The inset in (C) shows the normalized, isoproterenol-induced FRET ratios from all cells expressing Epac1-camps (n=34). (G,H) Normalized, isoproterenol-induced (G) or roflumilast-induced (H) FRET ratios pooled from all cells measured as in (D-F). n=63 (Epac1-camps-IRES2-PDE4A1), 56 (Epac1-camps-PDE4A1), and 51 (Epac1-camps-SAH10nm-PDE4A1) cells. The columns represent means, the vertical bars s.e.m. ****P<0.0001, one-way analysis of variance (ANOVA, Tukey’s post-test), n.s. not significant.
Figure 4.
Figure 4.. Low cAMP nanodomains are PDE-subtype-specific.
(A) Iso stimulation leads to an increase in cAMP levels which are detected by Epac1-camps (note upward-reflected trace). (B) When Epac1-camps and PDE2cat are expressed at equimolar levels but not tethered, a rise in cAMP levels is still detected upon Iso stimulation. (C) However, when tethering PDE2cat to Epac1-camps, no rise in cAMP levels is detected upon Iso stimulation. (D) Separating Epac1-camps and PDE with a 30 nm linker leads to almost no Iso-induced FRET response similar to what is observed in (C). (A-D) Average traces of corrected and normalized FRET ratios in HEK293 cells transfected with Epac1-camps (A), Epac1-camps-IRES2-PDE2cat, leading to individual but roughly equimolar expression of the two proteins (B), Epac1-camps-PDE2cat (tethered) (C), and Epac1-camps-SAH30nm-PDE2cat (D), treated consecutively with isoproterenol (Iso, 10 μM), the PDE2-inhibitor BAY 60–7550 (100 nM), and fsk (10 μM)/IBMX (100 μM). Traces are representative for 3, 10, 11, and 14 independent experiments, respectively. The inset in (A) shows the normalized, isoproterenol-induced FRET ratios from all cells expressing Epac1-camps (n=12). The solid lines indicate the mean, shaded areas s.e.m. FRET traces are normalized to baseline (set to 0%) and maximal stimulation upon fsk/IBMX treatment (set to 100%). (E,F) Normalized, isoproterenol-induced (E) and BAY 60–7550-induced (F) FRET ratios pooled from all cells measured as in (B-D). n=28 (Epac1-camps-IRES2-PDE2cat), 30 (Epac1-camps-PDE2cat), and 25 (Epac1-camps-SAH30nm-PDE2cat) cells. The columns represent means, the vertical bars s.e.m. ****P<0.0001, ***P<0.001 one-way analysis of variance (ANOVA, Tukey’s post-test), n.s. not significant.
Figure 5.
Figure 5.. Low cAMP nanodomains stay intact in cytosolic cell preparations and become ‘flooded’ at micromolar cAMP.
(A,B) Shown are concentration-effect curves of cAMP-induced changes in FRET ratio normalized to buffer (set to 0%) and 1 mM cAMP (set to 100%). (A) Tethering PDE4A1 (blue curve) to Epac1-camps (black curve) leads to a pronounced right-shift of the concentration-effect curve, much more than stoichiometric overexpression of Epac1-camps and PDE4A1 (+PDE4A1, green curve). The difference in the EC50-values between the green (global PDE activity) and blue curves (local PDE activity) is a biochemical equivalent to the cAMP nanodomain. Separating Epac1-camps and PDE4A1 by 10 nm (Epac1-camps-SAH10nm-PDE4A1) does not generate a low cAMP nanodomain (turquoise curve). Note that the turquoise curve (cAMP at 10 nm distance from the PDE) and the green curve (global PDE activity) are superimposable. (B) Tethering PDE2cat (red curve) to Epac1-camps (black curve) leads to a pronounced right-shift of the concentration-effect curve, significantly more than individual stoichiometric expression of Epac1-camps and PDE2cat (yellow curve). Separating Epac1-camps and PDE2cat by 30 nm (Epac1-camps-SAH30nm-PDE2cat, orange curve) only partially restores the cAMP gradient. Note that the orange line (cAMP at 30 nm distance from the PDE) is in between the dashed yellow (global PDE activity) and red lines (local PDE activity). Data in (A,B) are means ± s.e.m. of at least three independent experiments. (C) Apparent cAMP EC50 values derived from the data in (A, B). The mean EC50 of Epac1-camps is shown as a solid black line. Bars show the mean cAMP EC50 values for stoichiometric expression of Epac1-camps plus PDE4A1/PDE2cat expressed separately (+), with tethered PDE4A1 or PDE2cat, respectively (tethered), and at a distance of 10 and 30 nm from the PDEs (10 nm and 30 nm). Error bars show the 95% confidence intervals of the mean.
Figure 6.
Figure 6.. Low cAMP nanodomains dictate local PKA activity.
(A) Design of nanodomain-targeted PKA activity reporters. (B-D) The PDE4A1/cAMP nanodomain completely blunts local PKA-dependent phosphorylation. Average traces of corrected and normalized FRET ratios in HEK293 cells transfected with AKAR4 (B) and AKAR4-PDE4A1 (C), treated consecutively with isoproterenol (Iso, 10 μM), roflumilast (300 nM, in (C) only), and fsk (10 μM)/IBMX (100 μM). Traces are representative for 3 and 5 independent experiments, respectively. The solid lines indicate the mean, shaded areas the s.e.m. FRET-traces are normalized to baseline (set to 0%) and maximal stimulation upon fsk/IBMX treatment (set 100%). (D) Normalized, isoproterenol-induced FRET ratios pooled from all cells measured as in (B,C). n=20 (AKAR4) and 22 (AKAR4-PDE4A1) cells. The horizontal bars represent means, the vertical bars s.e.m. ****P<0.0001, unpaired t-test. (E-G) Local cAMP pools spatially overlap with local PKA phosphorylation. (E, F) Average time courses of corrected and normalized FRET ratios in HEK293 cells transfected with Epac1-camps-PDE2A3 (E) and AKAR4-PDE2A3 (F), treated consecutively with isoproterenol (Iso, 10 μM), BAY 60–7550 (100 nM), and fsk (10 μM)/IBMX (100 μM). Time courses are representative of 8 and 7 independent experiments, respectively. The solid lines indicate the mean, shaded areas s.e.m. FRET traces are normalized to baseline (set to 0%) and maximal stimulation upon forskolin/IBMX treatment (set to 100%). (G) Normalized, isoproterenol-induced FRET ratios pooled from all cells measured as in (E,F). n=32 (Epac1-camps-PDE2A3) and 35 (AKAR4-PDE2A3) cells. The horizontal bars represent means, the vertical bars s.e.m.
Figure 7.
Figure 7.. Model of cAMP signaling at the nanoscale.
(A) Schematic illustration of buffered diffusion of cAMP and formation of low cAMP nanodomains under basal (left) and stimulated conditions (right). The presence of a large concentration of cAMP binding sites (illustrated as honeycombs) (Figure S4) lowers the concentration of free cAMP (red dots). The low concentration of free cAMP enables phosphodiesterases to establish nanometer-sized domains where the local cAMP concentration is decreased to a range below the activation threshold of local cAMP effectors (lower panels). Upon stimulation (right panel), cAMP binding sites become progressively saturated and, as a consequence, the width and depth of these nanodomains is decreased, eventually leading to “flooding” and activation of local cAMP effectors. (B) The spatial cAMP concentration profile (red line) around a PDE4A1 molecule as inferred from experiments (Figure 3) and quantitative considerations (Methods S2). The red line shows the free cAMP concentration profile generated by a PDE4A1 dimer with a turnover rate of ~160 molecules/s/PDE4A1. The gray shaded area illustrates the range of possible profiles from experimental values (Methods S2). The open blue circles represent the measured mean values of free cAMP concentration at the PDE4A1 (data from Figure 3E), at 10 nm distance of the PDE (data from Figure 3F), and in bulk cytosol (data from Figure 3D). Error bars represent 95% confidence intervals. The black line indicates the cAMP concentration profile around a perfect absorber (Methods S2, Eq. 3). The inset shows the same data with a linear x-axis.

Comment in

References

    1. AGARWAL SR, CLANCY CE & HARVEY RD 2016. Mechanisms Restricting Diffusion of Intracellular cAMP. Sci Rep, 6, 19577. - PMC - PubMed
    1. ANNIBALE P & LOHSE MJ 2020. Spatial heterogeneity in molecular brightness. Nat Methods, 17, 273–275. - PubMed
    1. ARRIO-DUPONT M, CRIBIER S, FOUCAULT G, DEVAUX PF & D’ALBIS A 1996. Diffusion of fluorescently labeled macromolecules in cultured muscle cells. Biophys J, 70, 2327–32. - PMC - PubMed
    1. BACSKAI BJ, HOCHNER B, MAHAUT-SMITH M, ADAMS SR, KAANG BK, KANDEL ER & TSIEN RY 1993. Spatially resolved dynamics of cAMP and protein kinase A subunits in Aplysia sensory neurons. Science, 260, 222–6. - PubMed
    1. BATHE-PETERS M, GMACH P, ANNIBALE P & LOHSE MJ 2020. Linescan microscopy data to extract diffusion coefficient of a fluorescent species using a commercial confocal microscope. Data Brief, 29, 105063. - PMC - PubMed

Publication types

MeSH terms

Substances