. 2020 Sep 17;182(6):1531-1544.e15.
doi: 10.1016/j.cell.2020.07.043. Epub 2020 Aug 25.

Phase Separation of a PKA Regulatory Subunit Controls cAMP Compartmentation and Oncogenic Signaling

Affiliations

Phase Separation of a PKA Regulatory Subunit Controls cAMP Compartmentation and Oncogenic Signaling

Jason Z Zhang et al. Cell. .

Abstract

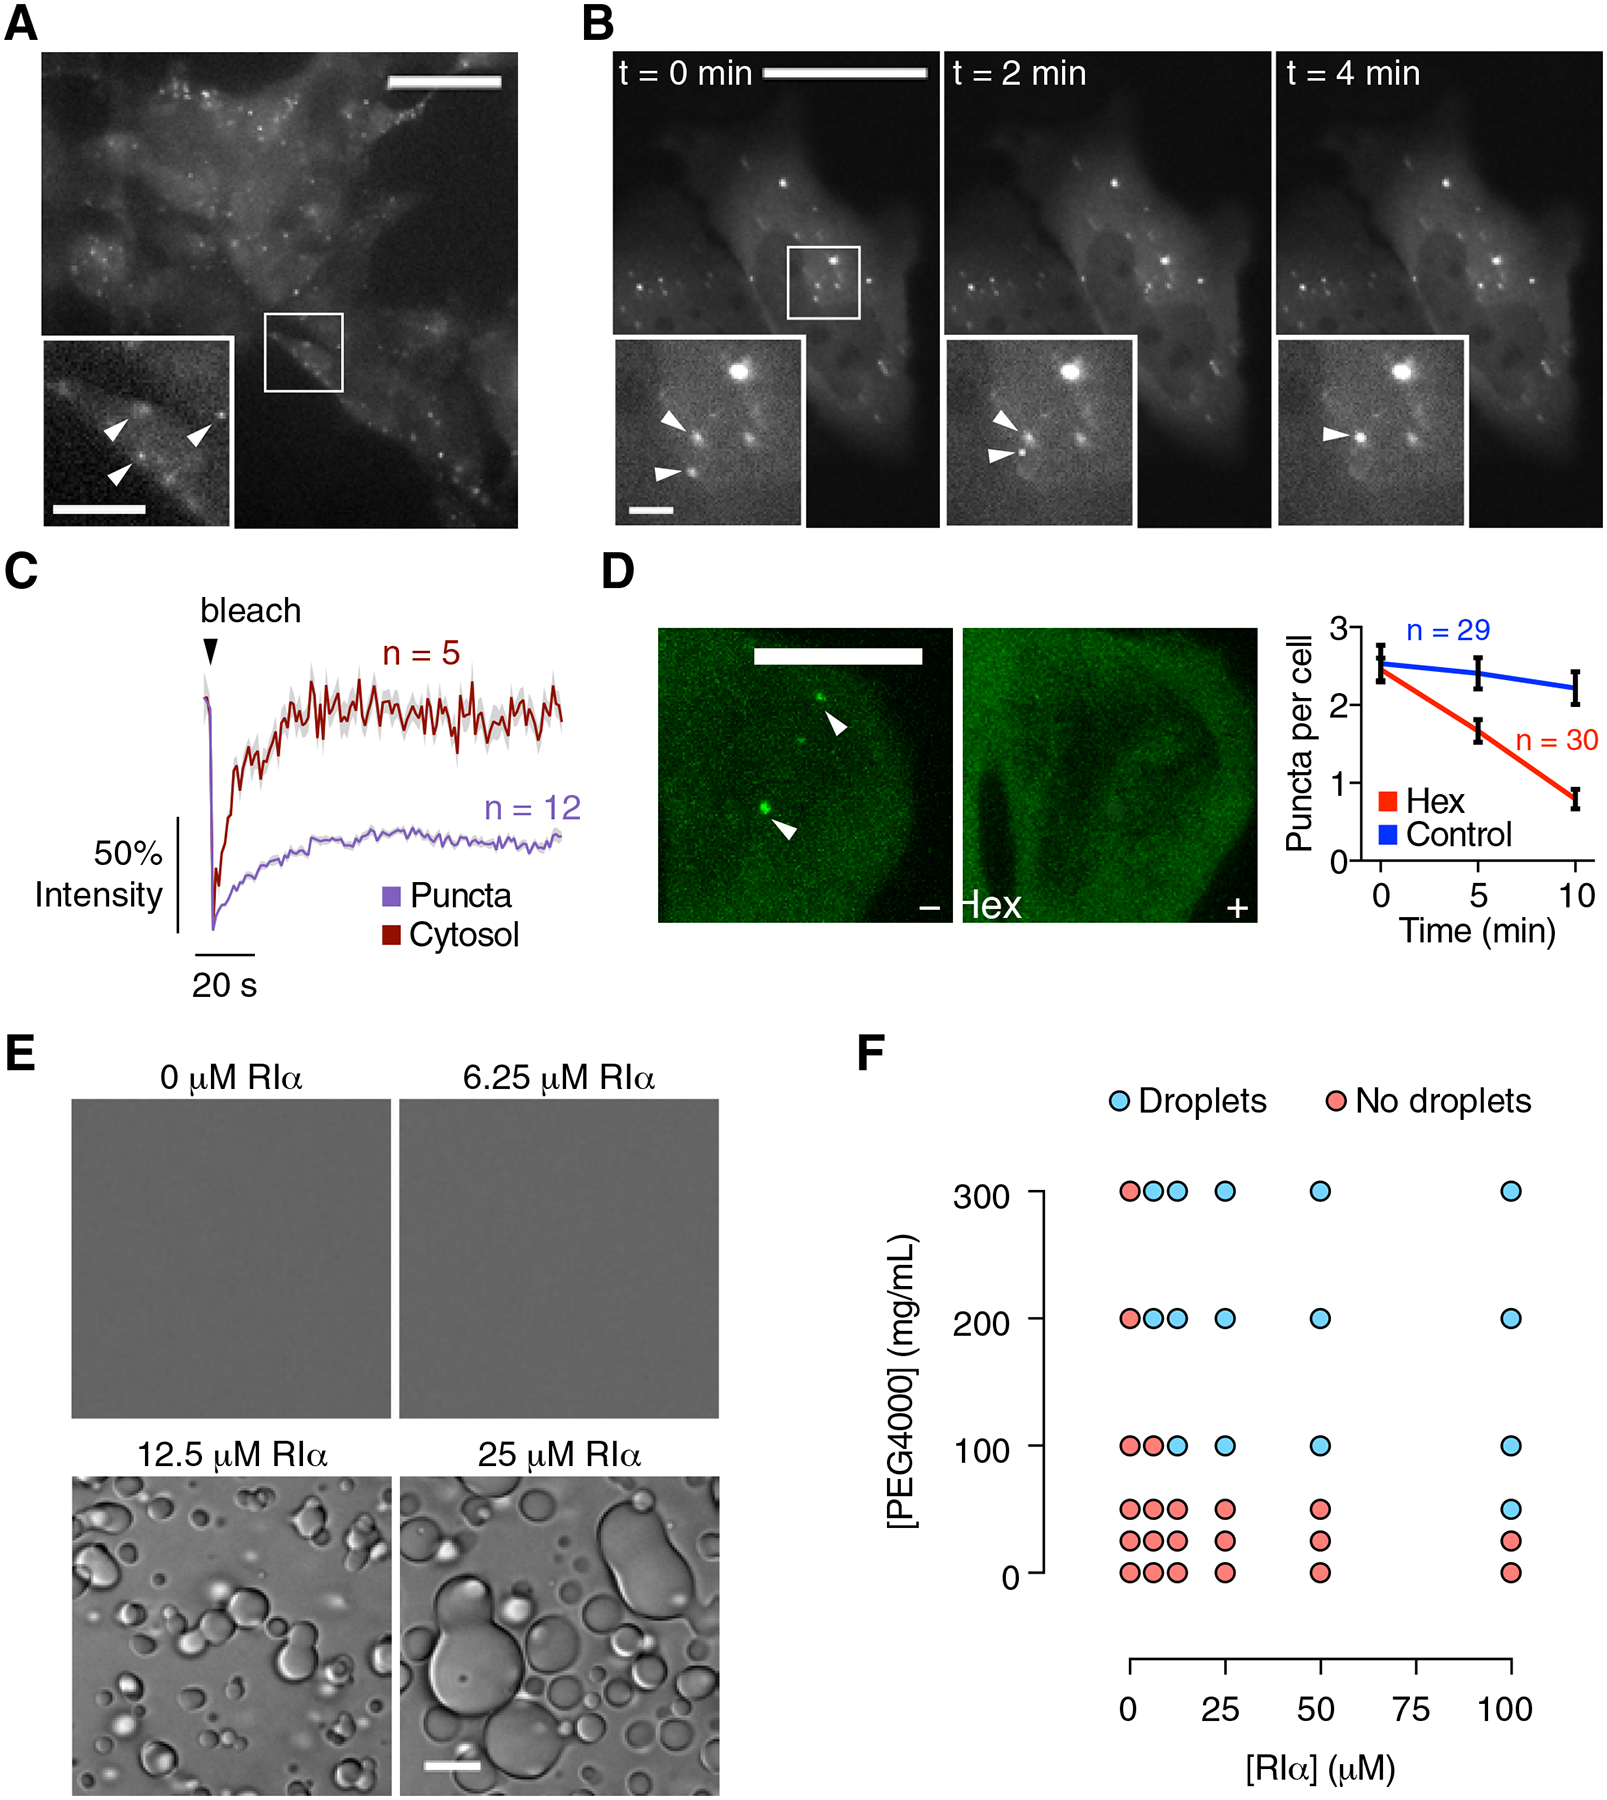
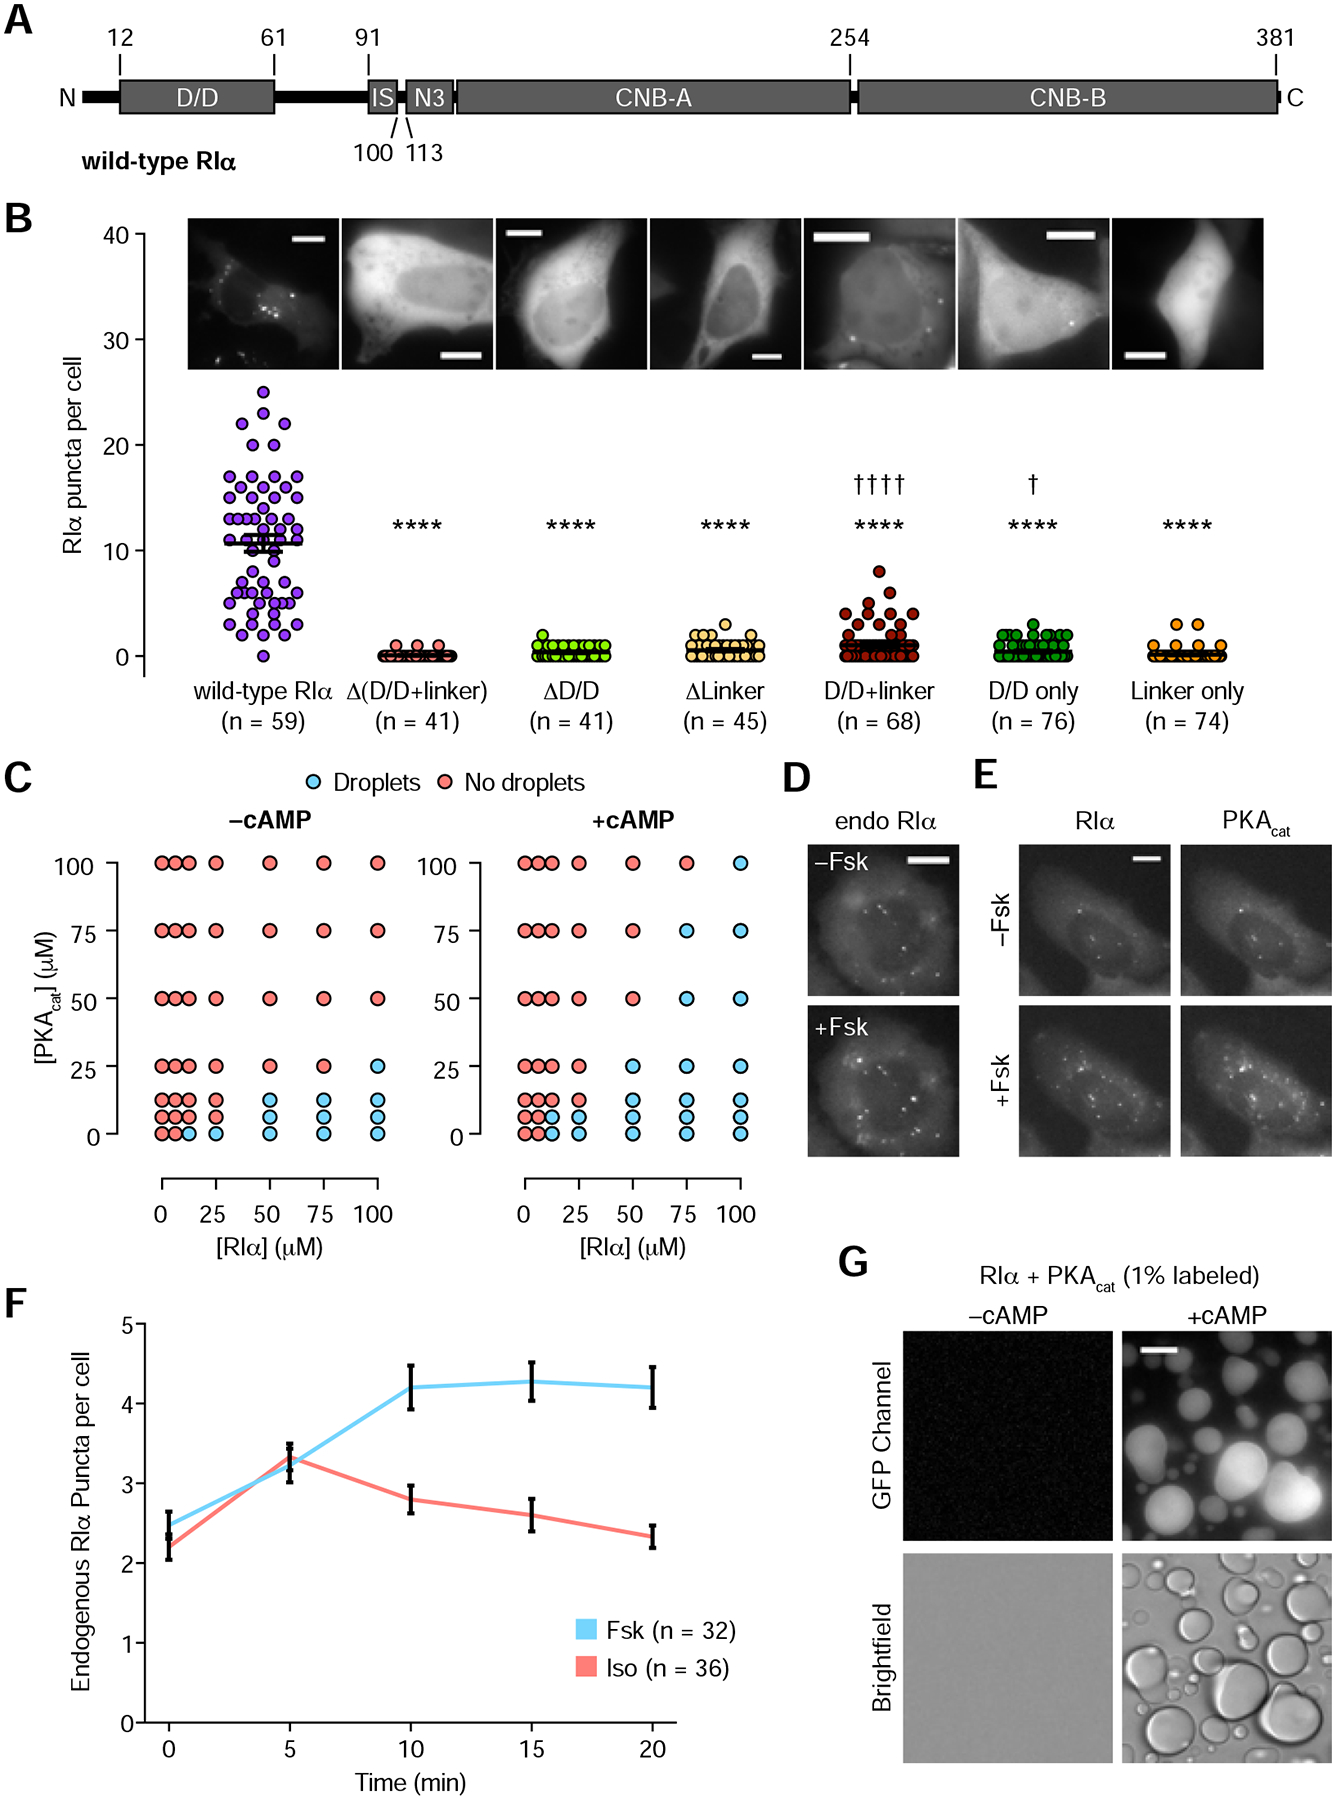
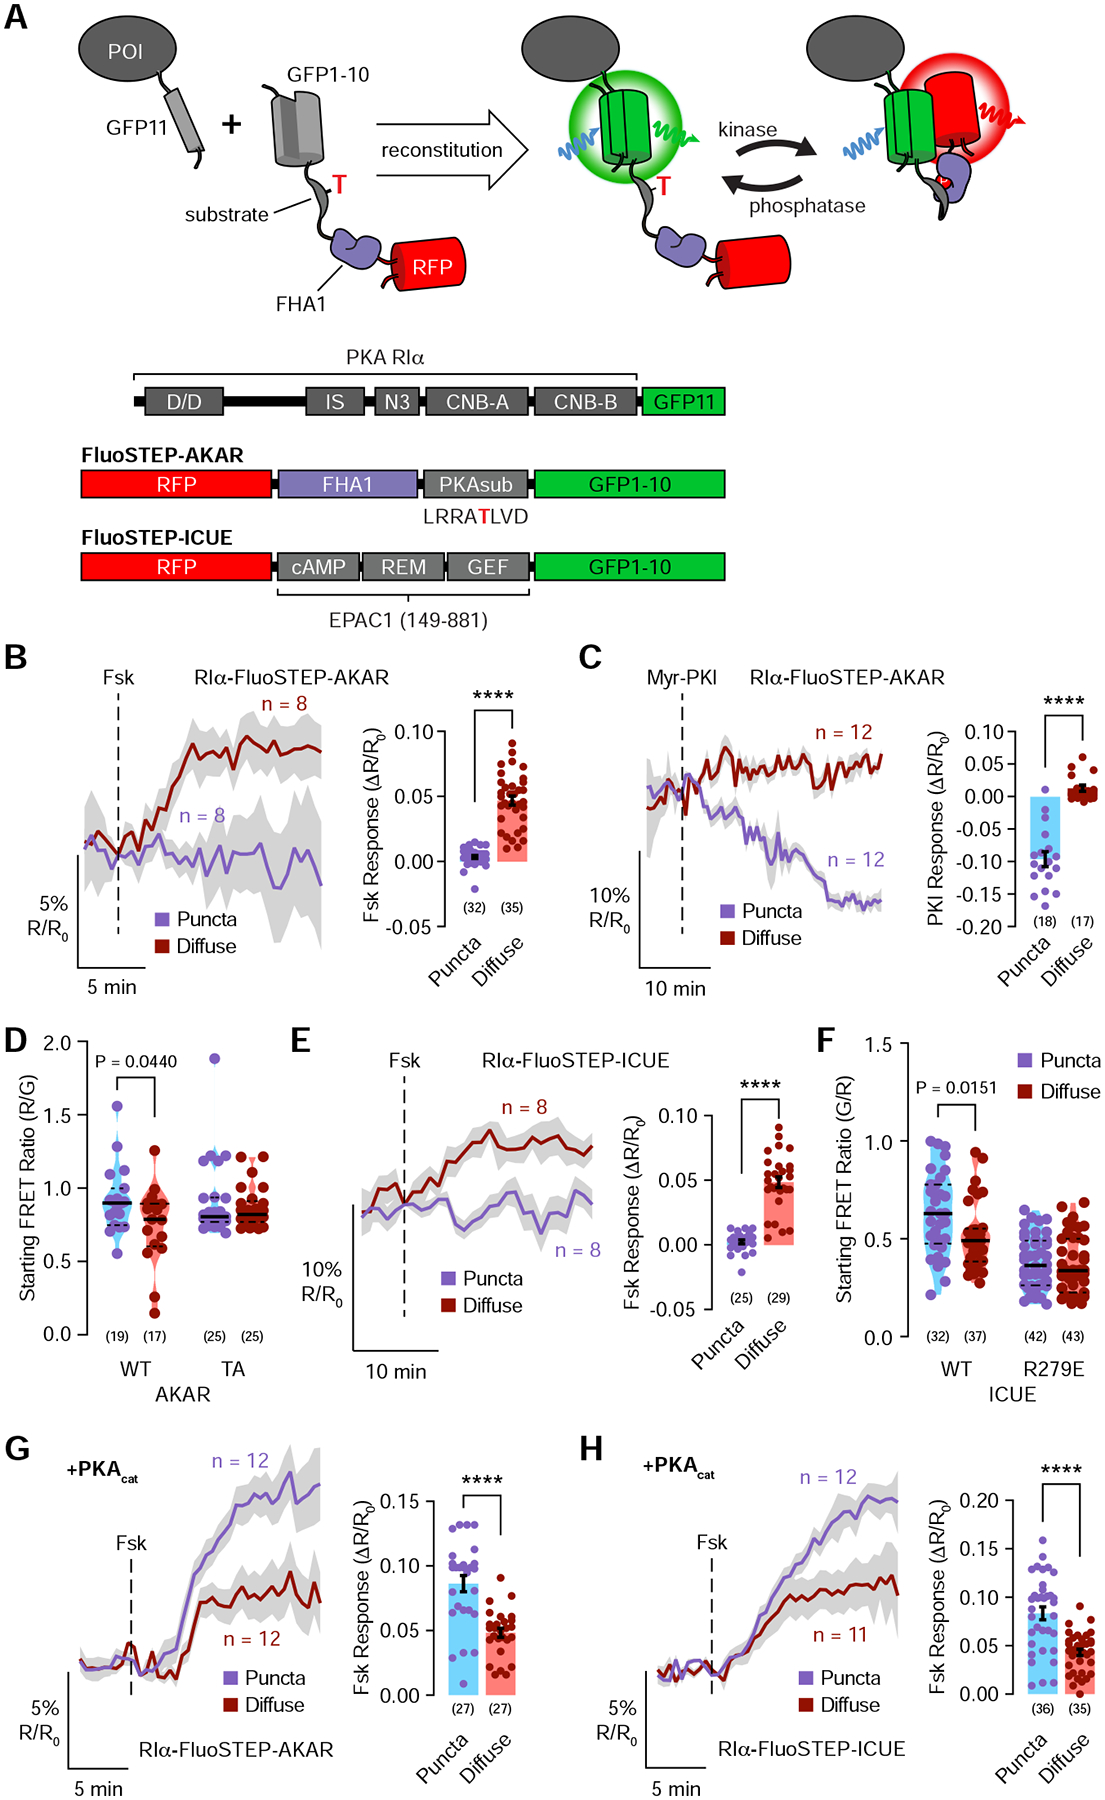
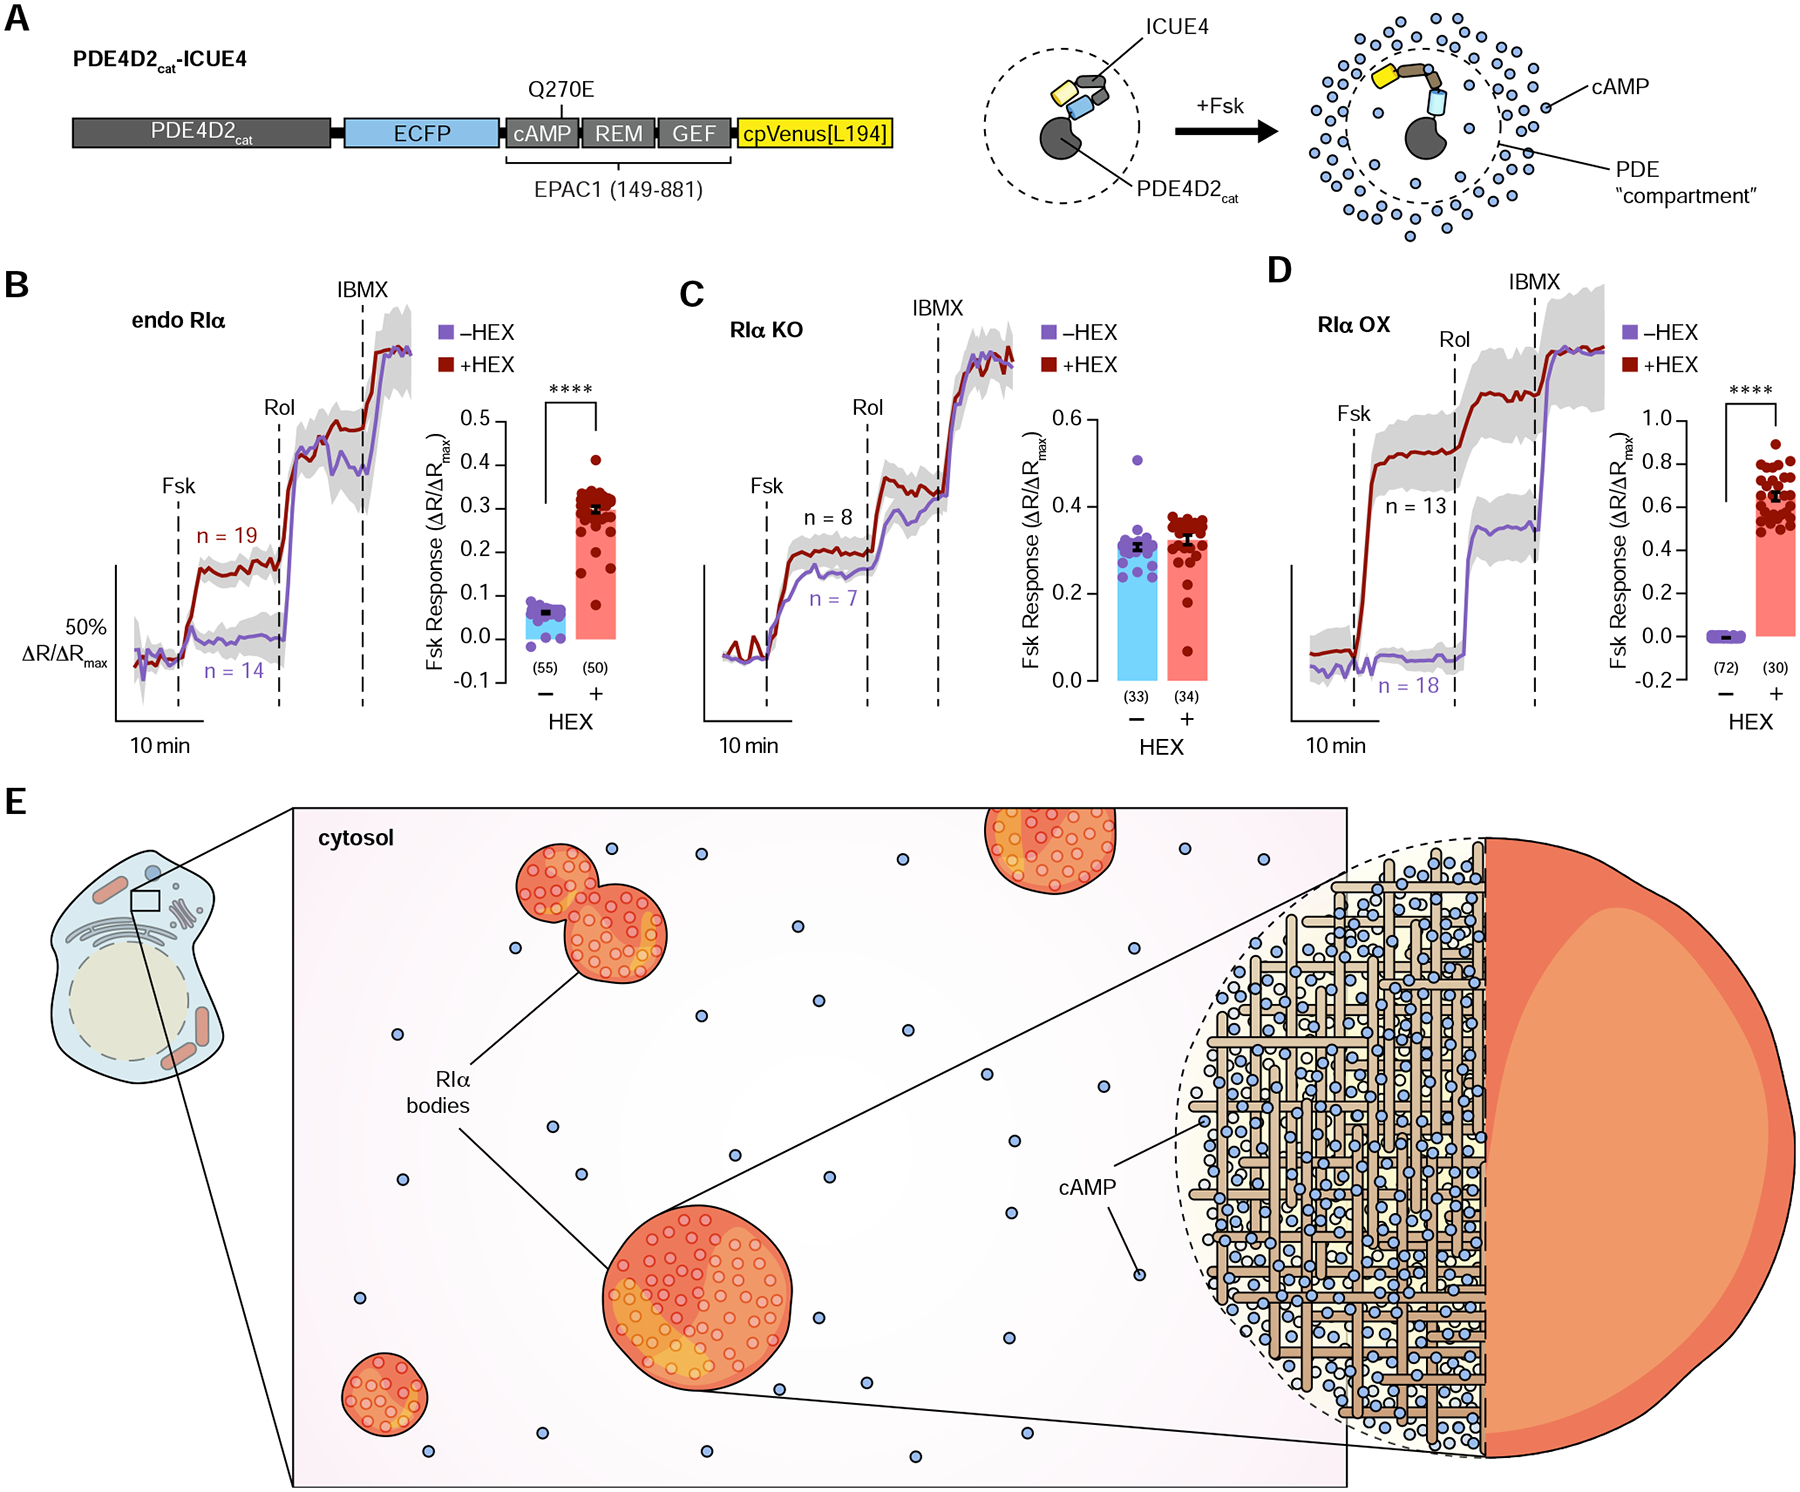
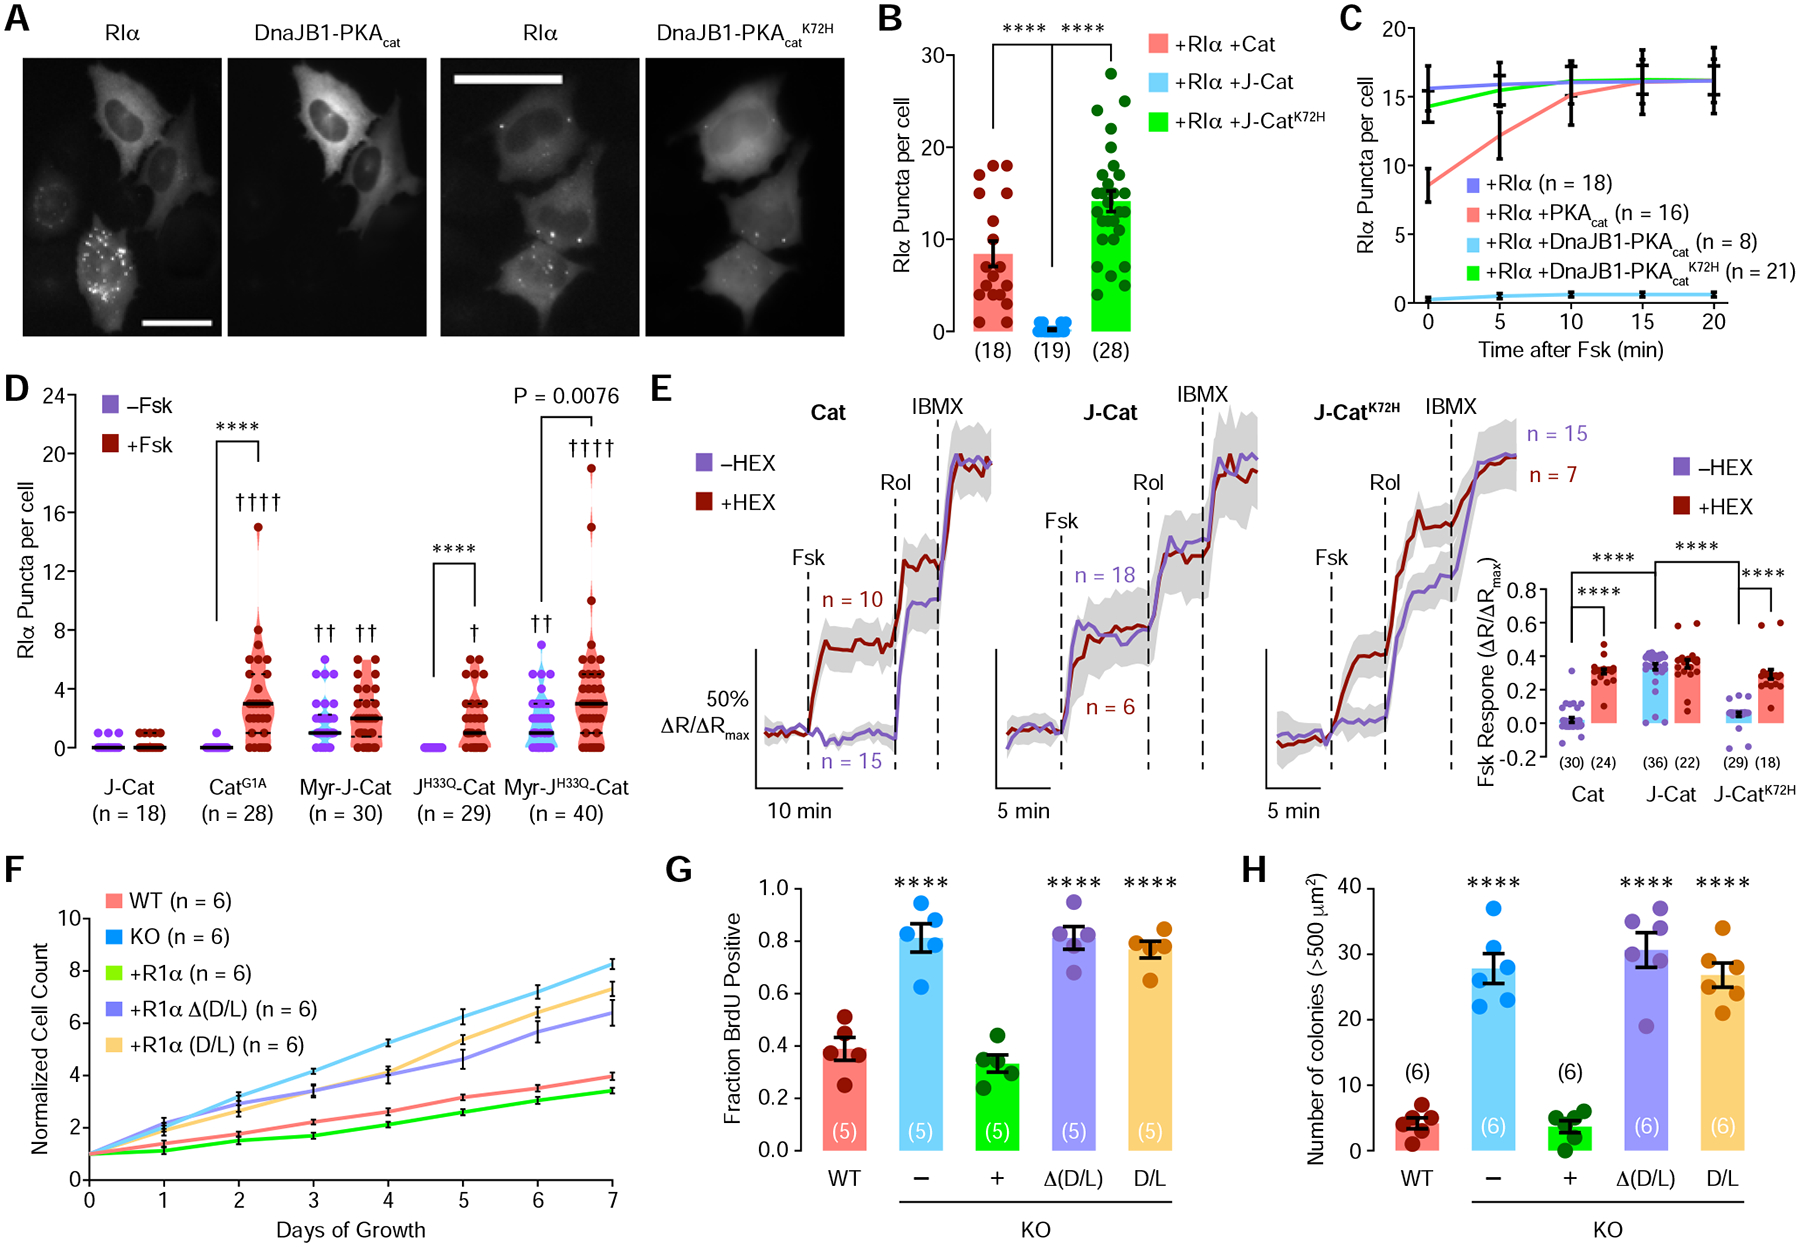
The fidelity of intracellular signaling hinges on the organization of dynamic activity architectures. Spatial compartmentation was first proposed over 30 years ago to explain how diverse G protein-coupled receptors achieve specificity despite converging on a ubiquitous messenger, cyclic adenosine monophosphate (cAMP). However, the mechanisms responsible for spatially constraining this diffusible messenger remain elusive. Here, we reveal that the type I regulatory subunit of cAMP-dependent protein kinase (PKA), RIα, undergoes liquid-liquid phase separation (LLPS) as a function of cAMP signaling to form biomolecular condensates enriched in cAMP and PKA activity, critical for effective cAMP compartmentation. We further show that a PKA fusion oncoprotein associated with an atypical liver cancer potently blocks RIα LLPS and induces aberrant cAMP signaling. Loss of RIα LLPS in normal cells increases cell proliferation and induces cell transformation. Our work reveals LLPS as a principal organizer of signaling compartments and highlights the pathological consequences of dysregulating this activity architecture.

Keywords: DnaJB1-PKA; FLC; FRET; biosensor; fibrolamellar carcinoma; live cell imaging; membraneless organelle; signal transduction; split GFP.


Conflict of interest statement

Declaration of Interests The authors declare no competing interests.

Figures

Figure 1.
Figure 1.. Endogenous PKA regulatory subunit RIα undergoes phase separation.
(A) Observing the localization of endogenously expressed RIα. The 11th β-strand of GFP (FP11) was knocked-in at the C-terminus of RIα in HEK293A cells. Transfecting these 293-RIα cells with the remaining GFP β-strands (GFP1–10) and imaging them in the GFP channel revealed the formation of fluorescent RIα puncta. (B) Representative GFP fluorescence images of 293-RIα cells transfected with GFP1–10 show merging of endogenous RIα puncta. (C) Monitoring the dynamics of labeled RIα. FRAP of RIα puncta (blue curve) compared with diffuse RIα (red curve) in GFP1–10-transfected 293-RIα cells. Curves show average time course of normalized fluorescence intensity. Solid lines indicate the mean; shaded areas, SEM. (D) RIα puncta disruption by 1,6-hexanediol. Representative GFP fluorescence images of GFP1–10-transfected 293-RIα cells before (t = 0 min; left) and after (t = 10 min; middle) 2.5% 1,6-hexanediol addition. Quantification of the number of RIα puncta per cell at the indicated times with (Hex; red curve) or without (Control; blue curve) 1,6-hexanediol addition. Error bars indicate ± SEM. (E) Representative DIC images showing liquid droplet formation by purified RIα at the indicated concentrations in vitro. (F) Representative in vitro phase diagram of RIα liquid droplet formation at varying concentrations of PEG 4000. Each condition was assessed at least twice. Scale bars: (A) 30 μm (inset, 10 μm); (B) 30 μm; (inset, 1 μm); (E) 10 μm.
Figure 2.
Figure 2.. Regulation of RIα phase separation by PKA catalytic subunit and cAMP.
(A) Domain structure of full-length, wild-type RIα. (B) Comparison of RIα puncta number in wild-type HEK293T cells expressing EGFP-tagged wild-type or mutant RIα. The D/D domain (residues 12–61), the linker region (62–113), or both (12–113) were either deleted or overexpressed. Horizontal lines indicate mean ± SEM. Representative fluorescence images of HEK293T cells transfected with the corresponding EGFP-tagged RIα constructs are shown above each bar. (C-G) cAMP enhances RIα phase separation in the presence of PKAcat. (C) Representative in vitro phase diagram of RIα liquid droplet formation as a function of RIα and PKAcat concentration in the presence (right) or absence (left) of 10 μM cAMP. Each condition was assessed at least twice. (D) Representative fluorescence images of GFP1–10-transfected 293-RIα cells before (t = 0; top) and after (t = 10 min; bottom) addition of 50 μM Fsk. (E) Representative fluorescence images of wild-type HEK293T cells transfected with EGFP-RIα (left) and mTagBFP2-PKAcat (right) shown before (t = 0; top) and after (t = 10 min; bottom) addition of 50 μM Fsk. (F) Average time courses of the number of RIα puncta per cell in 293-RIα cells transfected with GFP1–10 and treated with 50 μM Fsk (blue curve) or 10 μM isoproterenol (Iso) (red curve). Error bars indicate ± SEM. (G) Representative GFP (top) and DIC (bottom) images of 50 μM RIα mixed with 25 μM PKAcat (1% GFP-tagged), showing PKAcat in RIα liquid droplets without (left) and with (right) 10 μM cAMP. All scale bars, 10 μm.
Figure 3.
Figure 3.. Endogenous RIα condensates form cAMP/PKA compartments and enable PDE-mediated cAMP compartmentation.
(A) Left: Fluorescent Sensors Targeted to Endogenous Proteins (FluoSTEPs) utilize split-GFP complementation to recruit a biosensor (e.g., FluoSTEP-AKAR) to a protein of interest (POI) expressed at endogenous levels. Right: Domain structures of RIα-GFP11, FluoSTEP-AKAR, and FluoSTEP-ICUE. (B-F) Basal PKA activity and cAMP levels within RIα phase-separated bodies are high enough to saturate FluoSTEP responses prior to stimulation. (B and C) Left: Red/green (R/G) emission ratio changes in 293-RIα cells transfected with FluoSTEP-AKAR and stimulated with either 50 μM Fsk (B) or 20 μM myristoylated-PKI (Myr-PKI) (C). RIα puncta (blue curve) and non-puncta regions (red curve) were analyzed separately. Right: Response to Fsk (B) (n = 32 puncta and 35 diffuse regions from 32 cells) or Myr-PKI (C) treatment. (D) Raw starting emission ratios for FluoSTEP-AKAR and FluoSTEP-AKAR T/A. RIα puncta and non-puncta regions were analyzed separately (WT AKAR: n = 19 puncta and 17 diffuse regions from 17 cells; AKAR T/A: n = 25 puncta and 25 diffuse regions from 25 cells). (E) Left: Green/red (G/R) emission ratio changes in 293-RIα cells transfected with FluoSTEP-ICUE and stimulated with 50 μM Fsk. RIα puncta (blue curve) and non-puncta regions (red curve) were analyzed separately. Right: Response to Fsk stimulation. (F) Raw starting emission ratios for FluoSTEP-ICUE and FluoSTEP-ICUE R279E (WT ICUE: n = 32 puncta and 37 diffuse regions from 32 cells; ICUE R279E: n = 42 puncta and 43 diffuse regions from 42 cells). (G and H) Left: R/G (G) or G/R (H) emission ratio changes in 293-RIα cells transfected with FluoSTEP-AKAR (G) or FluoSTEP-ICUE (H) plus mTagBFP2-PKAcat and stimulated with 50 μM Fsk. Newly formed RIα puncta regions (blue curve) and non-puncta regions (red curve) were analyzed separately (FluoSTEP-AKAR: n = 12 new puncta and 12 diffuse regions from 12 cells; FluoSTEP-ICUE: n = 11 new puncta and 12 diffuse regions from 11 cells). Right: Responses to Fsk stimulation (FluoSTEP-AKAR: n = 27 new puncta and 27 diffuse regions from 27 cells; FluoSTEP-ICUE: n = 35 new puncta and 36 diffuse regions from 35 cells). Solid lines in B, C, E, G, and H indicate representative average time courses of either R/G (B, C, and G) or G/R (D and H) emission ratio changes; shaded areas, SEM. Bar graphs in B, C, E, G, and H show maximum emission ratio changes upon drug addition, with bars indicating mean ± SEM. Violin plots in D and F show the median and quartiles as solid and dashed lines, respectively.
Figure 4.
Figure 4.. Dynamic cAMP buffering by RIα condensates drives cAMP compartmentation
(A) Domain structure of the PDE4D2cat-ICUE4 sensor, which is used to measure cAMP levels within the PDE4D2 compartment. (B-D) Investigating the formation of PDE-mediated cAMP sinks with and without RIα phase separation. Left: Representative average time courses of cyan/yellow (C/Y) emission ratio changes (normalized to maximum) in wild-type HEK293T cells transfected with PDE4D2cat-ICUE4 (endo RIα) (B), RIα null HEK293T cells transfected with PDE4D2cat-ICUE4 (RIα KO) (C), or HEK293T cells co-transfected with PDE4D2cat-ICUE4 and mRuby2-RIα (RIα OX) (D). Cells with (red curve) or without (blue curve) 2.5% 1,6-hexanediol pretreatment were stimulated with 50 μM Fsk, 1 μM rolipram (Rol), and 100 μM IBMX. Right: Maximum normalized emission ratio upon Fsk stimulation. Solid lines in B-D indicate the mean; shaded areas, SEM. Bars in B-D indicate mean ± SEM. (E) Schematic illustration of cAMP buffering via RIα phase separation. RIα droplets dynamically sequester cAMP, effectively buffering cAMP in the cytosol.
Figure 5.
Figure 5.. The FLC oncoprotein DnaJB1-PKAcat disrupts RIα phase separation and cAMP compartmentation, resulting in increased cell proliferation and transformation.
(A) Representative fluorescence images of HEK293T cells transfected with EGFP-tagged RIα and either mTagBFP2-tagged DnaJB1-PKAcat (left) or DnaJB1-PKAcatK72H (right). Scale bars, 40 μm. (B) Average number of RIα puncta per cell in HEK293T cells co-transfected with EGFP-RIα and mTagBFP2-tagged PKAcat (Cat), DnaJB1-PKAcat (J-Cat), or DnaJB1-PKAcatK72H (J-CatK72H). (C) Average time course of the number of RIα puncta per cell following 5 μM Fsk addition to HEK293T cells transfected with EGFP-RIα alone (dark blue curve) or EGFP-RIα plus mTagBFP2-tagged PKAcat (red curve), DnaJB1-PKAcat (light blue curve), or DnaJB1-PKAcatK72H (green curve). (D) Comparison of RIα puncta number between cells expressing RIα plus DnaJB1-PKAcat (J-Cat), wild-type PKAcat with no myristoylation (CatG1A), DnaJB1-PKAcat with myristoylation consensus sequence at N-terminus (Myr-J-Cat), DnaJB1-PKAcat which cannot bind to Hsp70 (JH33Q-Cat), or DnaJB1-PKAcat with both myristoylation and no Hsp70 binding (Myr-JH33Q-Cat). Cells were then stimulated with 50 μM Fsk. (E) Representative average time courses of cyan/yellow (C/Y) emission ratio changes (normalized to maximum) in HEK293T cells transfected with PDE4D2cat-ICUE4 and mTagBFP2-RIα plus mCherry-tagged PKAcat (Cat), DnaJB1-PKAcat (J-Cat), or DnaJB1-PKAcatK72H (J-CatK72H). Cells with (red curves) or without (blue curves) 2.5% 1,6-hexanediol pretreatment were stimulated with 50 μM Fsk, 1 μM rolipram (Rol), and 100 μM IBMX. Solid lines indicate the mean; shaded areas, SEM. Inset: Maximum normalized emission ratio change upon Fsk stimulation for each condition. (F-H) Dysfunctional RIα phase promotes tumorigenic phenotypes in AML12 hepatocytes. RIα phase separation was achieved by knocking out RIα or expressing either RIαD/D+Linker, which permits RIα phase separation but lacks cAMP binding, or RIαΔ(D/D+Linker), which retains cAMP binding but lacks phase separation, in RIα null cells. (F) Average time courses of the cell count for AML12 cells under different conditions. Error bars indicate SEM. (G) Average percentage of BrdU+ AML12 cells. (H) Average number of colonies larger than 500 μm2 grown in soft agar. Bars in B, E, G, and H indicate mean ± SEM. Violin plot in D show the median and quartiles as solid and dashed lines, respectively.

Comment in

References

    1. Adikusuma F, Pfitzner C, and Thomas PQ (2017). Versatile single-step-assembly CRISPR/Cas9 vectors for dual gRNA expression. PLoS One 12, e0187236. - PMC - PubMed
    1. Agarwal SR, Clancy CE, and Harvey RD (2016). Mechanisms Restricting Diffusion of Intracellular cAMP. Sci. Rep 6, 19577. - PMC - PubMed
    1. Bacskai BJ, Hochner B, Mahaut-Smith M, Adams SR, Kaang BK, Kandel ER, and Tsien RY (1993). Spatially resolved dynamics of cAMP and protein kinase A subunits in Aplysia sensory neurons. Science 260, 222–226. - PubMed
    1. Baillie GS (2009). Compartmentalized signalling: spatial regulation of cAMP by the action of compartmentalized phosphodiesterases. FEBS J 276, 1790–1799. - PubMed
    1. Bastidas AC, Deal MS, Steichen JM, Keshwani MM, Guo Y, and Taylor SS (2012). Role of N-terminal myristylation in the structure and regulation of cAMP-dependent protein kinase. J. Mol. Biol 422, 215–229. - PMC - PubMed

Publication types

MeSH terms

Substances

Supplementary concepts