. 2020 Sep 17;182(6):1545-1559.e18.
doi: 10.1016/j.cell.2020.07.036. Epub 2020 Aug 25.

Thermus thermophilus Argonaute Functions in the Completion of DNA Replication

Affiliations

Thermus thermophilus Argonaute Functions in the Completion of DNA Replication

Samson M Jolly et al. Cell. .

Abstract

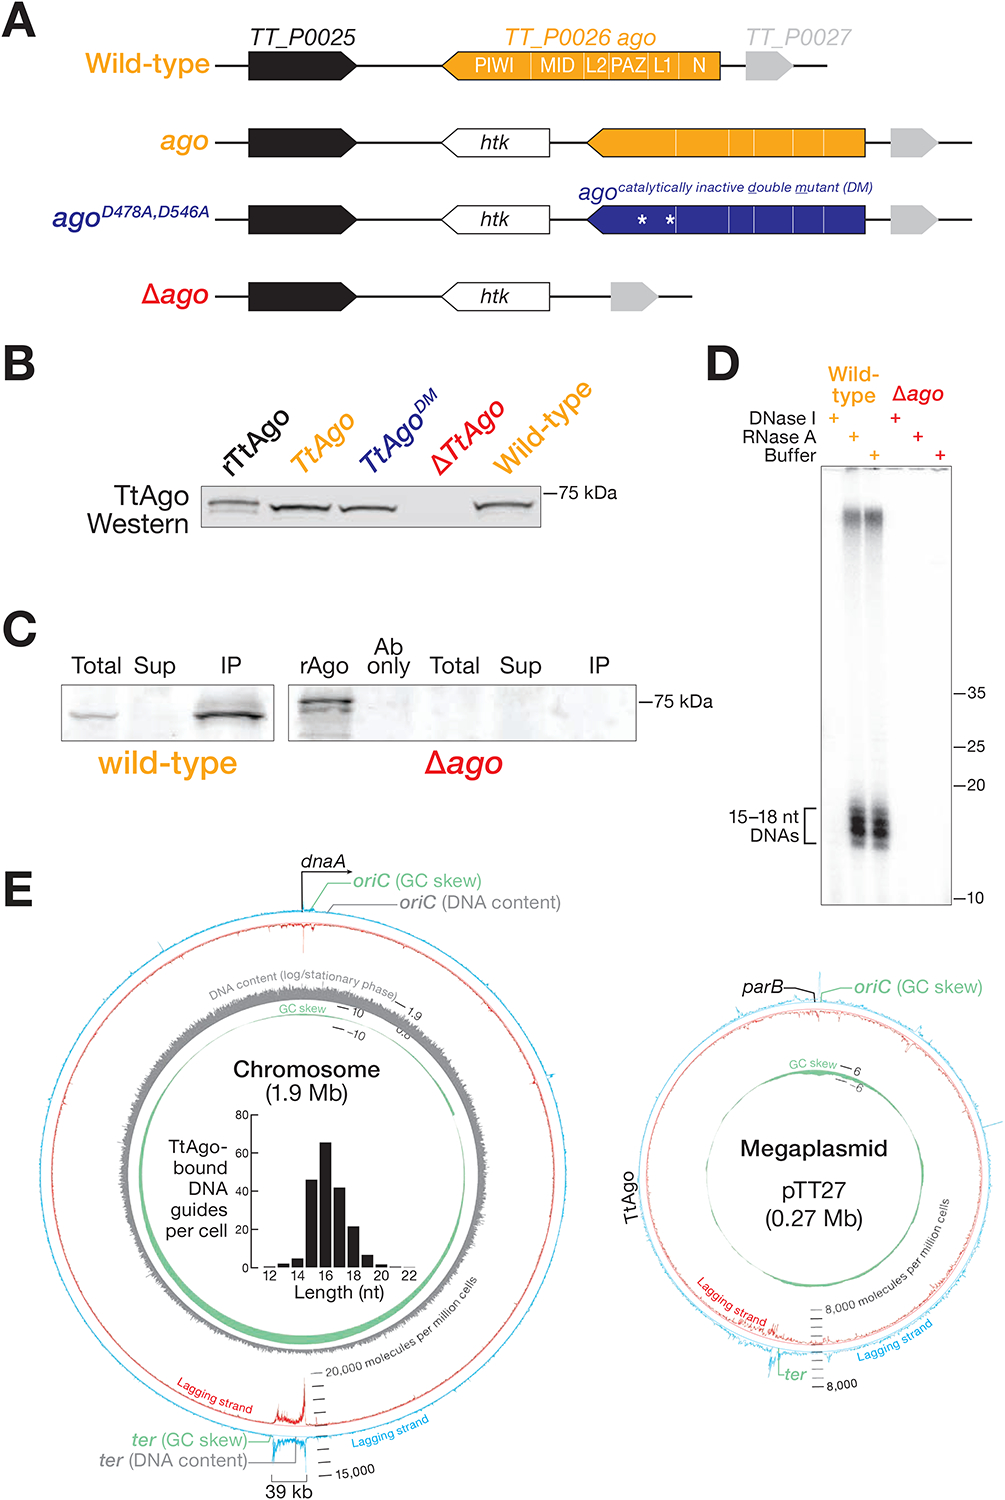
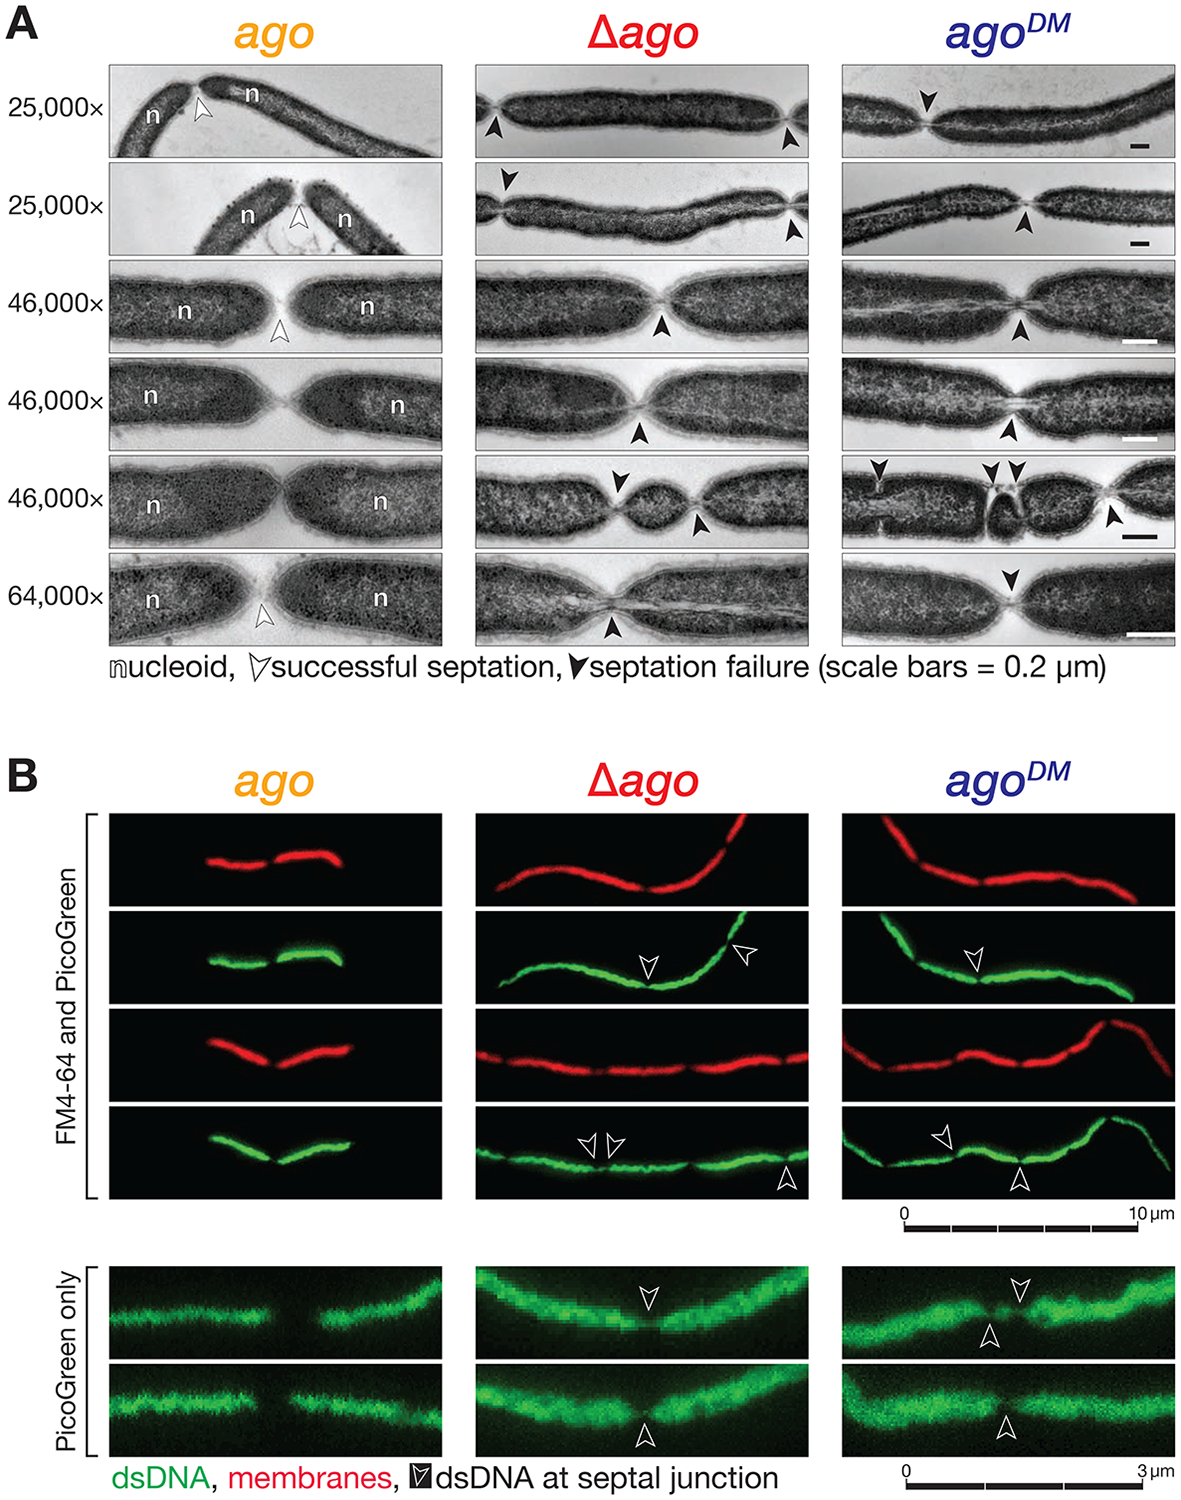
In many eukaryotes, Argonaute proteins, guided by short RNA sequences, defend cells against transposons and viruses. In the eubacterium Thermus thermophilus, the DNA-guided Argonaute TtAgo defends against transformation by DNA plasmids. Here, we report that TtAgo also participates in DNA replication. In vivo, TtAgo binds 15- to 18-nt DNA guides derived from the chromosomal region where replication terminates and associates with proteins known to act in DNA replication. When gyrase, the sole T. thermophilus type II topoisomerase, is inhibited, TtAgo allows the bacterium to finish replicating its circular genome. In contrast, loss of gyrase and TtAgo activity slows growth and produces long sausage-like filaments in which the individual bacteria are linked by DNA. Finally, wild-type T. thermophilus outcompetes an otherwise isogenic strain lacking TtAgo. We propose that the primary role of TtAgo is to help T. thermophilus disentangle the catenated circular chromosomes generated by DNA replication.

Keywords: Argonaute; DNA replication; RNA silencing; Thermus thermophilus; TtAgo; decatenation; gyrase; pAGO; terminus of replication; topoisomerase.


Conflict of interest statement

Declaration of Interests P.D.Z., S.M.J., and H.Z. have submitted a patent application regarding novel uses of TtAgo (PCT/US2016/025724).

Figures

Figure 1.
Figure 1.. TtAgo Expression and TtAgo-Bound Nucleic Acids
(A) T. thermophilus strains: wild-type HB27; ago, wild-type bearing a thermostable kanamycin resistance gene (htk) at the endogenous ago locus; agoDM, D478A, D546A mutant expressing catalytically inactive TtAgo; Δago, a deletion mutant lacking the ago gene. (B) Detection of TtAgo expression at OD600 = 0.5. rTtAgo: purified, recombinant TtAgo. (C) Immunoprecipitation of TtAgo from lysates of the bacteria in (B). (D) DNase and RNase digestion of nucleic acids bound to TtAgo. The co-immunoprecipitate nucleic acids were dephosphorylated and then 32P-radiolabeled with polynucleotide kinase. (E) Alignment of the sequences of TtAgo-bound small DNAs to the genome of the HB27 strain used in these experiments. The high-throughput sequencing strategy requires a 5′ monophosphorylated end for a small DNA to be incorporated into the sequencing library. Reads are grouped in 100 bp bins. Multiply mapping reads were apportioned among the sites. Inner grey circle: ratio of DNA content between logarithmic and stationary phases. Inner green circle: cumulative GC-skew analysis. Bar graph illustrates length distribution of genome-mapping 5′-phosphorylated DNA guides bound to TtAgo. See also Figure S1.
Figure 2.
Figure 2.. Comparison of Small DNAs Bound to TtAgo and TtAgoDM In Vivo
(A) Nucleic acids bound to TtAgo and TtAgoDM immunoprecipitated from logarithmically growing T. thermophilus. (B) Sequence bias of TtAgo- and TtAgoDM-bound small DNAs. (C) The small DNA guides bound to TtAgo and TtAgoDM map to the region of the chromosome in which replication terminates. (D) Length distribution of small DNAs in total lysate, TtAgo-depleted supernatant, and TtAgo immunoprecipitate in wild-type ago, catalytically inactive agoDM, and null mutant Δago strains. (E) Abundance of small DNAs bound to wild-type TtAgo and catalytically inactive TtAgoDM and abundance of TtAgo and TtAgoDM. The mean of three trials is shown here; error bars report standard deviation. See also Figure S2.
Figure 3.
Figure 3.. Effect of Ciprofloxacin on T. thermophilus Growth and Morphology
(A) Growth susceptibility of ago and Δago to 13 μM ciprofloxacin. (B) Wild-type ago and null mutant Δago grown on gellan gum supplemented agar plates with or without ciprofloxacin. (C) Scanning electron microscopy analysis of strains grown in the presence or absence of 12.5 μM ciprofloxacin. (D) Length distribution of T. thermophilus cells grown in the presence or absence of 12.5 μM ciprofloxacin. Two-way ANOVA: ciprofloxacin and genotype effect on length (F (2, 2277) = 77.743, p < 2 × 10⁻¹⁶); ciprofloxacin effect on length (F (1, 2277) = 612.90, p < 2 × 10⁻¹⁶); genotype effect on cell length (F (2, 2277) = 3.537, p = 0.03). Tukey test: ciprofloxacin treated cells were significantly longer than untreated cells (7.1 μm, p = 3.8 × 10⁻¹¹, 95% CI [6.5, 7.9]); treated Δago cells were longer than ago (2.8 μm, p = 3.8 × 10⁻¹¹, 95% CI [2.8–3.4]; treated agoDM cells were longer than ago (1.7 μm, p = 3.8 × 10⁻¹¹, 95% CI [1.5–2.0]); treated Δago cells were longer agoDM (1.6 μm, p = 4.6 × 10⁻¹¹, 95% CI [1.3–1.9]). Data are from a single, representative, biological sample. See also Figure S3.
Figure 4.
Figure 4.. Effect of Ciprofloxacin on Nucleoid Morphology
(A) Transmission electron microscopy cross-sectional analysis of T. thermophilus grown in the presence of 12.5 μM ciprofloxacin. Representative images are shown. Scale bars represent 0.2 μm. (B) Top, fluorescence microscopy of cells stained with PicoGreen to detect dsDNA (green) and FM4–64 to detect membranes (red). Scale bar represents 10 μm. Bottom, independent, representative stimulated emission depletion microscopy images of T. thermophilus grown in the presence of 12.5 μM ciprofloxacin. Scale bar represents 3 μm. See also Figure S4.
Figure 5.
Figure 5.. Identification of Proteins Associated with TtAgo
(A) Strategy to identify TtAgo-associated proteins. (B) Proteins associated with TtAgo or TtAgoDM after 8 h growth in the absence or presence of 12.5 μM ciprofloxacin, compared to Δago control immunoprecipitation. The immunoprecipitates were either analyzed by mass spectrometry or treated with DNase prior to mass spectrometry analysis. The data represent the mean of three independent trials. See also Figure S5 and Table S2.
Figure 6.
Figure 6.. TtAgo Confers a Selective Advantage on T. thermophilus
After mixing equal numbers of ago and Δago logarithmic phase cells, the bacteria were cultured in rich media at 65°C for 12 days, serially passaging them (1:40 dilution) into fresh media every 12 h. Left, ratio of read coverage across the ago locus relative to the htk gene for three independent trials. Right, the read coverage across the region of the genome encompassing the htk and ago genes for one representative trial.
Figure 7.
Figure 7.. A Model for Guide Acquisition by TtAgo
(A) Proposed model for how TtAgo might acquire DNA guides. (B) Left, experimental setup to measure TtAgo:guide interactions with target DNA. Right top, representative fluorescence intensity time traces of TtAgo:guide binding a DNA target. Right bottom, cumulative fraction of TtAgo:guide molecules binding for the first time to a single DNA target and dwell time distribution of these binding events. Data points are plotted in black, and the curve in red shows the rate of binding or departure after correcting for non-specific association of TtAgo:guide with the glass surface. The binding rate (kon) was determined by fitting the cumulative fractions of TtAgo:guide arrivals to f(t) = 1− (1 − ℎ) × e ^(− k_on × t)− ℎ × e^(− (k_on + k_NS) × t)) and reported per time unit and concentration of introduced TtAgo:guide complex. A dwell time distribution was fitted by f(t) = N × e^(−k_off × t) + A × e^(−k_NS1 × t) + B × e ^(−k_NS2 × t). Parameters relative to non-specific association of TtAgo:guide with the glass surface (kNS, on-rate for non-specific arrivals; h, fraction of control locations having received non-specific arrivals; kNS1 and kNS2, off-rate for non-specific binding events and rate of photobleaching; A and B, their respective amplitudes) were determined from the fitting of data for control locations. Values of kon and koff were derived from data collected from 1,258 individual DNA target molecules; standard error from bootstrapping is reported. See also Figure S6.

Comment in

References

    1. Aitken CE, Marshall RA, and Puglisi JD (2008). An oxygen scavenging system for improvement of dye stability in single-molecule fluorescence experiments. Biophys J 94, 1826–1835. - PMC - PubMed
    1. Aravin AA, Sachidanandam R, Bourc’his D, Schaefer C, Pezic D, Toth KF, Bestor T, and Hannon GJ (2008). A piRNA pathway primed by individual transposons is linked to de novo DNA methylation in mice. Molecular cell 31, 785–799. - PMC - PubMed
    1. Aubry A, Fisher LM, Jarlier V, and Cambau E (2006). First functional characterization of a singly expressed bacterial type II topoisomerase: the enzyme from Mycobacterium tuberculosis. Biochem Biophys Res Commun 348, 158–165. - PubMed
    1. Bartel DP (2018). Metazoan MicroRNAs. Cell 173, 20–51. - PMC - PubMed
    1. Baumberger N, and Baulcombe DC (2005). Arabidopsis ARGONAUTE1 is an RNA Slicer that selectively recruits microRNAs and short interfering RNAs. Proc Natl Acad Sci U S A 102, 11928–11933. - PMC - PubMed

Publication types

MeSH terms