

Household air pollution exposure and associations with household characteristics among biomass cookstove users in Puno, Peru
- PMID: 32846169
- PMCID: PMC7658004
- DOI: 10.1016/j.envres.2020.110028
Household air pollution exposure and associations with household characteristics among biomass cookstove users in Puno, Peru
Abstract
Background: Household air pollution (HAP) from combustion of biomass fuel, such as wood and animal dung, is among the leading environmental risk factors for preventable disease. Close to half of the world's population relies on biomass cookstoves for their daily cooking needs. Understanding factors that affect HAP can inform measures to maximize the effectiveness of cookstove interventions in a cost-effective manner. However, the impact of kitchen and household characteristics, as well as the presence of secondary stoves, on HAP concentrations is poorly understood in Puno, Peru.
Objective: To explore how household characteristics explain variability of kitchen area concentrations and personal exposures to CO, PM2.5 and BC from biomass cookstoves among women in rural Peru.
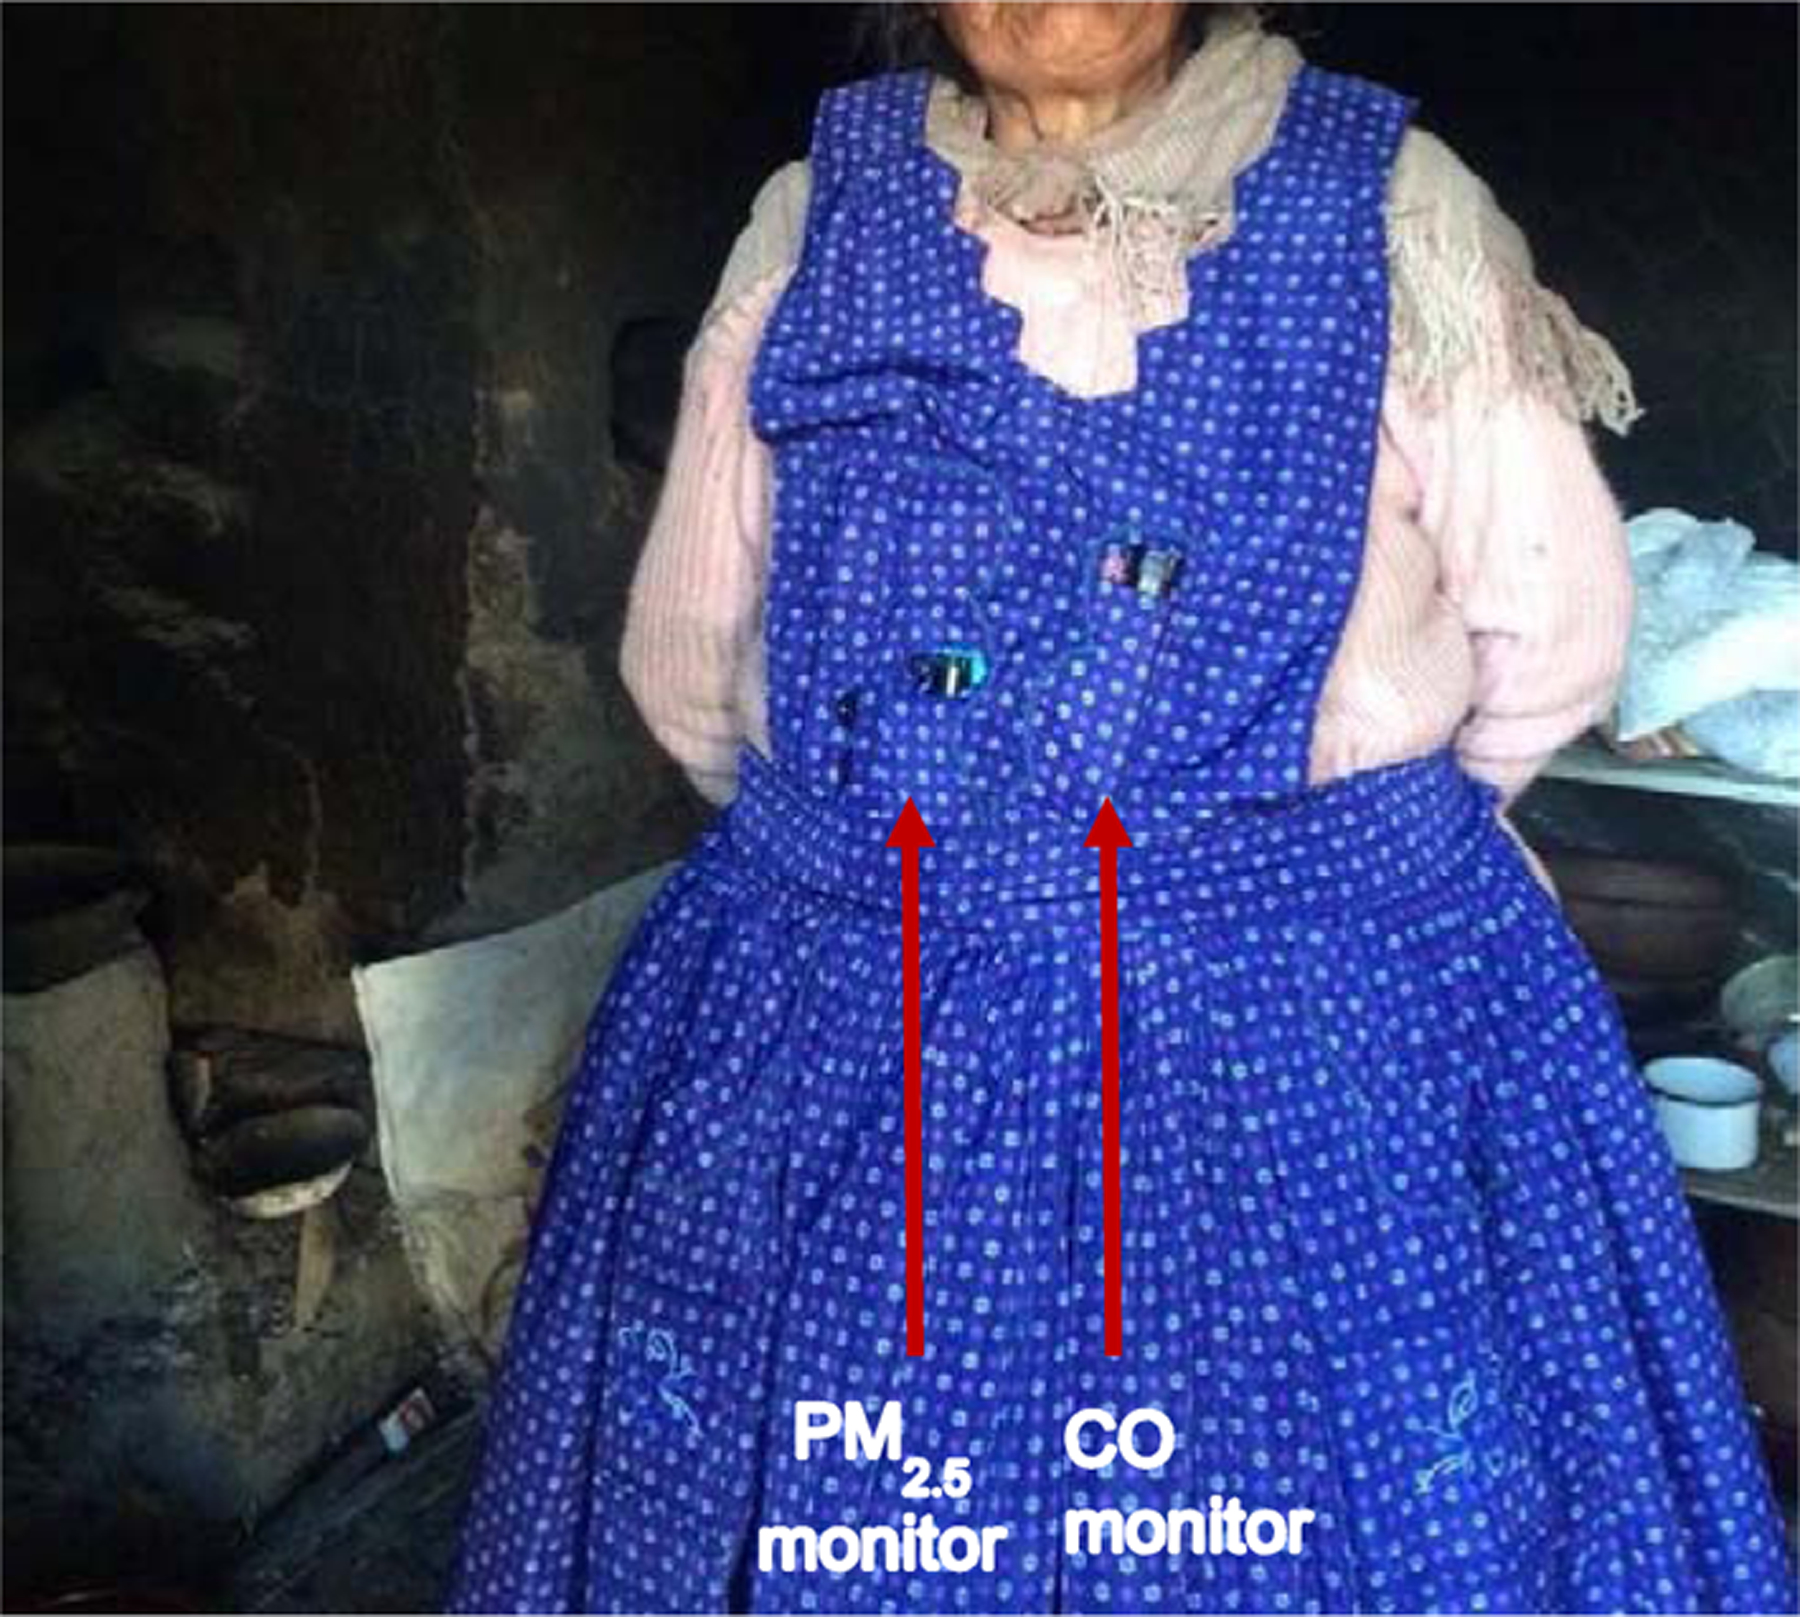
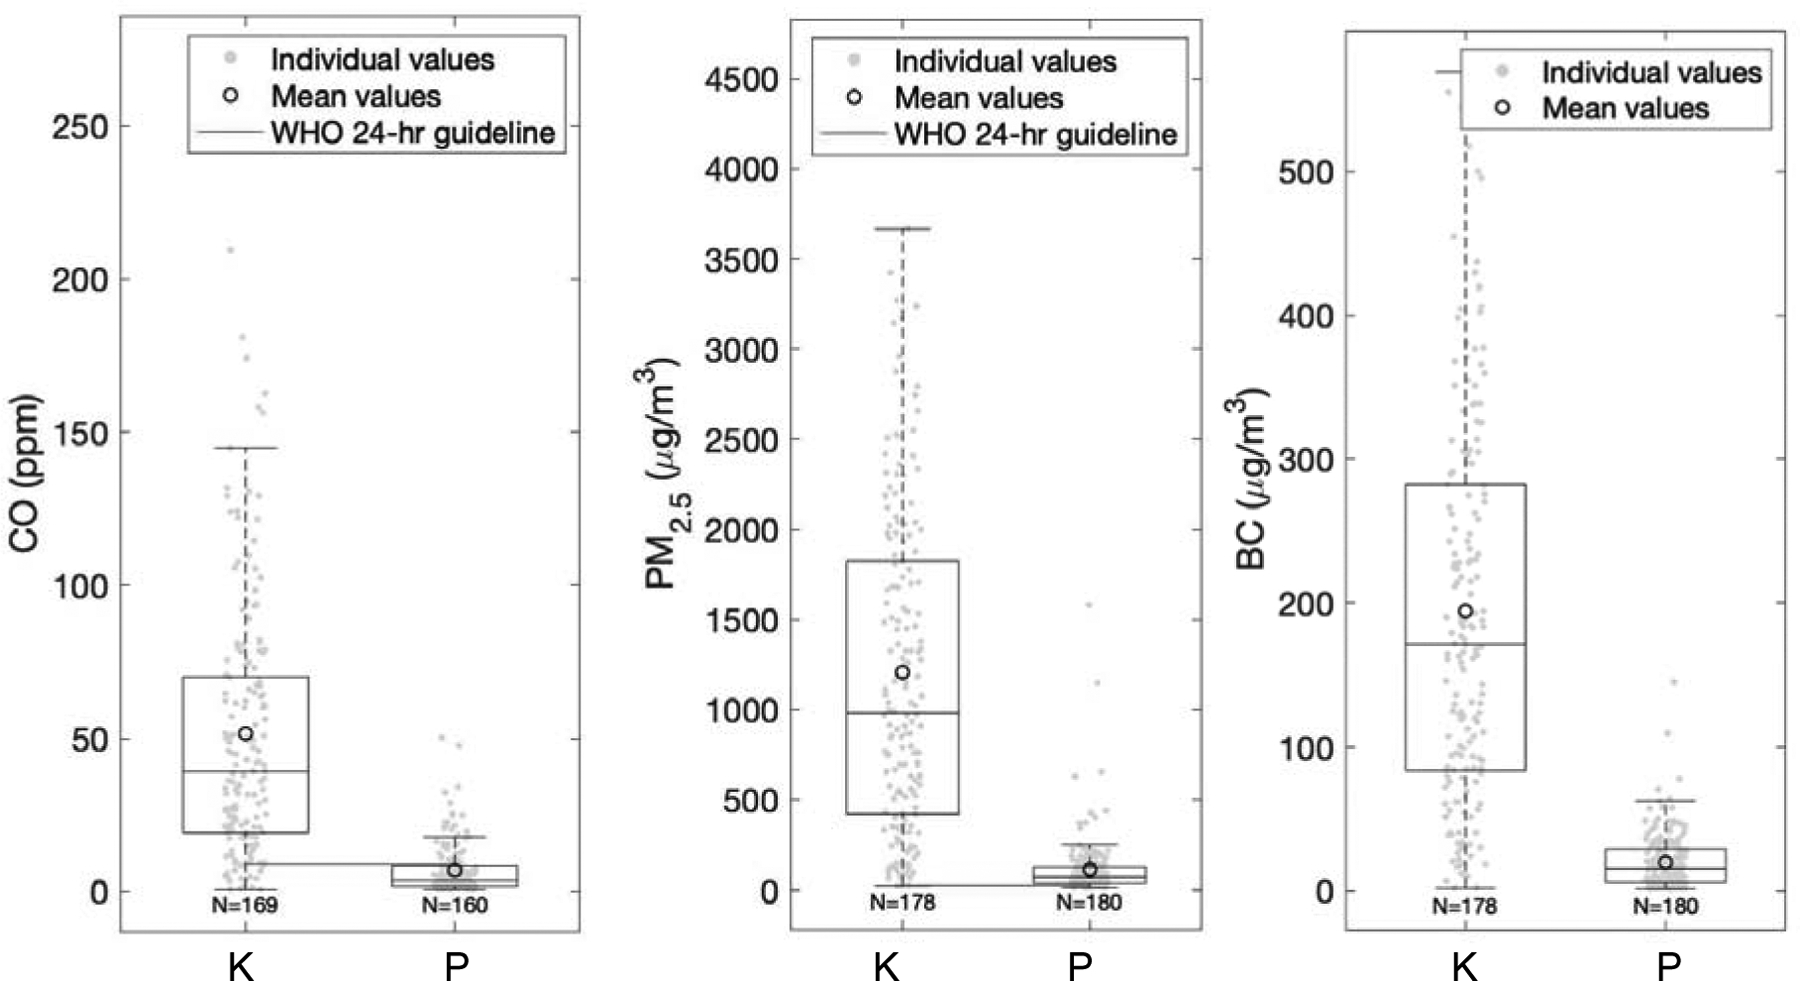
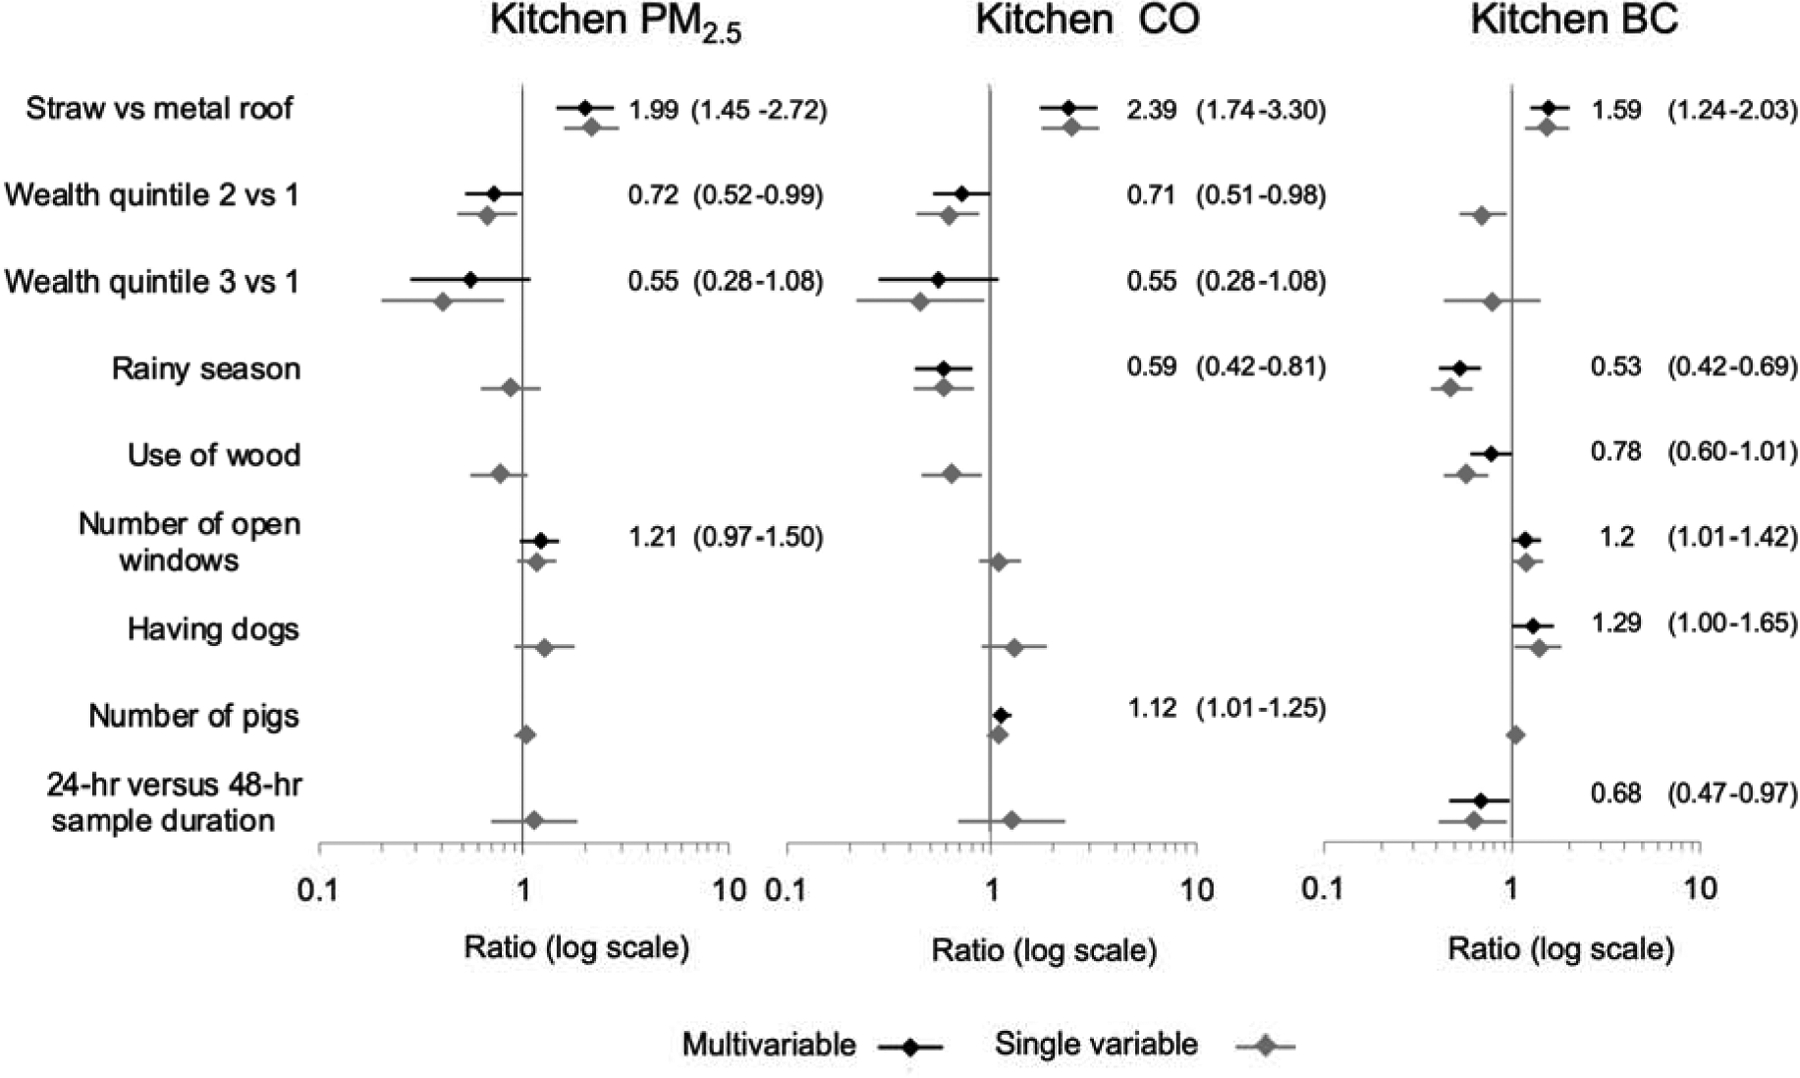
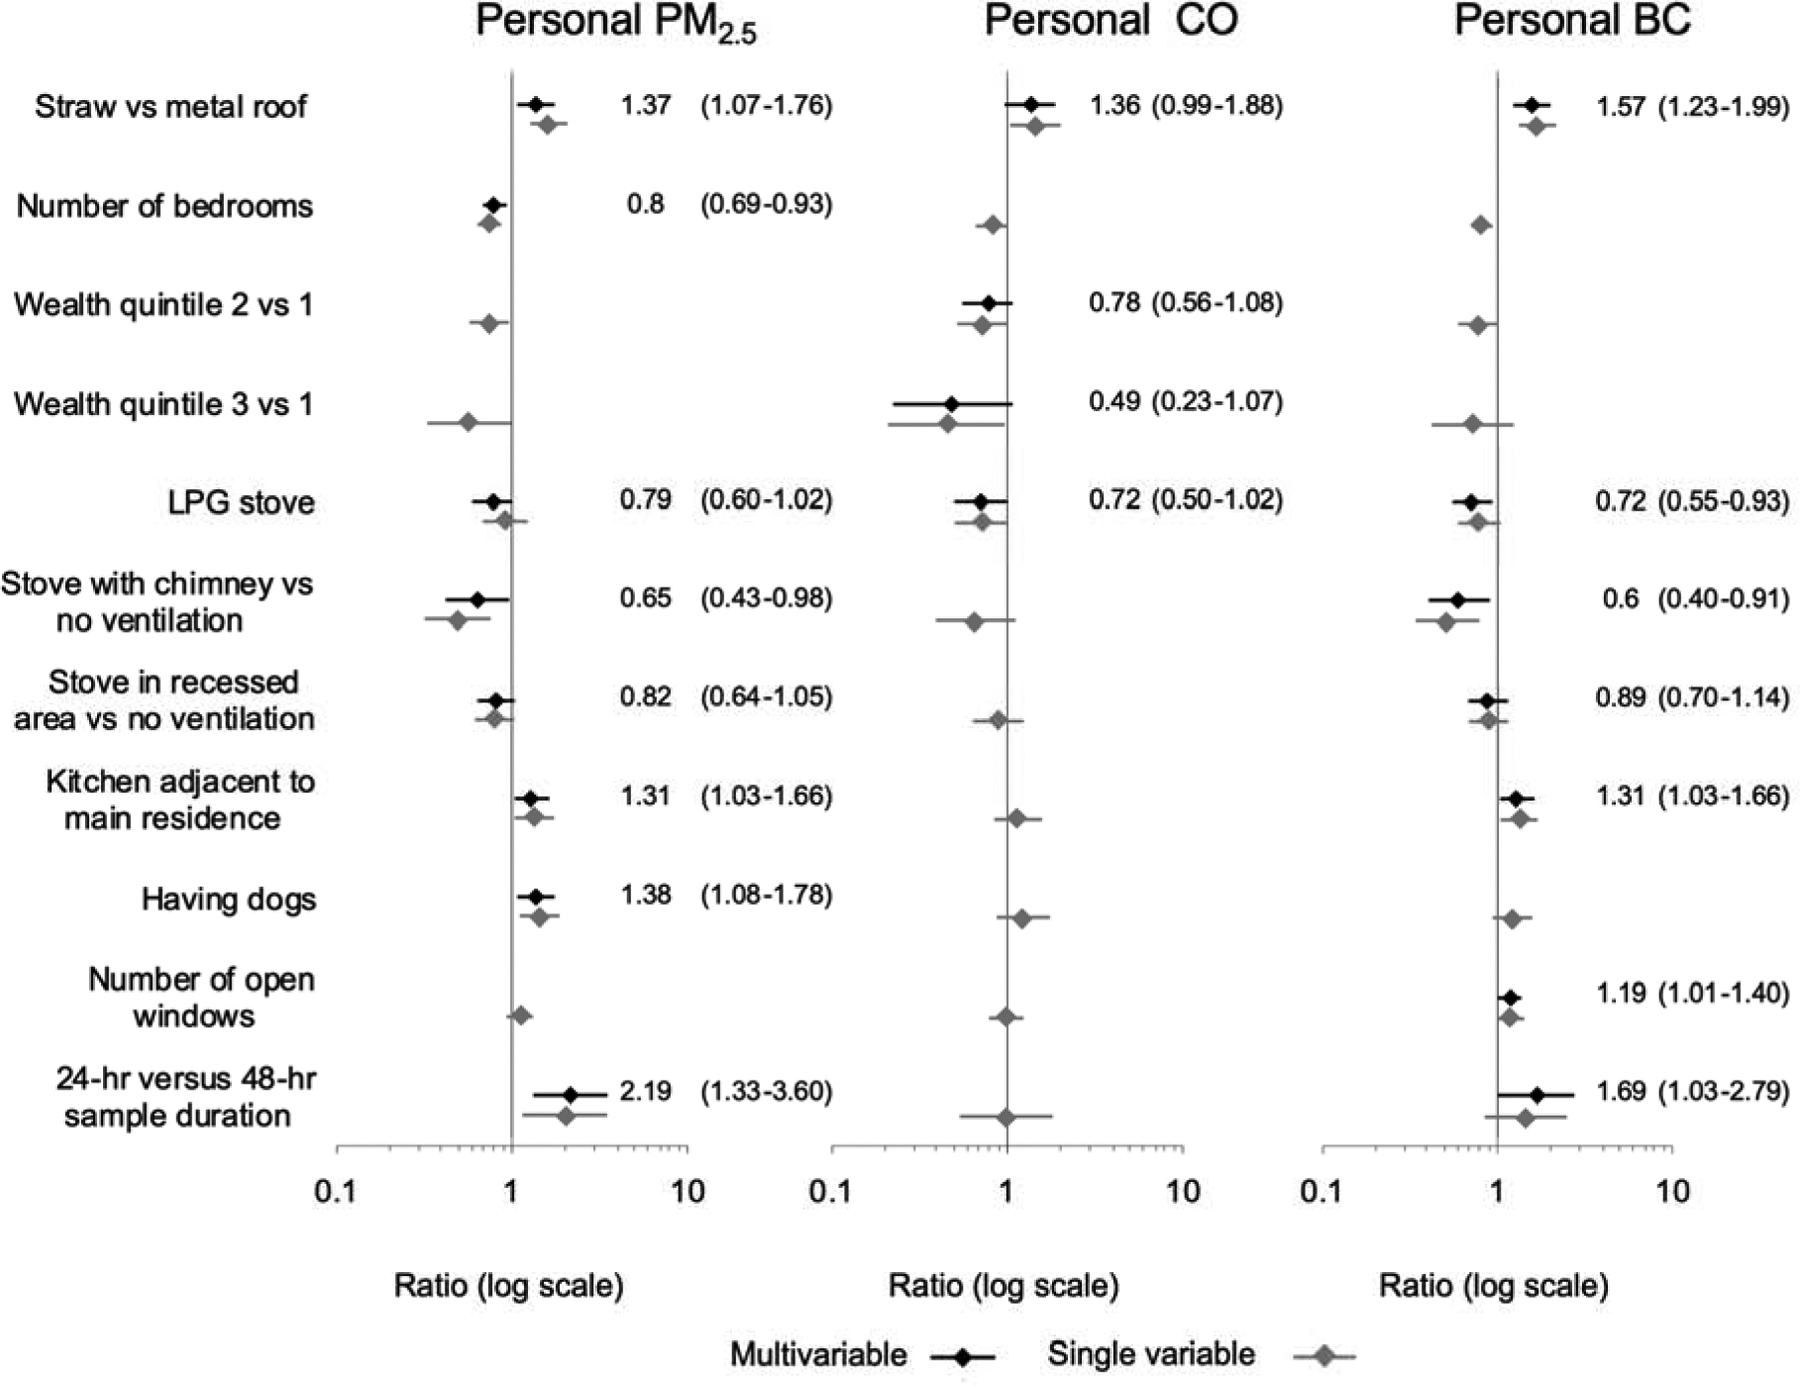
Methods: Household characteristics (including kitchen materials and layout, wealth, and cooking behaviors) and HAP measurements were collected from 180 households in Puno, Peru, from baseline measurements of a randomized trial. Kitchen area concentrations and personal exposures to carbon monoxide (CO), fine particulate matter (PM2.5) and black carbon (BC) were sampled for 48 h. We implemented simple and multivariable linear regression models to determine the associations between household characteristics and both kitchen area concentration and personal exposure to each pollutant.
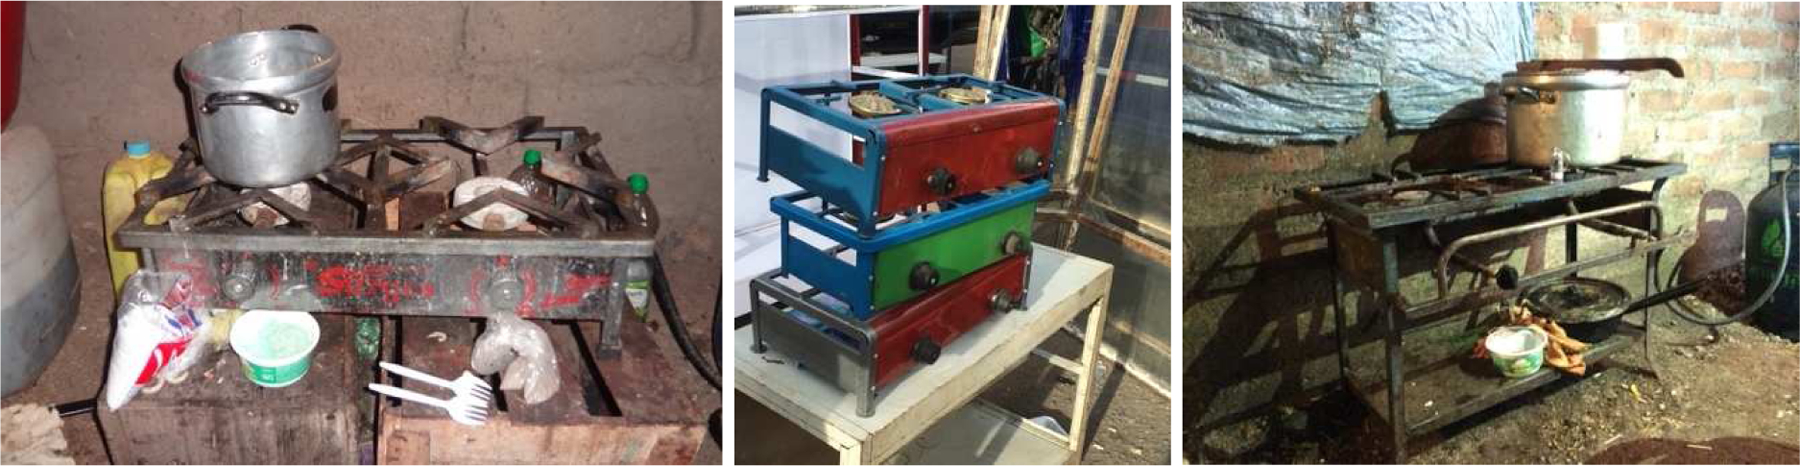
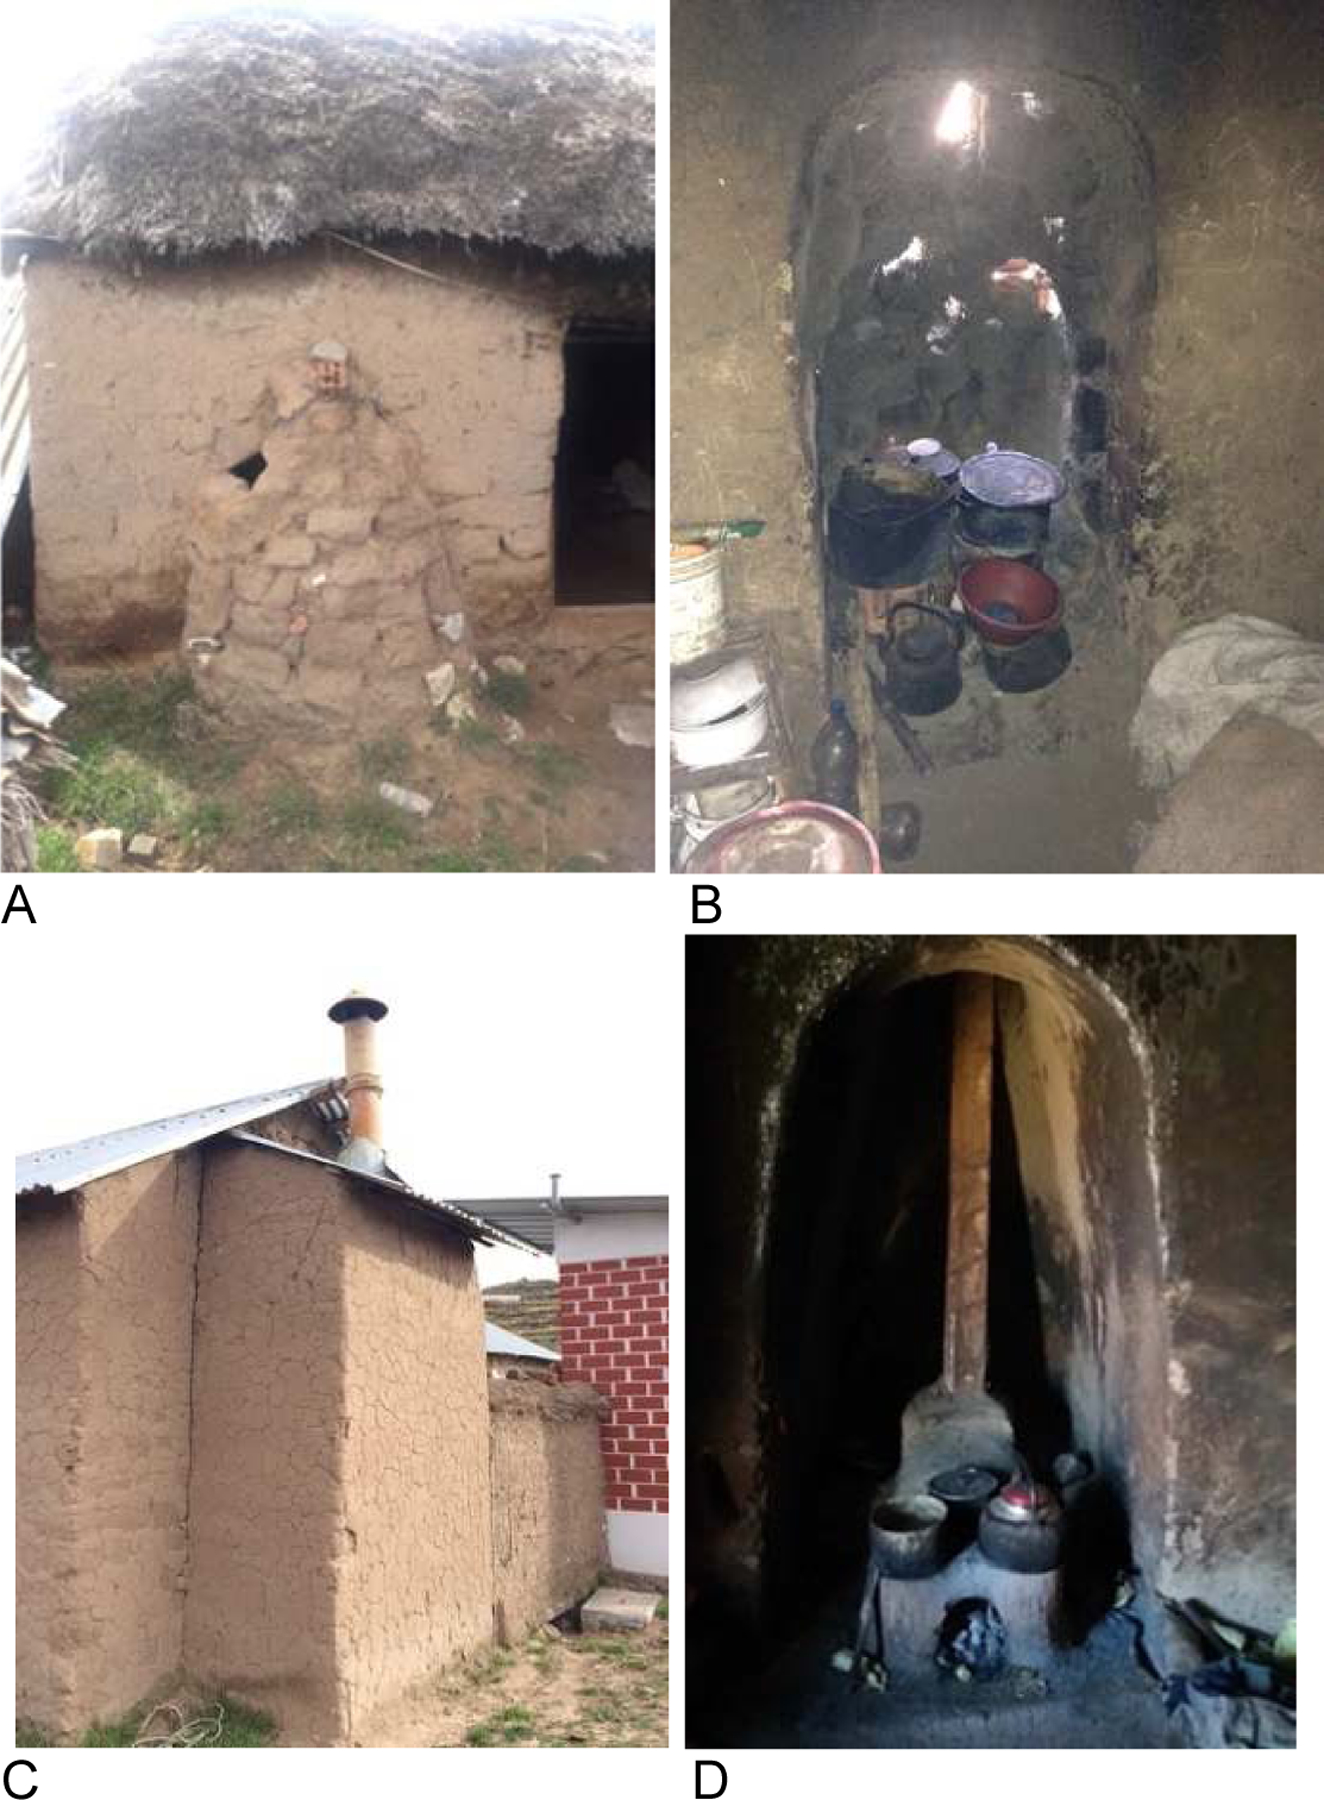
Results: Mean daily kitchen area concentrations and personal exposures to HAP were, on average, 48 times above World Health Organization indoor guidelines for PM2.5. We found that roof type explained the most variability in HAP and was strongly associated with both kitchen area concentrations and personal exposures for all pollutants after adjusting for other household variables. Personal exposures were 27%-36% lower for PM2.5, CO and BC, in households with corrugated metal roofs, compared to roofs made of natural materials (straw, totora or reed) after adjusting for other factors. Higher kitchen area concentrations were also associated with less wealth, owning more animals, or sampling during the dry season in multivariable models. Having a liquefied petroleum gas (LPG) stove and having a chimney were associated with lower personal exposures, but were not associated with kitchen area concentrations. Personal exposures were lower by 21% for PM2.5 and 28% for CO and BC concentrations among participants who had both LPG and biomass stoves compared to those with only biomass cookstoves adjusting for other household factors.
Conclusions: Characterizing HAP within different settings can help identify effective and culturally-relevant solutions to reduce HAP exposures. We found that housing roof type is strongly related to kitchen area concentrations and personal exposures to HAP, perhaps because of greater ventilation in kitchens with metal roofs compared to those with thatch roofs. Although HAP concentrations remained above guidelines for all households, promoting use of metal roof materials and LPG stoves may be actionable interventions that can help reduce exposures to HAP in high-altitude rural Peru and similar settings.
Keywords: Biomass cookstove; Black carbon; Carbon monoxide; Household air pollution; Particulate matter.
Copyright © 2020 Elsevier Inc. All rights reserved.
Conflict of interest statement
Declaration of interests
The authors declare that they have no known competing financial interests or personal relationships that could have appeared to influence the work reported in this paper.
Figures
Similar articles
-
Household Air Pollution Concentrations after Liquefied Petroleum Gas Interventions in Rural Peru: Findings from a One-Year Randomized Controlled Trial Followed by a One-Year Pragmatic Crossover Trial.Environ Health Perspect. 2022 May;130(5):57007. doi: 10.1289/EHP10054. Epub 2022 May 12. Environ Health Perspect. 2022. PMID: 35549716 Free PMC article. Clinical Trial.
-
Global estimation of exposure to fine particulate matter (PM2.5) from household air pollution.Environ Int. 2018 Nov;120:354-363. doi: 10.1016/j.envint.2018.08.026. Epub 2018 Aug 15. Environ Int. 2018. PMID: 30119008
-
Effects of a liquefied petroleum gas stove intervention on pollutant exposure and adult cardiopulmonary outcomes (CHAP): study protocol for a randomized controlled trial.Trials. 2017 Nov 3;18(1):518. doi: 10.1186/s13063-017-2179-x. Trials. 2017. PMID: 29100550 Free PMC article. Clinical Trial.
-
Real-life effectiveness of 'improved' stoves and clean fuels in reducing PM2.5 and CO: Systematic review and meta-analysis.Environ Int. 2017 Apr;101:7-18. doi: 10.1016/j.envint.2017.01.012. Epub 2017 Jan 28. Environ Int. 2017. PMID: 28285622
-
Household Energy Interventions and Health and Finances in Haryana, India: An Extended Cost-Effectiveness Analysis.In: Mock CN, Nugent R, Kobusingye O, Smith KR, editors. Injury Prevention and Environmental Health. 3rd edition. Washington (DC): The International Bank for Reconstruction and Development / The World Bank; 2017 Oct 27. Chapter 12. In: Mock CN, Nugent R, Kobusingye O, Smith KR, editors. Injury Prevention and Environmental Health. 3rd edition. Washington (DC): The International Bank for Reconstruction and Development / The World Bank; 2017 Oct 27. Chapter 12. PMID: 30212113 Free Books & Documents. Review.
Cited by
-
Kitchen Characteristics and Practices Associated with Increased PM2.5 Concentration Levels in Zimbabwean Rural Households.Int J Environ Res Public Health. 2023 May 12;20(10):5811. doi: 10.3390/ijerph20105811. Int J Environ Res Public Health. 2023. PMID: 37239536 Free PMC article.
-
[Adaptive Regulation of Glucose Metabolism and Diseases in High-Altitude Areas].Sichuan Da Xue Xue Bao Yi Xue Ban. 2024 Nov 20;55(6):1460-1468. doi: 10.12182/20241160604. Sichuan Da Xue Xue Bao Yi Xue Ban. 2024. PMID: 39990855 Free PMC article. Review. Chinese.
-
Pregnant Women's Exposure to Household Air Pollution in Rural Bangladesh: A Feasibility Study for Poriborton: The CHANge Trial.Int J Environ Res Public Health. 2022 Jan 2;19(1):482. doi: 10.3390/ijerph19010482. Int J Environ Res Public Health. 2022. PMID: 35010741 Free PMC article. Clinical Trial.
-
Development of a predictive model for systemic lupus erythematosus incidence risk based on environmental exposure factors.Lupus Sci Med. 2024 Nov 20;11(2):e001311. doi: 10.1136/lupus-2024-001311. Lupus Sci Med. 2024. PMID: 39572059 Free PMC article.
-
Housing conditions, cooking fuels, and health-related quality of life among rural middle-aged and elderly in northwest China: A ten-year balanced panel study.Prev Med Rep. 2023 Dec 16;37:102563. doi: 10.1016/j.pmedr.2023.102563. eCollection 2024 Jan. Prev Med Rep. 2023. PMID: 38205167 Free PMC article.
References
-
- Aza L, Palumbo M, Lacasta A, 2017. Totora used as thermal insulation: properties and potential. Acad. J. Civ. Eng 35, 416–421. 10.26168/icbbm2017.63 - DOI
-
- Balakrishnan K, Ghosh S, Ganguli B, Sambandam S, Bruce N, Barnes DF, Smith KR, 2013. State and national household concentrations of PM2.5 from solid cookfuel use: Results from measurements and modeling in India for estimation of the global burden of disease. Environ. Health 12, 77 10.1186/1476-069X-12-77 - DOI - PMC - PubMed
-
- Balakrishnan K, Mehta S, Ghosh S, Johnson M, Brauer M, Zhang J, Naeher L, Smith KR, 2014. WHO | Indoor air quality guidelines: household fuel combustion. Review 5: Population levels of household air pollution and exposures [WWW Document]. URL http://www.who.int/airpollution/guidelines/household-fuel-combustion/evi... (accessed 1.8.19).
-
- Beelen R, Stafoggia M, Raaschou-Nielsen O, Andersen ZJ, Xun WW, Katsouyanni K, Dimakopoulou K, Brunekreef B, Weinmayr G, Hoffmann B, Wolf K, Samoli E, Houthuijs D, Nieuwenhuijsen M, Oudin A, Forsberg B, Olsson D, Salomaa V, Lanki T, Yli-Tuomi T, Oftedal B, Aamodt G, Nafstad P, De Faire U, Pedersen NL, Östenson C-G, Fratiglioni L, Penell J, Korek M, Pyko A, Eriksen KT, Tjønneland A, Becker T, Eeftens M, Bots M, Meliefste K, Wang M, Bueno-de-Mesquita B, Sugiri D, Krämer U, Heinrich J, de Hoogh K, Key T, Peters A, Cyrys J, Concin H, Nagel G, Ineichen A, Schaffner E, Probst-Hensch N, Dratva J, Ducret-Stich R, Vilier A, Clavel-Chapelon F, Stempfelet M, Grioni S, Krogh V, Tsai M-Y, Marcon A, Ricceri F, Sacerdote C, Galassi C, Migliore E, Ranzi A, Cesaroni G, Badaloni C, Forastiere F, Tamayo I, Amiano P, Dorronsoro M, Katsoulis M, Trichopoulou A, Vineis P, Hoek G, 2014. Long-term exposure to air pollution and cardiovascular mortality: an analysis of 22 European cohorts. Epidemiol. Camb. Mass 25, 368–378. 10.1097/EDE.0000000000000076 - DOI - PubMed
Publication types
MeSH terms
Substances
Grants and funding
LinkOut - more resources
Full Text Sources
Medical
