

Associations of socioeconomic factors with cause-specific Mortality and burden of cardiovascular diseases: findings from the vital registration in urban Shanghai, China, during 1974-2015
- PMID: 32847504
- PMCID: PMC7448450
- DOI: 10.1186/s12889-020-09390-1
Associations of socioeconomic factors with cause-specific Mortality and burden of cardiovascular diseases: findings from the vital registration in urban Shanghai, China, during 1974-2015
Abstract
Background: Cardiovascular disease (CVD) is the leading cause of mortality worldwide. The effect of socioeconomic factors on cause-specific mortality and burden of CVD is rarely evaluated in low- and middle-income countries, especially in a rapidly changing society.
Methods: Original data were derived from the vital registration system in Yangpu, a representative, population-stable district of urban Shanghai, China, during 1974-2015. Temporal trends for the mortality rates and burden of CVD during 1974-2015 were evaluated using Joinpoint Regression Software. The burden was evaluated using age-standardized person years of life loss per 100,000 persons (SPYLLs). Age-sex-specific CVD mortality rates were predicted by using age-period-cohort Poisson regression model.
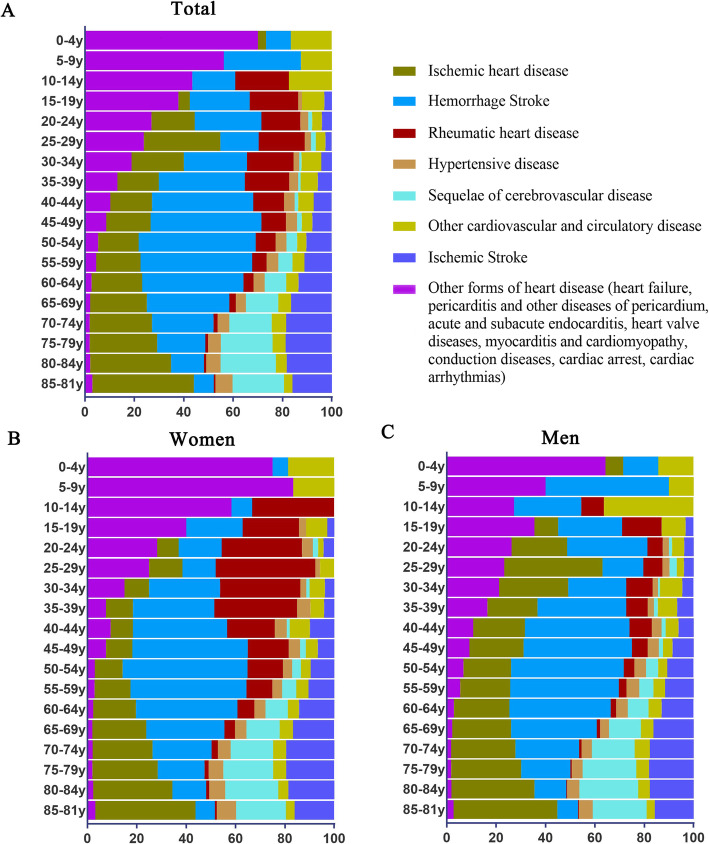
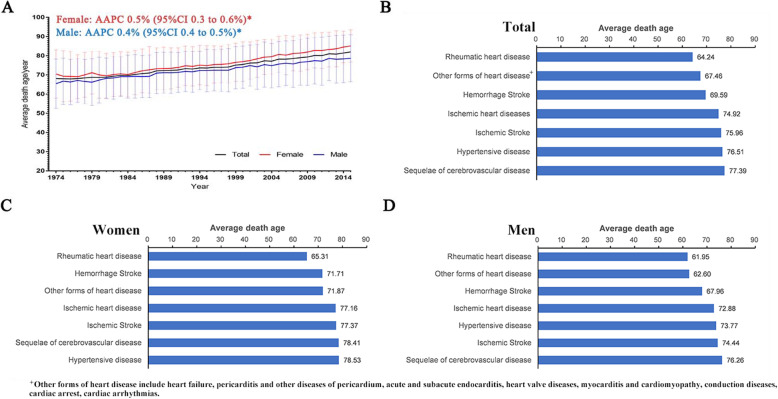
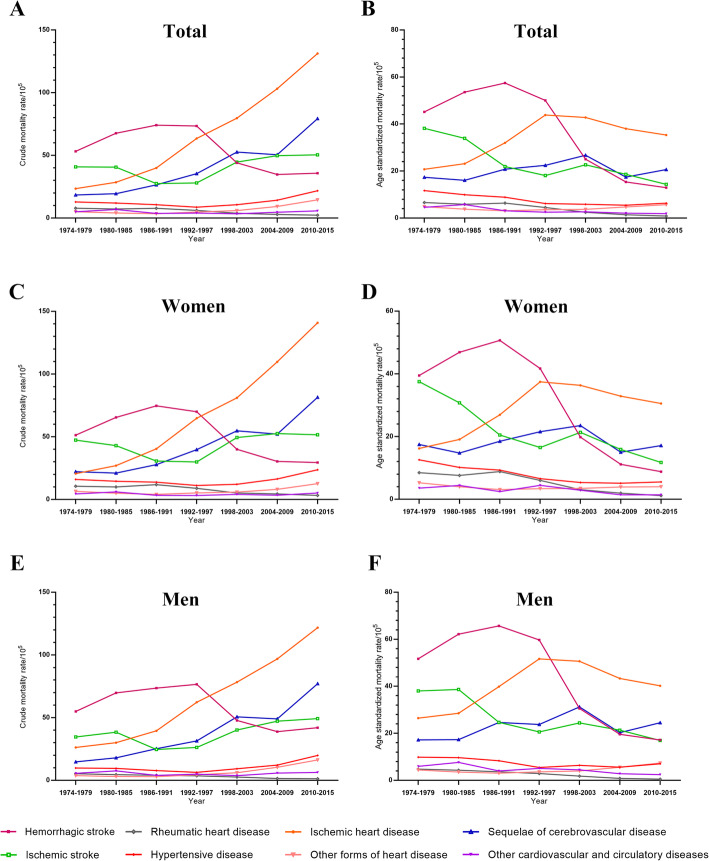
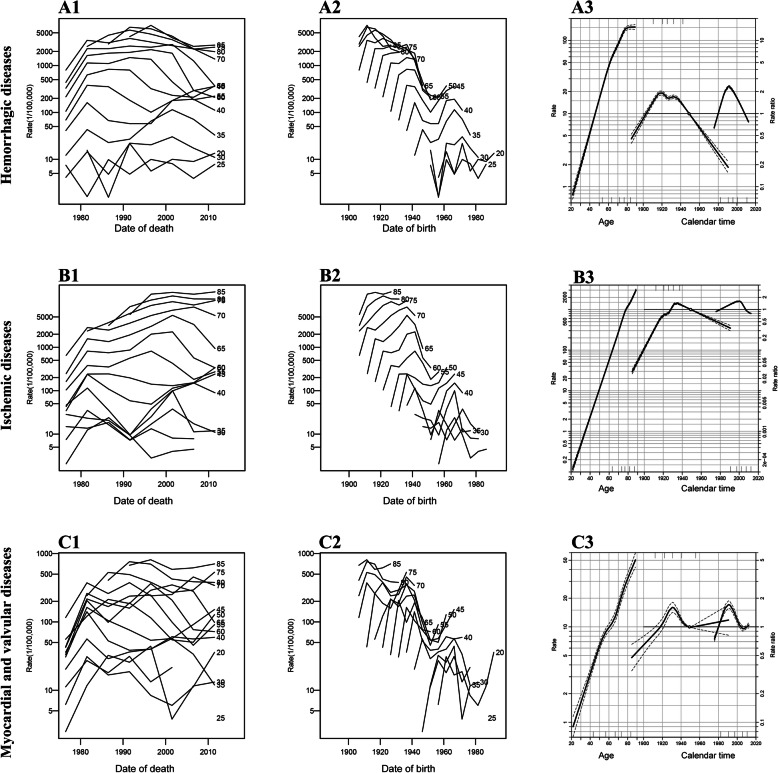
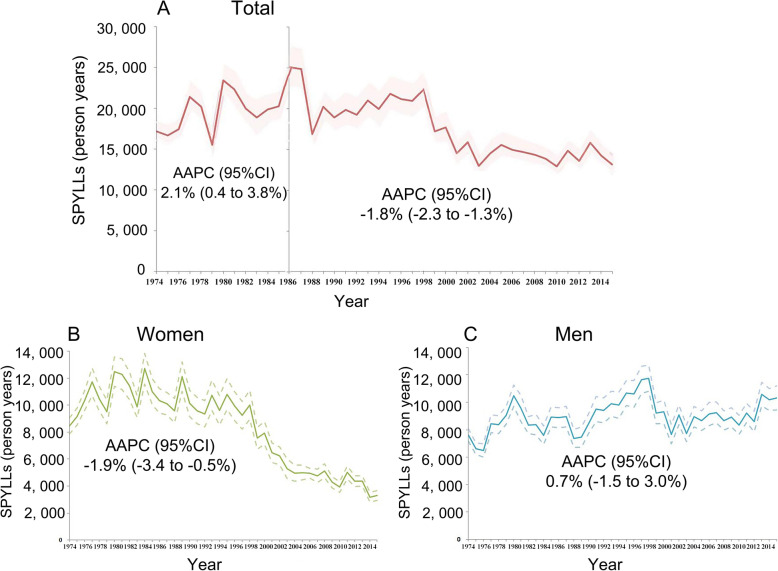
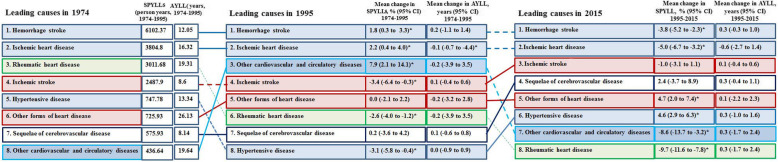
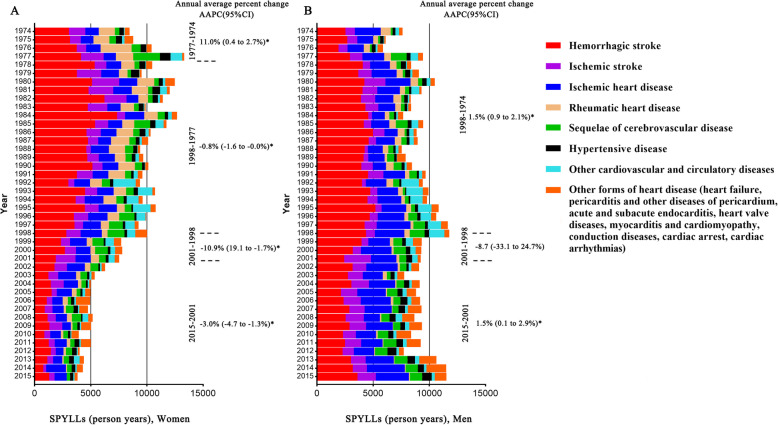
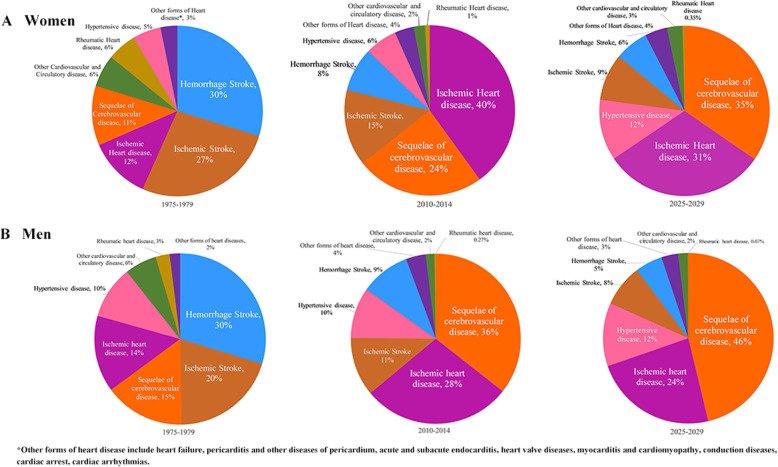
Results: A total of 101,822 CVD death occurred during 1974-2015, accounting for 36.95% of total death. Hemorrhagic stroke, ischemic heart disease, and ischemic stroke were the 3 leading causes of CVD death. The age-standardized CVD mortality decreased from 144.5/100,000 to 100.7/100,000 in the residents (average annual percentage change [AAPC] -1.0, 95% confidence interval [CI] -1.7 to - 0.2), which was mainly contributed by women (AAPC -1.3, 95% CI - 2.0 to - 0.7), not by men. Hemorrhagic stroke, the major CVD death in the mid-aged population, decreased dramatically after 1991. The crude mortality of ischemic heart disease kept increasing but its age-adjusted mortality decreased continually after 1997. SPYLLs of CVD death increased from 1974 to 1986 (AAPC 2.1, 95% CI 0.4 to 3.8) and decreased after 1986 (AAPC 1.8, 95% CI - 2.3 to - 1.3). These changes were in concert with the implementation of policies including extended medical insurance coverage, pollution control, active prophylaxis of CVD including lifestyle promotion, and national health programs. The mortality of CVD increased in those born during 1937-1945, a period of the Japanese military occupation, and during 1958-1965, a period including the Chinese Famine. Sequelae of CVD and ischemic heart disease are predicted to be the leading causes of CVD death in 2029.
Conclusions: Exposure to serious malnutrition in early life might increase CVD mortality in later life. Improvements in medical services, pollution control, and lifestyle could decrease CVD death. New strategy is needed to prevent the aging-related CVD death and burden in the future.
Keywords: Burden; Cardiovascular disease; Lifestyle; Low- and middle-income countries; Malnutrition; Medical insurance; Mortality; Pollution control; Sociodemographic index.
Conflict of interest statement
The authors declare that they have no competing interests.
Figures
References
-
- Collaborators GBDCoD. Naghavi M, Abajobir AA, Abbafati C, Abbas KM, Abd-Allah F, Abera SF, Aboyans V, Adetokunboh O, Afshin A, et al. Global, regional, and national age-sex specific mortality for 264 causes of death, 1980-2016: a systematic analysis for the global burden of disease study 2016. Lancet. 2017;390(10100):1151–1210. - PMC - PubMed
-
- Bansilal S, Castellano JM, Fuster V. Global burden of CVD: focus on secondary prevention of cardiovascular disease. Int J Cardiol. 2015;7. - PubMed
-
- Bowry AD, Lewey J, Dugani SB, Choudhry NK. The burden of cardiovascular disease in low- and middle-income countries: epidemiology and management. Can J Cardiol. 2015;31(9):1151–1159. - PubMed
-
- Lear SA, Hu W, Rangarajan S, Gasevic D, Leong D, Iqbal R, Casanova A, Swaminathan S, Anjana RM, Kumar R, et al. The effect of physical activity on mortality and cardiovascular disease in 130 000 people from 17 high-income, middle-income, and low-income countries: the PURE study. Lancet. 2017;390(10113):2643–2654. - PubMed
MeSH terms
Grants and funding
LinkOut - more resources
Full Text Sources
Medical
