

Addressing Global Inequities in Positron Emission Tomography-Computed Tomography (PET-CT) for Cancer Management: A Statistical Model to Guide Strategic Planning
- PMID: 32848125
- PMCID: PMC7476356
- DOI: 10.12659/MSM.926544
Addressing Global Inequities in Positron Emission Tomography-Computed Tomography (PET-CT) for Cancer Management: A Statistical Model to Guide Strategic Planning
Abstract
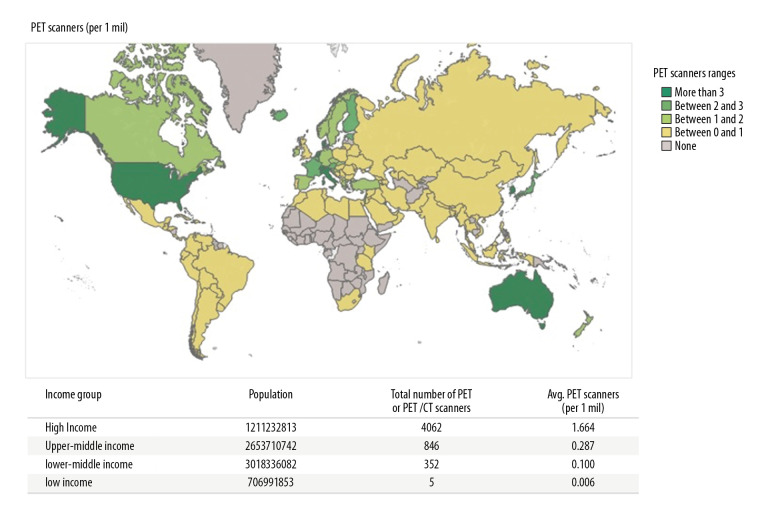
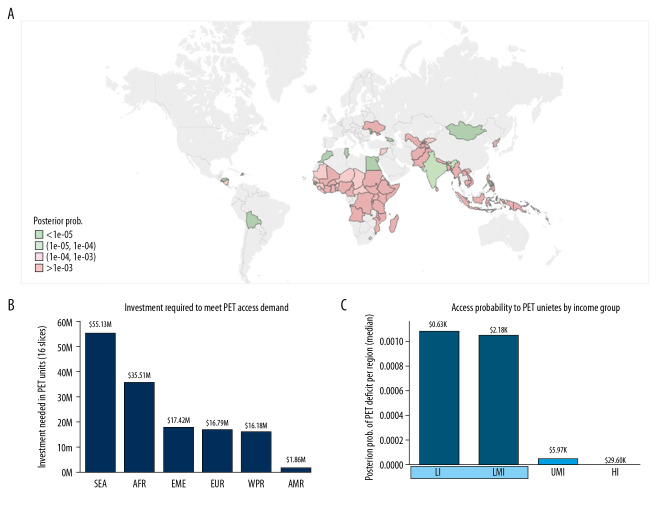
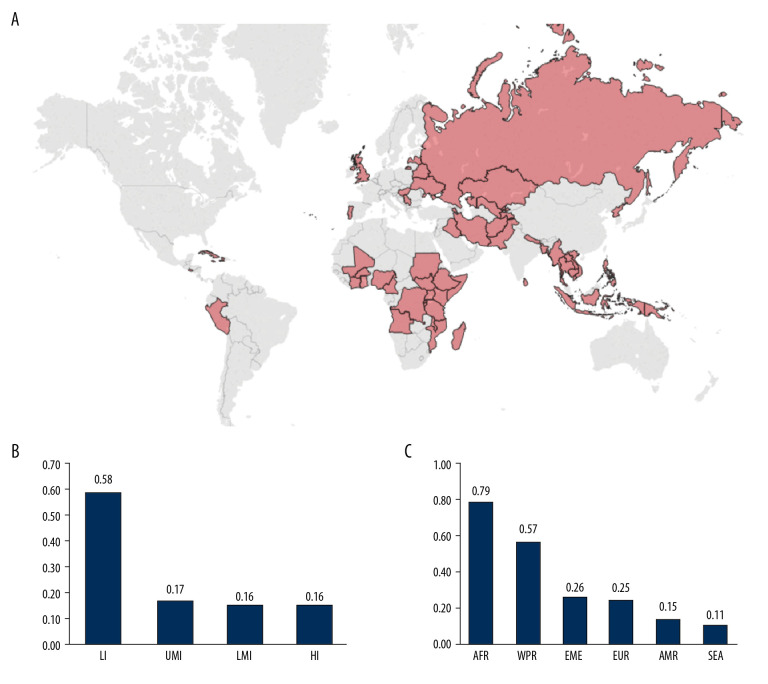
BACKGROUND According to the World Health Organization (WHO), non-communicable diseases are responsible for 71% of annual global mortality. National governments and international organizations are increasingly considering medical imaging and nuclear medicine access data in strategies to address epidemiologic priorities. Our objective here was to develop a statistical model to assist countries in estimating their needs for PET-CT systems for the management of specific cancer types. MATERIAL AND METHODS We introduce a patient-centered statistical model based on country-specific epidemiological data, PET-CT performance, and evidence-based clinical guidelines for PET-CT use for cancer. The output of the model was integrated into a Bayesian model to rank countries or world regions that would benefit the most from upscaling PET-CT scanners. RESULTS We applied our model to the IMAGINE database, recently developed by the International Atomic Energy Agency (IAEA). Our model indicates that at least 96 countries should upscale their PET-CT services and more than 200 additional PET-CT scanners would be required to fulfill their needs. The model also provides quantitative evidence indicating that low-income countries would benefit the most from increasing PET-CT provision. Finally, we discuss several cases in which the standard unit [number of scanners]/[million inhabitants] to guide strategic planning or address inequities is misleading. CONCLUSIONS Our model may help in the accurate delineation and further reduction of global inequities in access to PET-CT scanners. As a template, the model also has the potential to estimate the costs and socioeconomic impact of implementing any medical imaging modality for any clinical application.
Conflict of interest statement
None.
Figures
References
-
- IAEA Medical imAGIng and Nuclear mEdicine (IMAGINE) https://humanhealth.iaea.org/HHW/DBStatistics/IMAGINE.html.
-
- International Association of Cancer Registries (GLOBOCAN) http://www.iacr.com.fr/index.php?option=com_content&view=article&id=101&....
-
- Global cancer observatory. https://gco.iarc.fr/
MeSH terms
LinkOut - more resources
Full Text Sources
Medical
Research Materials
