. 2020 Aug 26;11(8):708.
doi: 10.1038/s41419-020-02915-x.

Tubeimoside I-induced lung cancer cell death and the underlying crosstalk between lysosomes and mitochondria

Affiliations

Tubeimoside I-induced lung cancer cell death and the underlying crosstalk between lysosomes and mitochondria

Kun Wang et al. Cell Death Dis. .

Abstract

Cancer cells have developed chemoresistance and have improved their survival through the upregulation of autophagic mechanisms that protect mitochondrial function. Here, we report that the traditional Chinese anticancer agent tubeimoside I (Tub), which is a potent inhibitor of autophagy, can promote mitochondria-associated apoptosis in lung cancer cells. We found that Tub disrupted both mitochondrial and lysosomal pathways. One of its mechanisms was the induction of DRP1-mediated mitochondrial fragmentation. Another mechanism was the blocking of late-stage autophagic flux via impairment of lysosomal acidification through V-ATPase inhibition; this blocks the removal of dysfunctional mitochondria and results in reactive oxygen species (ROS) accumulation. Excessive ROS accumulation causes damage to lysosomal membranes and increases lysosomal membrane permeability, which leads to the leakage of cathepsin B. Finally, cathepsin B upregulates Bax-mediated mitochondrial outer membrane permeability and, subsequently, cytosolic cytochrome C-mediated caspase-dependent apoptosis. Thus, the cancer cell killing effect of Tub is enhanced through the formation of a positive feedback loop. The killing effect of Tub on lung cancer cells was verified in xenografted mice. In summary, Tub exerts a dual anticancer effect that involves the disruption of mitochondrial and lysosomal pathways and their interaction and, thereby, has a specific and enhanced killing effect on lung cancer cells.


Conflict of interest statement

The authors declare that they have no conflict of interest.

Figures
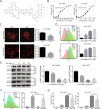
Fig. 1
Fig. 1. Tub induced mitochondrial fragmentation via downregulation of the phosphorylation of DRP1 at serine 637.
a Chemical structure of Tubeimoside I. b Cells of the lung cancer cell lines NCI-H1299 and NCI-H1975 were treated with Tub at the indicated concentration gradient for 24 h. Cell viability was determined with the CCK8 assay, and IC50 was calculated with the help of the GraphPad 6.0 software. The inhibition of cell viability increased with increase in the Tub dose. c Tub (20 μM) induced the fragmentation of mitochondria after treatment for 24 h (mitochondria were labeled with MitoTracker Red). The length of mitochondria was quantified by the Image J software (scale bar = 5 µm). d Tub induced an increase in the intracellular ROS level. After exposure to Tub at the indicated dosage for 24 h, intracellular ROS was probed with the H2DCFDA dye. The mean green fluorescence intensity represents the relative amount of ROS, which was analyzed by flow cytometry. e Tub significantly downregulated p-DRP1 (serine 637). f Mdi, a mitochondria fission inhibitor, resulted in a significant decrease in the ROS level in Tub-treated NCI-H1299 lung cancer cells. NCI-H1299 cells were treated with Tub (20 μM), Mdi (5 μM) or both for 24 h. ROS was probed with the H2DCFDA dye, and flow cytometry analysis was performed. g Mdi partially rescued the inhibitory effect of Tub on lung cancer cells. ***p < 0.001 vs. the indicated group.
Fig. 2
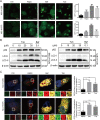
Fig. 2. Tub induced blocking of late-stage autophagic flux in lung cancer cells.
a Tub induced an increase in the number of GFP-LC3 puncta. GFP-LC3-overexpressing stable cell lines were treated with the vehicle, rapamycin (Rapa, 0.5 μM), bafilomycin A1 (Baf, 0.1 μM) or Tub (20 μM) for 24 h. Images of the cells were captured with a laser-scanning confocal microscope (scale bar = 20 µm). b Tub induced the upregulation of LC3-II and p62. c Lung cancer cells transfected with mCherry-GFP-LC3 tandem plasmids were treated with the vehicle, HBSS, Baf (0.1 μM) or Tub (20 μM) for 24 h. Like Baf treatment, Tub treatment also caused an increase in yellow fluorescence (creating by the merging of red and green fluorescence emitted by mCherry and GFP, respectively). The images were captured by a laser-scanning confocal microscope. The bar chart (right) represents the colocalization rate of GFP and mCherry, which was calculated with the Image J software (Scale bar = 5 µm). ***p < 0.001 vs. the indicated group.
Fig. 3
Fig. 3. Tub induced impairment of lysosomal acidification via inhibition of V-ATPase activity.
a The images were captured with a transmission electron microscope. The area within the white rectangle is enlarged and shown in the panels on the right. The red arrow indicates autolysosomes. b Colocalization of autophagosomes and lysosomes in lung cancer cells following Tub treatment. The autophagosomes are labelled by the GFP-LC3 (green fluorescence) protein and the lysosomes are labeled by LysoBriteTM Red (scale bar = 5 μm). c Tub significantly inhibited the acidification of lysosomes in lung cancer cells. LysoTracker Red was used as a fluorescent probe for acidic lysosomes, and is an indicator of lysosomal acidity (scale bar = 20 µm). d Tub treatment resulted in a significant decrease in the level of mature cathepsin D. e Tub (at concentrations of 10 and 20 μM) significantly inhibited V-ATPase activity; the effect was similar to that of Baf (at a concentration of 0.1 μM).
Fig. 4
Fig. 4. Excessive ROS results in an increase in LMP and leads to the cytosolic release of cathepsin B.
a Tub induced an increase in LMP. After exposure to Tub for 24 h, cells were stained with AO (5 μg/mL) for 20 min. The mean fluorescence intensity in the FL1 channel represents the extent of LMP. The bar chart was drawn from the flow cytometry results. b The level of cathepsins in the cytoplasm of lung cancer cells after Tub treatment. Cytosolic protein was extracted using a commercially available kit and subjected to western blot analysis. c The activity of cytosolic cathepsin B was significantly upregulated following Tub treatment. Cathepsin B activity is labelled by green fluorescence; lysosomes are labeled by red fluorescence (LysoBriteTM Red); and nuclei are labelled by blue staining with Hoechst 33342. The green fluorescence intensity in the cytosolic area represents the activity of cytosolic cathepsin B. Cathepsin B activity was quantified in more than 30 cells for each group with the help of the Image J software, and the data are presented in the right bar chart (scale bar = 5 µm). d Elimination of ROS by NAC (an ROS scavenger) reversed the increase in LMP induced by Tub. Lung cancer cells were treated with Tub (20 μM), NAC (ROS scavenger, 2 mM) or both Tub and NAC for 24 h. LMP was determined by AO staining for 20 min. A Q value of <0.85 indicates that NAC and Tub have an antagonistic effect on each other. e NAC treatment led to decreased activity of cytosolic cathepsin B in Tub-treated lung cancer cells (for details, see the description for panels c and d) (scale bar = 5 µm). f NAC partially reversed the lysosomal acidification in Tub-treated lung cancer cells. LysoTracker Red was used as a fluorescent probe for acid lysosomes (scale bar = 20 µm). *p < 0.05, **p < 0.01, ***p < 0.001 vs. the indicated groups.
Fig. 5
Fig. 5. Cytosolic cathepsin B induced an increase in MOMP.
a Tub induced upregulation of conformation-changed Bax and downregulation of cytochrome C in mitochondria, and an increase in cytochrome C in the cytoplasm. The mitochondrial and cytosolic fractions were extracted and subjected to western blot analysis. b Tub induced a significant increase in MOMP. NCI-H1975 cells were treated with Tub (20 μM) or CCCP (10 μM) for 24 h; CCCP was used as a positive control, as CCCP can induce the depolarization of mitochondria. Mitochondrial membrane potential (MMP) was measured with the JC-1 kit. c E64d, a cathepsin B inhibitor, significantly reversed the increase in MOMP induced by Tub. NCI-H1975 cells were treated with Tub (20 μM), E64d or both Tub and E64d for 24 h. The mitochondrial membrane potential (MMP) was measured with the JC-1 kit. d Treatment with E64d (20 μM) or CA (CA-074 methyl ester, 10 μM) (both inhibitors of cathepsin B) for 24 h resulted in a significant reduction in cytosolic cytochrome C in Tub-treated NCI-H1299 cells. **p < 0.01, ***p < 0.001 vs. the indicated groups.
Fig. 6
Fig. 6. Cathepsin B inhibition and ROS clearance reversed Tub-induced apoptosis in lung cancer cells.
a The apoptosis rate of NCI-H1299 cells after treatment with Tub at the indicated concentrations, as demonstrated by Annexin-V/PI staining and flow cytometry analysis. b The cleaved forms of PARP and Caspase 3 were upregulated in lung cancer cells following Tub treatment. c The cathepsin B inhibitor, in part, reversed the apoptosis in NCI-H1299 cells treated with Tub (the treatment details can be found in Fig. 5). d NAC (a ROS scavenger), in part, rescued the Tub-induced apoptosis in NCI-H1299 cells. *p < 0.05, **p < 0.01, ***p < 0.001 vs. the indicated groups.
Fig. 7
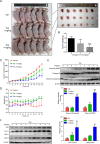
Fig. 7. Tub induced inhibition of xenografted lung tumor growth.
a Subcutaneous tumors were induced in nude mice by subcutaneous injection of NCI-H1299 cells in the right flank. When the tumors reached a diameter of 0.1 mm3, the mice were divided into three groups (n = 6 for each group) and subjected to intraperitoneal Tub administration at the indicated doses. b The tumors were resected and weighed on the 13th day of drug treatment; the 4 mg/kg dose was associated with a significant decrease in tumor weight as compared to the control group. c Tumor volume was measured every day, and was lower in the Tub-treated groups than in the control group. The displayed data were recorded from Day 1 after Tub treatment and presented as mean ± standard error. d The body weight of the mice was measured every day, and Tub treatment did not result in a decrease in the body weight. Data are presented as mean ± standard error. e, f The xenografted tumors were ground for protein extraction and western blot analysis of autophagy and apoptosis markers, which were significantly upregulated in the 4 mg/kg Tub group as compared to the control group. *p < 0.05, ***p < 0.001 vs. the indicated groups.
Fig. 8
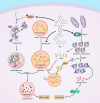
Fig. 8. Schematic representation of the proposed mechanisms underlying the antitumor effect of Tub in lung cancer cells.
As shown in the figure, Tub inhibits the late stage of autophagy flux by inhibiting the acidification of lysosomes (left). Additionally, Tub promotes mitochondrial fission and fragmentation, thereby leading to ROS accumulation (right). The accumulated ROS cannot be removed due to the blockage of autophagic flux; this causes further damage to the lysosomal membrane and leads to cathepsin B leakage from lysosomes. Cathepsin B present in the cytoplasm subsequently causes an increase in MOMP. This is accompanied by cytosolic cytochrome C-triggered caspase-dependent apoptosis. Thus, the antitumor effect of Tub is characterized by a positive feedback loop that prominently involves ROS.

Similar articles

Cited by

References

    1. Bray F, et al. Global cancer statistics 2018: GLOBOCAN estimates of incidence and mortality worldwide for 36 cancers in 185 countries. CA Cancer J. Clin. 2018;68:394–424. - PubMed
    1. Doroshow JH, Kummar S. Translational research in oncology—10 years of progress and future prospects. Nat. Rev. Clin. Oncol. 2014;11:649. doi: 10.1038/nrclinonc.2014.158. - DOI - PubMed
    1. Chen W, et al. Cancer statistics in China, 2015. CA Cancer J. Clin. 2016;66:115–132. - PubMed
    1. Siegel R, et al. Cancer treatment and survivorship statistics, 2012. CA Cancer J. Clin. 2012;62:220–241. doi: 10.3322/caac.21149. - DOI - PubMed
    1. Holohan C, Van Schaeybroeck S, Longley DB, Johnston PG. Cancer drug resistance: an evolving paradigm. Nat. Rev. Cancer. 2013;13:714. doi: 10.1038/nrc3599. - DOI - PubMed

Publication types

MeSH terms