. 2020 Aug 26;11(1):4267.
doi: 10.1038/s41467-020-18035-1.

ATAC-seq footprinting unravels kinetics of transcription factor binding during zygotic genome activation

Affiliations

ATAC-seq footprinting unravels kinetics of transcription factor binding during zygotic genome activation

Mette Bentsen et al. Nat Commun. .

Abstract

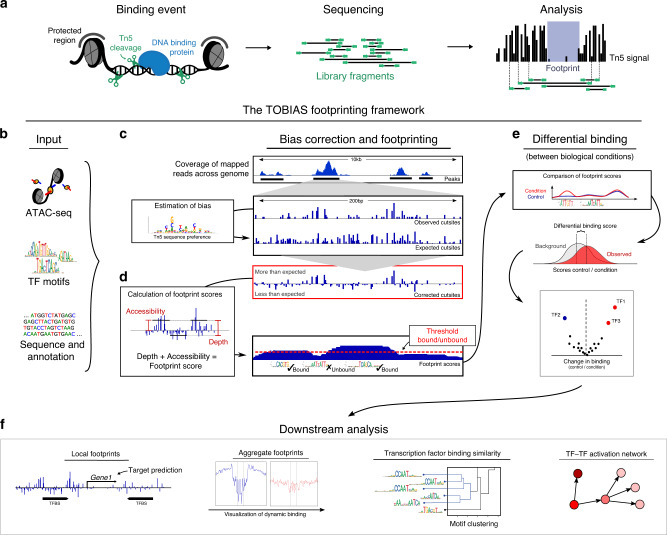
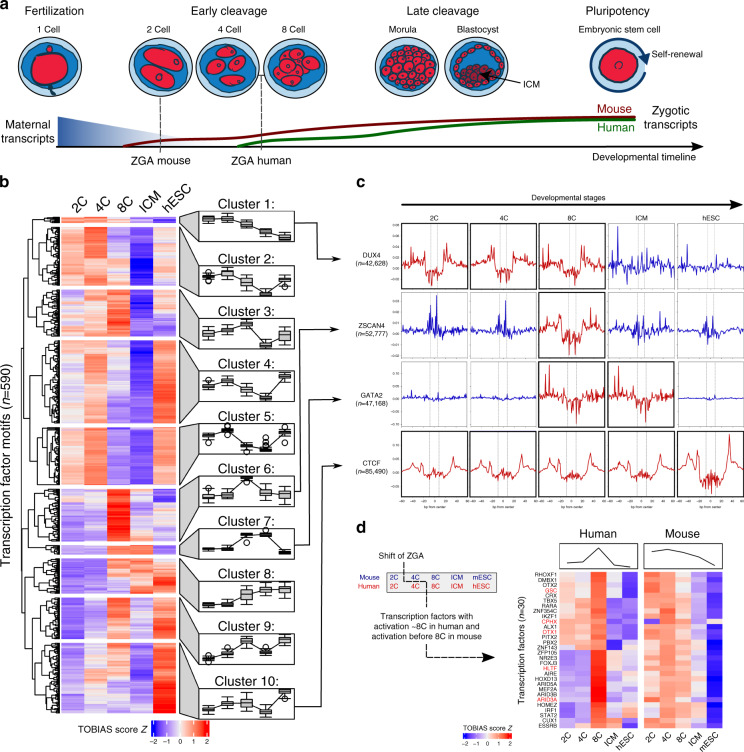
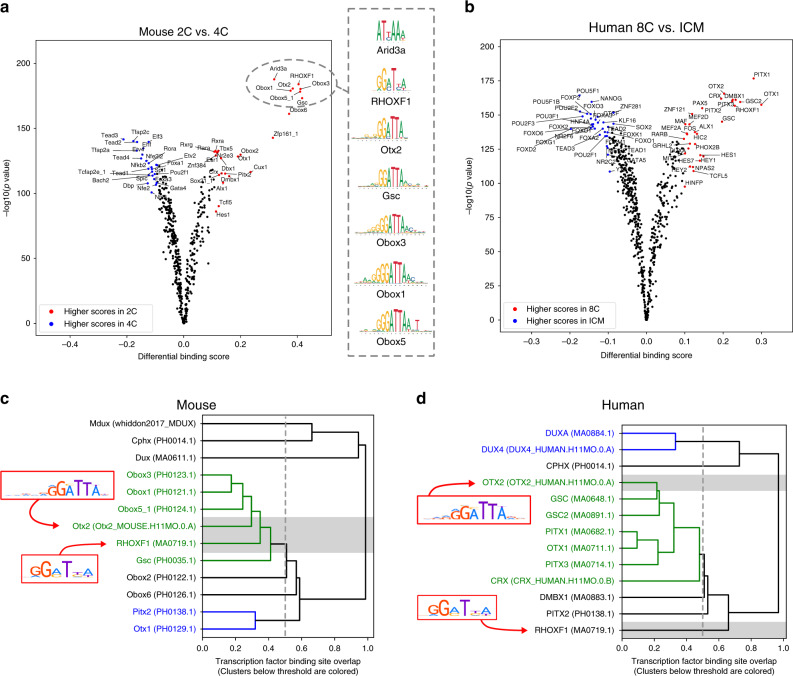
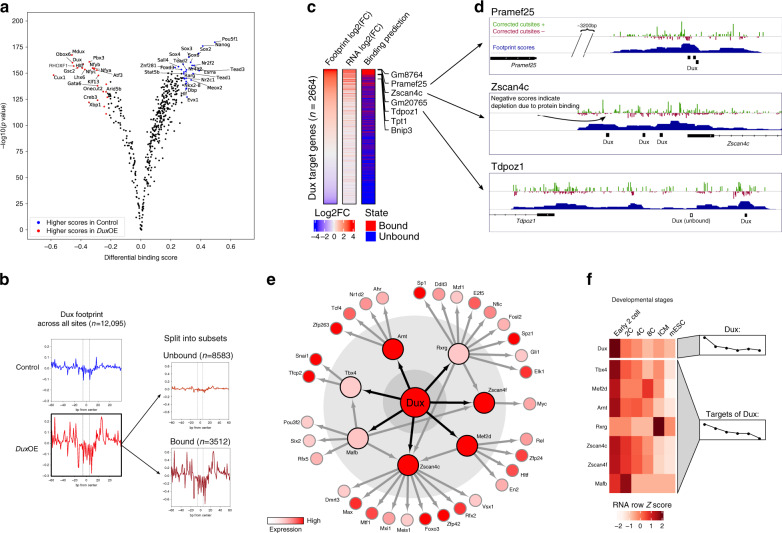
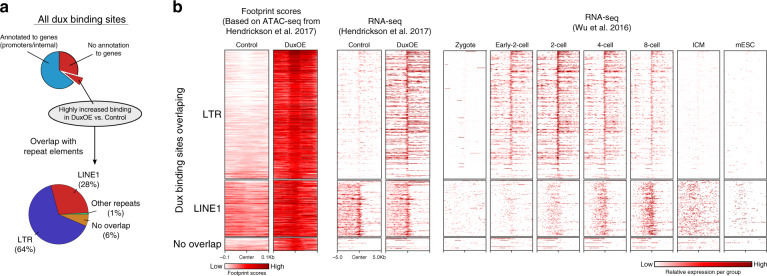
While footprinting analysis of ATAC-seq data can theoretically enable investigation of transcription factor (TF) binding, the lack of a computational tool able to conduct different levels of footprinting analysis has so-far hindered the widespread application of this method. Here we present TOBIAS, a comprehensive, accurate, and fast footprinting framework enabling genome-wide investigation of TF binding dynamics for hundreds of TFs simultaneously. We validate TOBIAS using paired ATAC-seq and ChIP-seq data, and find that TOBIAS outperforms existing methods for bias correction and footprinting. As a proof-of-concept, we illustrate how TOBIAS can unveil complex TF dynamics during zygotic genome activation in both humans and mice, and propose how zygotic Dux activates cascades of TFs, binds to repeat elements and induces expression of novel genetic elements.


Conflict of interest statement

The authors declare no competing interests.

Figures

Fig. 1
Fig. 1. The TOBIAS digital genomic footprinting framework.
a The concept of footprinting using ATAC-seq. Tn5 transposase cleaves DNA and inserts sequencing adapters, but is unable to cut chromatin occupied by proteins such as nucleosomes (gray) and other DNA binding proteins e.g., transcription factors (blue). Sequencing libraries of DNA fragments are sequenced to yield reads (green). During analysis, each read is mapped to the genome and used to create a signal of single Tn5 insertion events (black bars), in which binding of protein is visible as depletion of the signal (defined as the footprint). b TOBIAS uses reads from ATAC-seq, transcription factor motifs and sequence annotation in standard formats as input. c Bias correction of Tn5 signal. In the first step, TOBIAS reads the observed Tn5 cutsites and estimates the underlying Tn5 sequence preference. TOBIAS then calculates the expected Tn5 cutsites per region, which represent the background probability of Tn5 insertion. Using the expected signal track, the Tn5 bias corrected cutsites are obtained (red box). d Footprinting to estimate transcription factor binding. The corrected cutsites enable calculation of footprint scores with a scoring function taking into account both the accessibility and depth of the local footprint (as depicted in the box labeled “Calculation of footprint scores”). This continuous footprint score is correlated with the presence of transcription factor binding sites in the genome, and a threshold is set to distinguish between bound and unbound sites. e Differential footprinting. If multiple conditions are investigated, the differential binding module summarizes individual site scores (upper black box) for each TF, and compares them between conditions (gray/red curve center) in order to define differentially bound TFs. Performed on all TFs under investigation, a volcano plot illustrates the global changes in transcription factor binding. f Additional analysis modules. After the main TOBIAS analysis, a variety of downstream analysis can be applied including visualization of local and aggregated footprints across conditions, comparison of binding specificity between individual transcription factors and TF network prediction.
Fig. 2
Fig. 2. Global changes in transcription factor binding throughout embryonic development.
a Early embryonic development in human and mouse. While the fertilized egg undergoes a series of divisions, the maternal transcripts (blue curve) provided by the egg are depleted over time, and the zygotic genome is activated in waves (ZGA, red and green lines). ZGA initiates at the 2-cell stage in mouse and at the 4–8-cell stage in human. b Clustering of transcription factor activities throughout development. Each row represents one TF, each column a human developmental stage. TF activity scores from TOBIAS are Z-score transformed across rows. Blue color indicates low activity, red color indicates high activity. In order to visualize cluster trends, each cluster is associated with a mean trend line (left to right) and timepoint specific boxplots respectively. Source data are available in the Source Data file. c Bias corrected ATAC-seq footprints. For selected TFs with known roles in early development originating from four clusters (arrows from b), an aggregated footprinting plot matrix for all associated transcription factor binding sites is shown. Individual plots are centered around binding motifs (n = asterisk (*) relates to the number of binding sites). Rows indicate TFs DUX4, ZSCAN4, GATA2, and CTCF; columns illustrate developmental stages from left to right. Active binding of the individual TFs is visible as depletion in the signal around the binding site (highlighted in red). See Supplementary Figure 4a for corresponding uncorrected footprints. d TF activity onset in human and mouse. Heatmaps show activity of known ZGA-related TFs for human (left) and mouse (right) across matched timepoints 2C/8C/ICM/hESC (mESC). Transcription factors with known roles in ZGA are highlighted in bold red.
Fig. 3
Fig. 3. Specification of ZGA functions between mouse and human.
a, b Pairwise comparison of TF activity between developmental stages. The volcano plots show the differential binding activity against the −log10(p value) (both provided by TOBIAS) of all investigated TF motifs; each dot represents one motif. For a 2C stage specific TFs are labeled in red, 4C specific factors in blue. From the 2C specific TFs, seven prominent examples are chosen and illustrated by their motif. For b 8C stage specific TFs are labeled in red, ICM specific factors in blue. c, d Clustering of TF motifs based on binding-site overlap. Excerpt of the global TF clustering based on TF binding location, illustrating individual TFs as rows. The trees indicate genomic positional overlap of individual TFBS. A tree depth of 0.2 represents an overlap of 80% of the motifs. Each TF is indicated by name and unique ID in brackets. Clusters of TFs with more than 50% overlap (below 0.5 tree distance) are colored in green/blue. The position of TF motifs RHOXF1 and Otx2/OTX2 are highlighted. c shows overlap of motifs included in the mouse analysis. d shows clustering of human motifs. Complete TF trees are provided in Supplementary Notes 1 and 2.
Fig. 4
Fig. 4. Dux binding induces transcription at gene promoters.
a Comparison of TF activities between mDux GFP- (Control; labeled in blue) and mDux GFP + (DuxOE; labeled in red). Volcano plot showing the TOBIAS differential binding score on the x-axis and -log10 (p value) on the y-axis; each dot represents one TF. b Aggregated footprint plots for Dux. The aggregated plots are centered on the predicted binding sites for Dux between Control and DuxOE conditions (left: all genomic sites). The total possible binding sites for DuxOE (n = 12,095) are separated into bound and unbound sites (right). The dashed lines represent the edges of the Dux motif. c Change in expression of genes near Dux binding sites. The heatmap shows n = 2664 Dux binding sites found in gene promoters. Footprint log2(FC) and RNA log2(FC) represent the matched changes between Control and DuxOE for footprints and gene expression, respectively. Log2(FC) is calculated as log2(DuxOE/Control). The column Binding prediction depicts whether the binding site was predicted by TOBIAS to be bound/unbound in the DuxOE condition. d Genomic tracks indicating three exemplary Dux binding sites and their target gene promoters and respective tracks for corrected cutsite signals (red/blue), TOBIAS footprint scores (blue), detected motifs (black boxes), and gene locations (solid black boxes with arrows indicating gene strand). e Dux transcription factor network. The TF-TF network is built of all TFBS with binding in TF promoters with increasing strength in DuxOE (log2(FC) > 0). Sizes of nodes represent the level of the network starting with Dux (Large: Dux, Medium: 1st level, Small: 2nd level). Nodes are colored based on corresponding RNA level in the DuxOE condition. Directed edges indicate binding sites in the respective gene promoter found by the TOBIAS CreateNetwork module. f Correlation of the Dux transcription factor network to expression during development. The heatmap depicts the in vivo gene expression during developmental stages. The right-hand group annotation highlights the difference in mean expression for each timepoint. The heatmap is split into Dux and target genes of Dux. Source data are available in the Source Data file.
Fig. 5
Fig. 5. Dux binding influences expression of repeat elements.
a Dux binding sites overlap with repeat elements. All potential Dux binding sites are split into sites either overlapping promoters/genes or without annotation to any known genes (upper circle, blue/red). The bottom pie chart shows a subset of the latter, additionally having highly increased binding (log2(FC) > 1), annotated to repeat elements including LTR/LINE1 elements. b Dux induces expression of transcripts specific for preimplantation. Genomic signals for the Dux binding sites which are bound in DuxOE with log2(FC) footprint score >1 (i.e., upregulated in DuxOE) are split into overlapping either LTR, LINE1 or no known genetic elements (top to bottom); each row indicates one binding-site/associated gene loci. Footprint scores (±100 bp from Dux binding sites, left column) indicate the differential Dux binding between control and DuxOE (in vitro). RNA-seq shows the normalized read-counts from matched RNA-seq samples (center columns, in vitro) and throughout development (right columns, in vivo) within ±5 kb of the respective Dux binding sites. Dark red color indicates high expression.

Similar articles

Cited by

References

    1. Buenrostro JD, Giresi PG, Zaba LC, Chang HY, Greenleaf WJ. Transposition of native chromatin for fast and sensitive epigenomic profiling of open chromatin, DNA-binding proteins and nucleosome position. Nat. Methods. 2013;10:1213–1218. - PMC - PubMed
    1. Hendrickson PG, et al. Conserved roles of mouse DUX and human DUX4 in activating cleavage-stage genes and MERVL/HERVL retrotransposons. Nat. Genet. 2017;49:925–934. - PMC - PubMed
    1. Eckersley-Maslin MA, et al. MERVL/Zscan4 network activation results in transient genome-wide DNA demethylation of mESCs. Cell Rep. 2016;17:179–192. - PMC - PubMed
    1. Madissoon E, et al. Characterization and target genes of nine human PRD-like homeobox domain genes expressed exclusively in early embryos. Sci. Rep. 2016;6:28995. - PMC - PubMed
    1. Hesselberth JR, et al. Global mapping of protein-DNA interactions in vivo by digital genomic footprinting. Nat. Methods. 2009;6:283–289. - PMC - PubMed

Publication types