

Multidrug transporter MRP4/ABCC4 as a key determinant of pancreatic cancer aggressiveness
- PMID: 32848164
- PMCID: PMC7450045
- DOI: 10.1038/s41598-020-71181-w
Multidrug transporter MRP4/ABCC4 as a key determinant of pancreatic cancer aggressiveness
Abstract
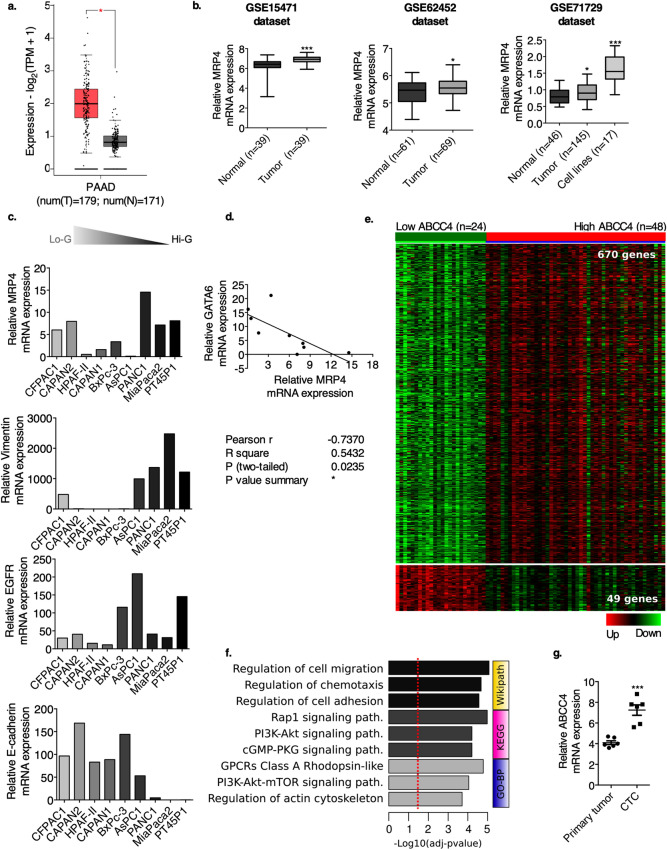
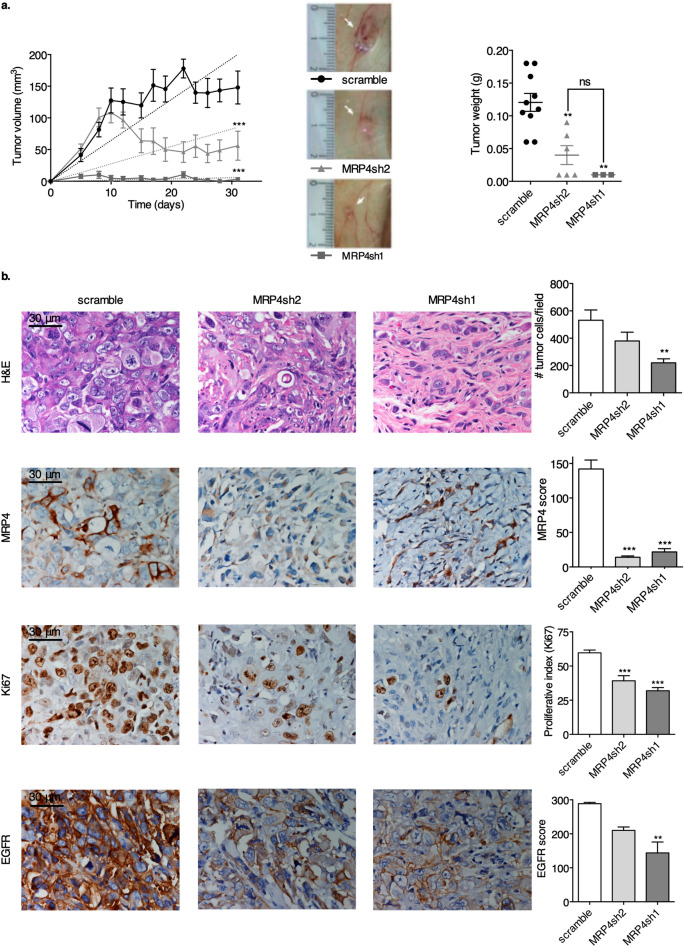
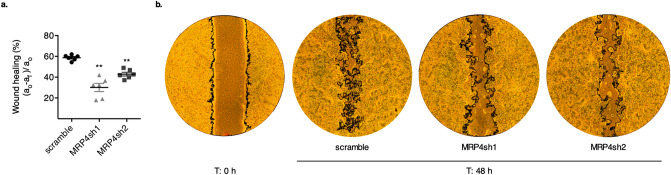
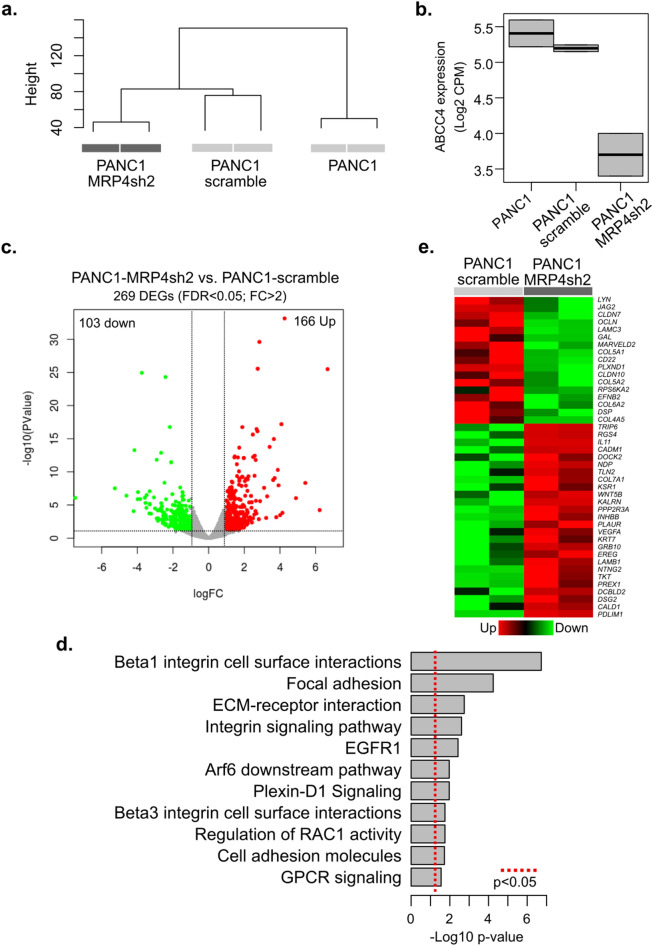
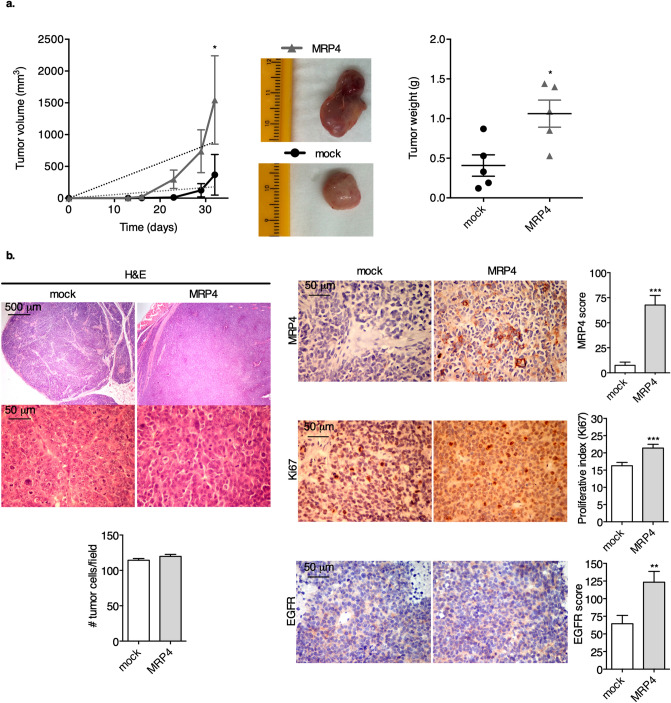
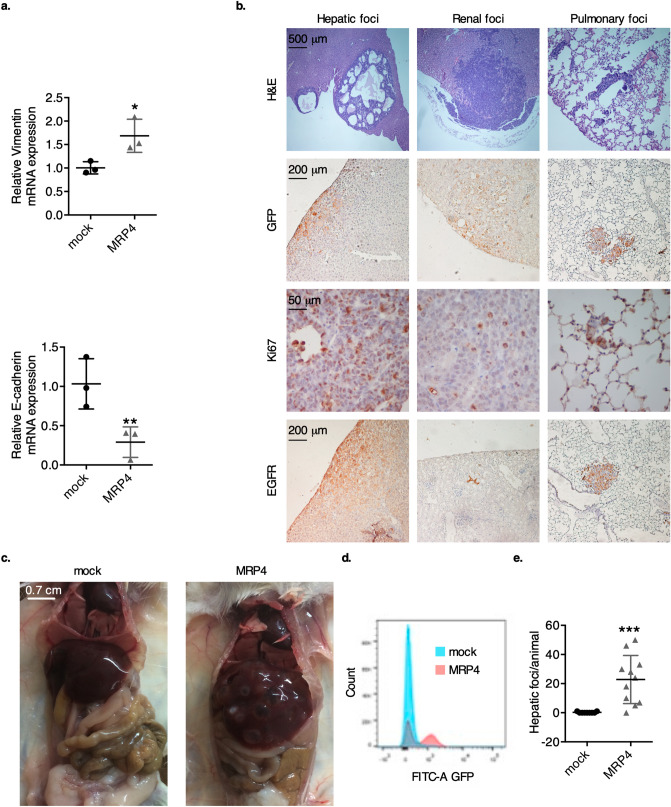
Recent findings show that MRP4 is critical for pancreatic ductal adenocarcinoma (PDAC) cell proliferation. Nevertheless, the significance of MRP4 protein levels and function in PDAC progression is still unclear. The aim of this study was to determine the role of MRP4 in PDAC tumor aggressiveness. Bioinformatic studies revealed that PDAC samples show higher MRP4 transcript levels compared to normal adjacent pancreatic tissue and circulating tumor cells express higher levels of MRP4 than primary tumors. Also, high levels of MRP4 are typical of high-grade PDAC cell lines and associate with an epithelial-mesenchymal phenotype. Moreover, PDAC patients with high levels of MRP4 depict dysregulation of pathways associated with migration, chemotaxis and cell adhesion. Silencing MRP4 in PANC1 cells reduced tumorigenicity and tumor growth and impaired cell migration. Transcriptomic analysis revealed that MRP4 silencing alters PANC1 gene expression, mainly dysregulating pathways related to cell-to-cell interactions and focal adhesion. Contrarily, MRP4 overexpression significantly increased BxPC-3 growth rate, produced a switch in the expression of EMT markers, and enhanced experimental metastatic incidence. Altogether, our results indicate that MRP4 is associated with a more aggressive phenotype in PDAC, boosting pancreatic tumorigenesis and metastatic capacity, which could finally determine a fast tumor progression in PDAC patients.
Conflict of interest statement
The authors declare no competing interests
Figures
Similar articles
-
Identification of MRP4/ABCC4 as a Target for Reducing the Proliferation of Pancreatic Ductal Adenocarcinoma Cells by Modulating the cAMP Efflux.Mol Pharmacol. 2019 Jul;96(1):13-25. doi: 10.1124/mol.118.115444. Epub 2019 May 1. Mol Pharmacol. 2019. PMID: 31043460
-
Flurbiprofen inhibits cAMP transport by MRP4/ABCC4 increasing the potency of gemcitabine treatment in PDAC cell models.Int J Biol Macromol. 2024 Nov;280(Pt 4):136386. doi: 10.1016/j.ijbiomac.2024.136386. Epub 2024 Oct 6. Int J Biol Macromol. 2024. PMID: 39378921
-
The xenobiotic transporter ABCC4/MRP4 promotes epithelial mesenchymal transition in pancreatic cancer.Front Pharmacol. 2024 Jul 24;15:1432851. doi: 10.3389/fphar.2024.1432851. eCollection 2024. Front Pharmacol. 2024. PMID: 39114357 Free PMC article.
-
Enhancer of zeste homolog 2 silences microRNA-218 in human pancreatic ductal adenocarcinoma cells by inducing formation of heterochromatin.Gastroenterology. 2013 May;144(5):1086-1097.e9. doi: 10.1053/j.gastro.2013.01.058. Epub 2013 Feb 7. Gastroenterology. 2013. PMID: 23395645
-
Increased Serotonin Signaling Contributes to the Warburg Effect in Pancreatic Tumor Cells Under Metabolic Stress and Promotes Growth of Pancreatic Tumors in Mice.Gastroenterology. 2017 Jul;153(1):277-291.e19. doi: 10.1053/j.gastro.2017.03.008. Epub 2017 Mar 15. Gastroenterology. 2017. PMID: 28315323
Cited by
-
Endosomal Sorting Protein SNX27 and Its Emerging Roles in Human Cancers.Cancers (Basel). 2022 Dec 22;15(1):70. doi: 10.3390/cancers15010070. Cancers (Basel). 2022. PMID: 36612066 Free PMC article. Review.
-
The Impact of Modifying Sunitinib Treatment Scheduling on Renal Cancer Tumor Biology and Resistance.J Clin Med. 2022 Jan 13;11(2):369. doi: 10.3390/jcm11020369. J Clin Med. 2022. PMID: 35054064 Free PMC article.
-
ABCC4 suppresses glioblastoma progression and recurrence by restraining cGMP-PKG signalling.Br J Cancer. 2024 May;130(8):1324-1336. doi: 10.1038/s41416-024-02581-2. Epub 2024 Feb 12. Br J Cancer. 2024. PMID: 38347095 Free PMC article.
-
Progress and challenges of multidrug resistance proteins in diseases.Am J Cancer Res. 2022 Oct 15;12(10):4483-4501. eCollection 2022. Am J Cancer Res. 2022. PMID: 36381332 Free PMC article. Review.
-
A New Histology-Based Prognostic Index for Aggressive T-Cell lymphoma: Preliminary Results of the "TCL Urayasu Classification".J Clin Med. 2024 Jun 30;13(13):3870. doi: 10.3390/jcm13133870. J Clin Med. 2024. PMID: 38999437 Free PMC article.
References
-
- Siegel RL, Miller KD, Jemal A. Cancer statistics, 2020. CA. Cancer J. Clin. 2020;70:7–30. - PubMed
-
- Rahib L, et al. Projecting cancer incidence and deaths to 2030: The unexpected burden of thyroid, liver, and pancreas cancers in the United States. Cancer Res. 2014;74:2913–2921. - PubMed
-
- Haimeur A, Conseil G, Deeley RG, Cole SPC. The MRP-related and BCRP/ABCG2 multidrug resistance proteins: Biology, substrate specificity and regulation. Curr. Drug Metab. 2004;5:21–53. - PubMed
-
- Sun Y, et al. ABCC4 copy number variation is associated with susceptibility to esophageal squamous cell carcinoma. Carcinogenesis. 2014;35:1941–1950. - PubMed
Publication types
MeSH terms
Substances
LinkOut - more resources
Full Text Sources
Medical
