

Holistic approach to assess co-benefits of local climate mitigation in a hot humid region of Australia
- PMID: 32848173
- PMCID: PMC7450084
- DOI: 10.1038/s41598-020-71148-x
Holistic approach to assess co-benefits of local climate mitigation in a hot humid region of Australia
Abstract
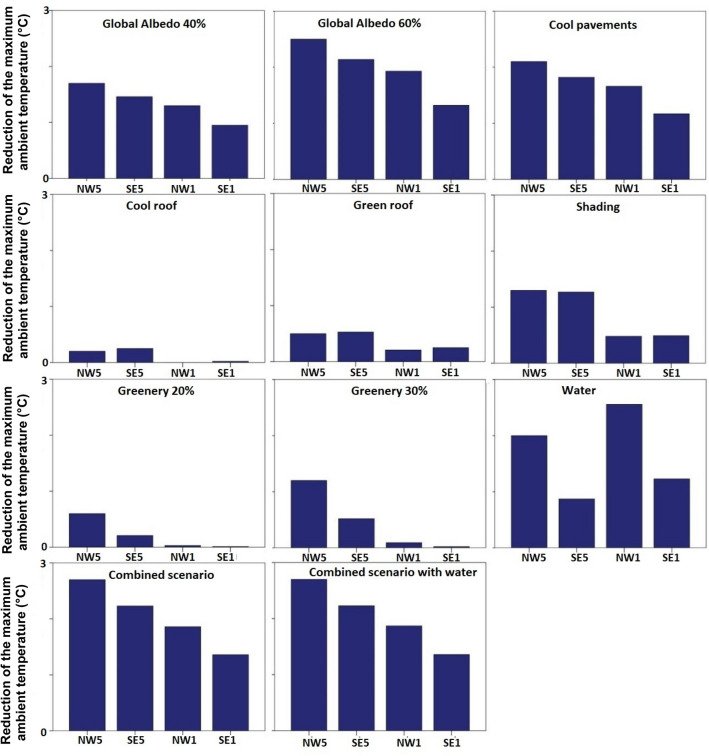
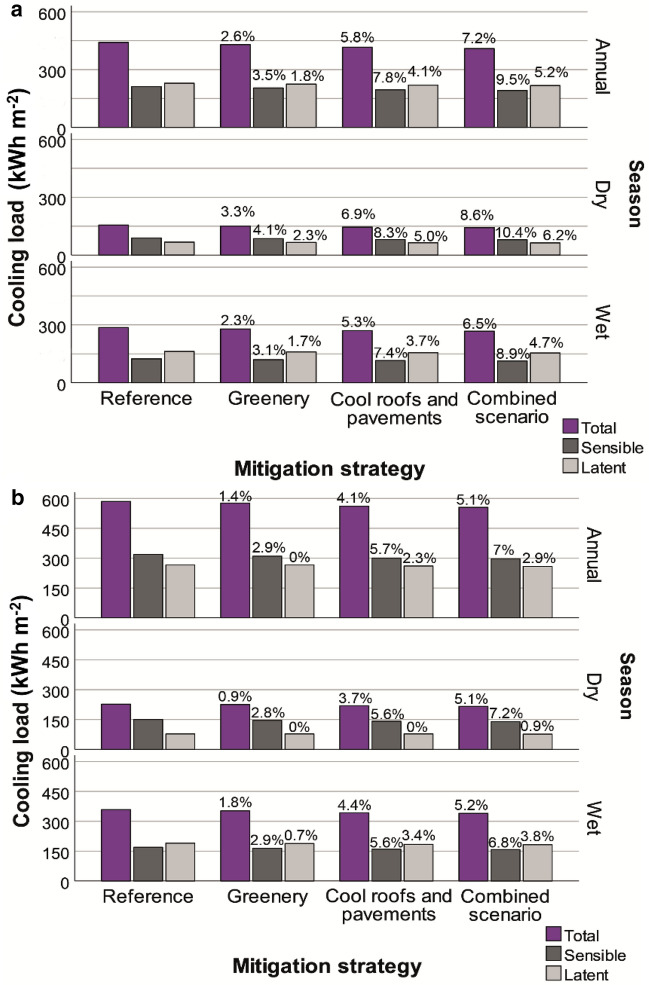
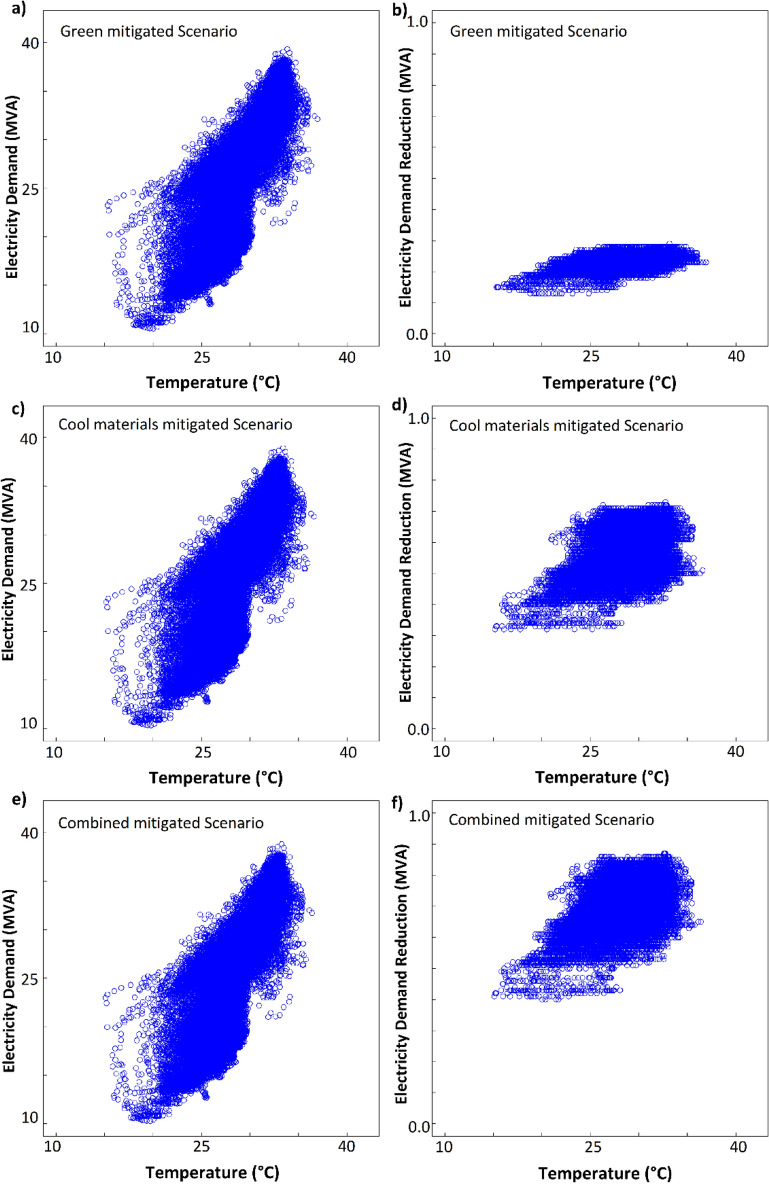
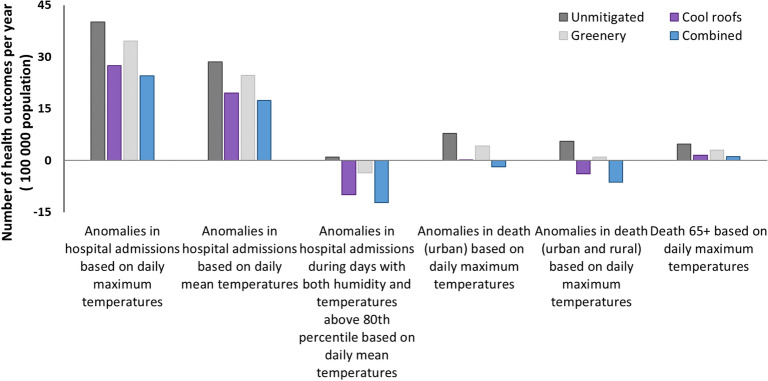
Overheated outdoor environments adversely impact urban sustainability and livability. Urban areas are particularly affected by heat waves and global climate change, which is a serious threat due to increasing heat stress and thermal risk for residents. The tropical city of Darwin, Australia, for example, is especially susceptible to urban overheating that can kill inhabitants. Here, using a modeling platform supported by detailed measurements of meteorological data, we report the first quantified analysis of the urban microclimate and evaluate the impacts of heat mitigation technologies to decrease the ambient temperature in the city of Darwin. We present a holistic study that quantifies the benefits of city-scale heat mitigation to human health, energy consumption, and peak electricity demand. The best-performing mitigation scenario, which combines cool materials, shading, and greenery, reduces the peak ambient temperature by 2.7 °C and consequently decreases the peak electricity demand and the total annual cooling load by 2% and 7.2%, respectively. Further, the proposed heat mitigation approach can save 9.66 excess deaths per year per 100,000 people within the Darwin urban health district. Our results confirm the technological possibilities for urban heat mitigation, which serves as a strategy for mitigating the severity of cumulative threats to urban sustainability.
Conflict of interest statement
The authors declare no competing interests.
Figures
References
-
- Ramaswami, A. et al. Sustainable Urban Systems: Articiulating a Long-Term Convergence Research Agenda (2018).
-
- Contestabile M. Future urban research. Nat. Sustain. 2018;1:114–114. doi: 10.1038/s41893-018-0037-9. - DOI
-
- Oke TR. The energetic basis of the urban heat island. Q. J. R. Meteorol. Soc. 1982;108:1–24. doi: 10.1002/qj.49710845502. - DOI
-
- McCarthy MP, Best MJ, Betts RA. Climate change in cities due to global warming and urban effects. Geophys. Res. Lett. 2010;37:L09705.
-
- Santamouris M. Analyzing the heat island magnitude and characteristics in one hundred Asian and Australian cities and regions. Sci. Total Environ. 2015;512:582–598. - PubMed
Publication types
LinkOut - more resources
Full Text Sources
