. 2020 Aug 26;10(1):14218.
doi: 10.1038/s41598-020-71096-6.

Post-translational modification as a response to cellular stress induced by hemoglobin oxidation in sickle cell disease

Affiliations

Post-translational modification as a response to cellular stress induced by hemoglobin oxidation in sickle cell disease

Michael Brad Strader et al. Sci Rep. .

Abstract

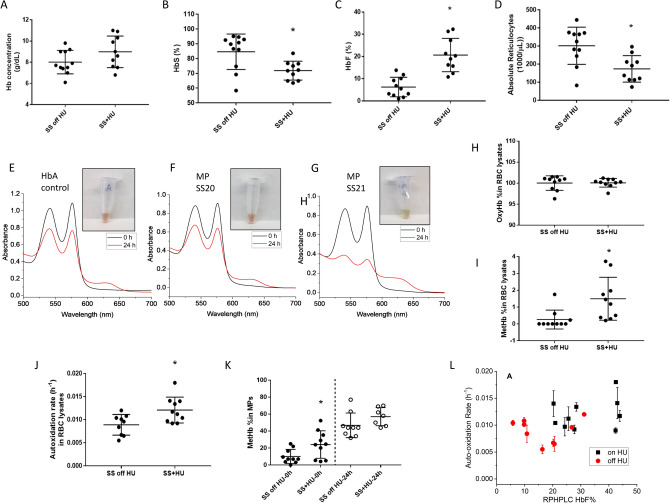
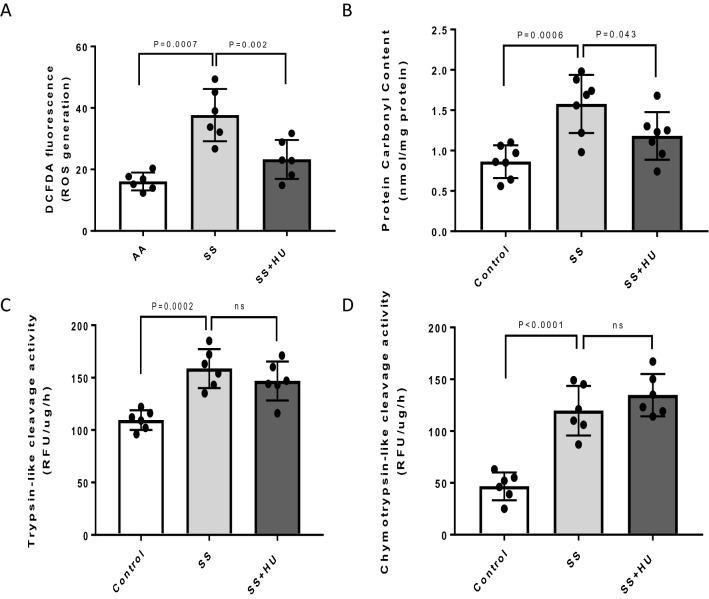
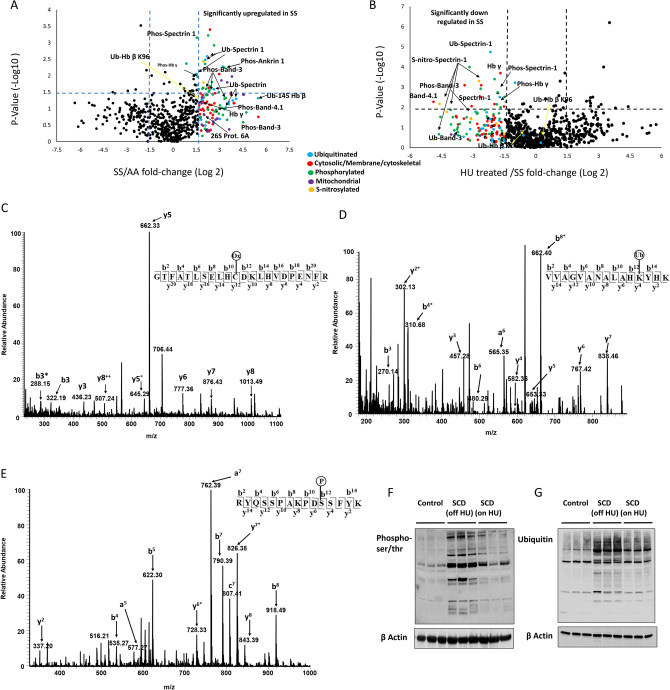
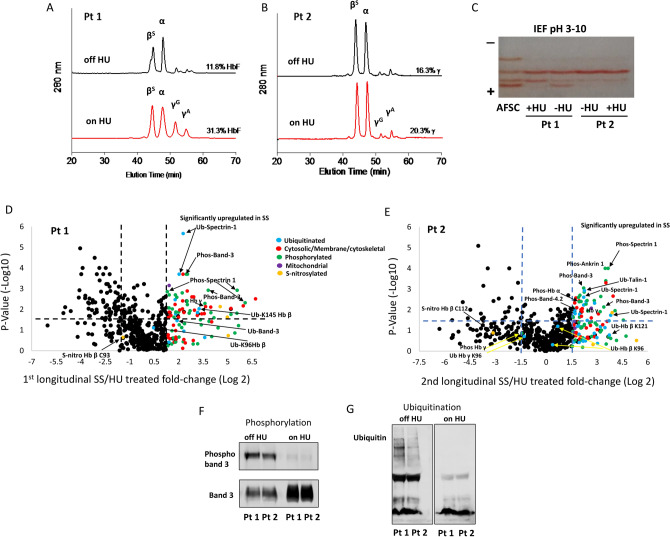
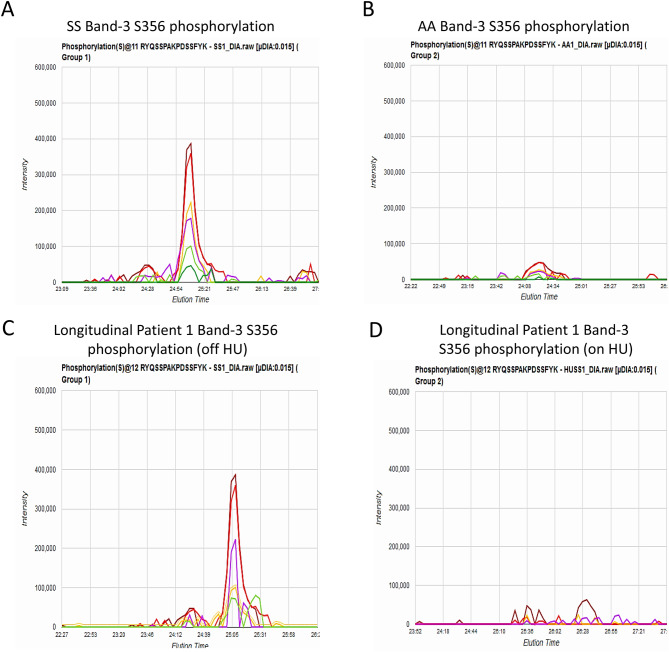
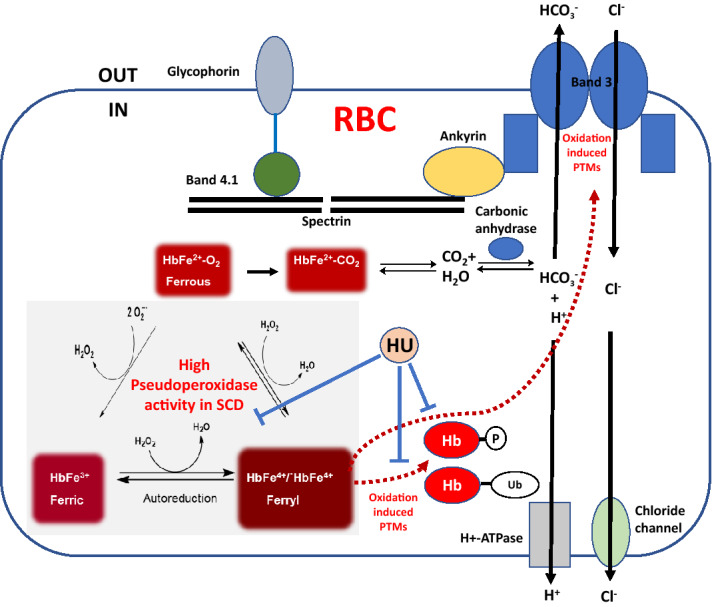
Intracellular oxidative stress and oxidative modification of sickle hemoglobin (HbS) play a role in sickle cell disease (SCD) pathogenesis. Recently, we reported that Hb-dependent oxidative stress induced post-translational modifications (PTMs) of Hb and red blood cell (RBC) membrane proteins of transgenic SCD mice. To identify the mechanistic basis of these protein modifications, we followed in vitro oxidative changes occurring in intracellular Hb obtained from RBCs and RBC-derived microparticles (MPs) from the blood of 23 SCD patients (HbSS) of which 11 were on, and 12, off hydroxyurea (HU) treatment, and 5 ethnic matched controls. We used mass spectrometry-based proteomics to characterize these oxidative PTMs on a cross-sectional group of these patients (n = 4) and a separate subgroup of patients (n = 2) studied prior to initiation and during HU treatment. Collectively, these data indicated that band-3 and its interaction network involved in MPs formation exhibited more protein phosphorylation and ubiquitination in SCD patients than in controls. HU treatment reversed these oxidative PTMs back to level observed in controls. These PTMs were also confirmed using orthogonal immunoprecipitation experiments. Moreover, we observed specific markers reflective of oxidative stress, including irreversible oxidation of βCys93 and ubiquitination of Hb βLys145 (and βLys96). Overall, these studies strongly suggest that extensive erythrocyte membrane protein phosphorylation and ubiquitination are involved in SCD pathogenesis and provide further insight into the multifaceted effects of HU treatment.


Conflict of interest statement

The authors declare no competing interests.

Figures

Figure 1
Figure 1
Hematologic and oxidation profiles of RBC lysates and RBC derived MPs from SCD patients. Hb concentration (A) and the fraction components of HbS (B), HbF (C) and absolute reticulocytes (D) in SCD patients blood. Kinetic absorbance spectra representing oxidation (autoxidation spectra) of MP solutions form two SCD patients (FG) during incubation of samples for 24 h compared to spectra collected for HbA control (E) during the same time period. Insets (E, F, G) are images of the reaction soutions taken for over time intervals and temperature, 37C°. (H, I) the contents of the various redox state of Hb (oxyHb and metHb) during autoxidation of MP solutions in the SCD blood lysates; (J, K) are plots of autoxidation rates dreived from lysate incubation (24 h) and metHb precentages in MP solutions taken at t = 0 and t = 24 h from patients who were either on or without HU treatement; (L) the relationship between autoxidation rates and HbF content (tested by RP-HPLC method) in the SCD RBC lysates.
Figure 2
Figure 2
Oxidative stress markers and proteasomal activities in red blood cells from sickle cell disease patients. (A) Reactive oxygen (ROS) species were measured by the DCFDA method (see Materials and methods) in RBCs from control subjects (AA), untreated SCD patients (SS) and SCD patients treated with hydroxyurea (SS + HU). (B) Protein carbonylation was measured in RBCs using an antibody against DNP following derivatization of DNPH (see Materials and methods); (C) Trypsin-like and (D) Chymotrypsin-like proteasomal activities were measured in RBCs from different group of patients as described in the methods section. Bars represent average mean value, each dot in the bars represent individual data points and vertical error bars represent SEM. ns non significant.
Figure 3
Figure 3
Comprehensive comparative analysis of microparticle proteomes. Each volcano plot shows P values (− log10) for each protein quantified versus the calculated fold change (Log2) difference (of each specific protein assayed by mass spectrometry) in (A) SS relative to AA MPs and (B) HU treated SS relative to SS MPs. For both volcano plots, peptide MS/MS chromatogram intensity values were used for all the quantifiable peptides detected from each individual protein using a 5% protein false discovery rate (FDR). P values were generated from applying a two-tailed t-test statistic to protein level fold-change values for each mouse biological condition. All points (for both volcano plots) on or above the dashed horinzontal line to the X axis represent proteins with P values of 0.05 or lower. All points that are on or to the left of the first dashed verrtical line parallel to the Y axis represent proteins that are down regulated in SS mice 1.5 fold or to or greater. All points that are on or to the right of the second vertical dashed line parallel to the Y axis represent proteins that upregulated in SS mice 1.5 fold or greater. (C) MS/MS fragmentation spectra representing y and b fragment ions matched to the Hb tryptic peptide GTFATSELHCDKLHVDPENFR (residues 83-104) containing cysteic acid (48 Da) at βcys93 (D) to the Hb tryptic peptide VVAGVANALAHKYHK (residues 335133-145) containing the ubiquitin di-glycine signature modification (114 Da) at βLys145 and (E) to the band-3 tryptic peptide showing resulting from a signature neutral loss associated with phosphorylation (98 Da) at Ser356. Proteins from RBC lysates of control subjects and SCD patients (on and off HU) were resolved by SDS-PAGE and immunoblotted using anti-phospho serine-threonine antibody (F) or anti-ubiquitin antibody (G) to assess phosphorylation and ubiquitination in RBC. Lower panels show β-actin protein levels for corresponding blot.
Figure 4
Figure 4
Longitudinal study of red cell lysates and microparticles from sickle cell disease patients “on” or “off” hydroxyurea treatment. (AC) Reverse-phase HPLC and IEF analyses of RBC lysates from two separate SCD patients (Pt 1 and Pt 2) collected before (black line) and after HU treatment (red line). Volcano plots representing proteomic comparisons for (D) technical replicates patient 1 (Pt 1) with and without HU treatment and (E) patient 2 (Pt 2) with and without HU treatment. Each volcano plot was generated as described above in Fig. 3. (F) Band3 protein was immunoprecipitated from RBC lysates of two SS patients (Pt 1 and Pt 2) before (off) and after (on) HU treatment using an anti-band 3 antibody and then probed with phospho-ser/thr antibody to assess phosphorylation levels. (G) Proteins from RBC lysates of two SCD patients (Pt 1 and Pt 2) before (off) and after (on) treatment with HU were resolved by SDS-PAGE and immunoblotted using an anti-ubiquitin antibody.
Figure 5
Figure 5
Direct quantification of band-3 Ser356 phosphorylation using MS2 fragment ion chromatograms. MS2 fragment ion chromatograms for the band-3 Ser356 containing phosphopeptide (RYQSSPAKPDSFYK) from (A) SS band-3 phosphorylation (B) AA band-3 phosphorylation (C) SS Longitudinal Patient 1 band-3 phosphorylation (D) HU treated SS Longitudinal 1 band-3 phosphorylation. Each band-3 tryptic peptide was identified from a signature nuetral loss associated with phosphorylation (98 Da) at Ser356. These data indicate that HU treatment reverses the modification status to control levels (seen in Panel B).
Figure 6
Figure 6
Proposed model for the effects of hemoglobin-dependent oxidation reactions on Band 3 and other membrane proteins in sickle RBC. Membrane bound band-3 and its network of structural proteins provide efficient anion exchange of bicarbonate (out) in exchange for chloride (in). Hemoglobin plays a critical role in the removal of CO2 (~ 80%) by converting it to bicarbonate catalyzed by the enzyme carbonic anhydrase. Hemoglobin-dependent conformation (deoxy/oxy) interaction with band-3 proteins has been shown to regulate glycolysis in red blood cell. We propose, that a redox transition of hemoglobin into higher oxidation states through its pseudoperoxidative cycle may interact with band 3 resulting in oxidative modifications of band 3 network of proteins in sickle cell disease and can promote post-translational changes e.g. phosphorylation (P) and ubiquitination (Ub) of hemoglobin itself. Hydroxyurea (HU) can inhibit some of these pathways as indicated by solid blue lines. Adapted with modification from Jay, Cell, 1996.

References

    1. Eaton WA, Bunn HF. Treating sickle cell disease by targeting HbS polymerization. Blood. 2017;129:2719–2726. doi: 10.1182/blood-2017-02-765891. - DOI - PMC - PubMed
    1. Bunn HF. Pathogenesis and treatment of sickle cell disease. N Engl J Med. 1997;337:762–769. doi: 10.1056/nejm199709113371107. - DOI - PubMed
    1. Camus SM, et al. Circulating cell membrane microparticles transfer heme to endothelial cells and trigger vasoocclusions in sickle cell disease. Blood. 2015;125:3805–3814. doi: 10.1182/blood-2014-07-589283. - DOI - PMC - PubMed
    1. Camus SM, et al. Erythrocyte microparticles can induce kidney vaso-occlusions in a murine model of sickle cell disease. Blood. 2012;120:5050–5058. doi: 10.1182/blood-2012-02-413138. - DOI - PubMed
    1. Alayash AI. Oxidative pathways in the sickle cell and beyond. Blood Cells Mol. Dis. 2018;70:78–86. doi: 10.1016/j.bcmd.2017.05.009. - DOI - PMC - PubMed

Publication types