. 2020 Aug;584(7822):608-613.
doi: 10.1038/s41586-020-2632-y. Epub 2020 Aug 26.

Heterotypic cell-cell communication regulates glandular stem cell multipotency

Affiliations

Heterotypic cell-cell communication regulates glandular stem cell multipotency

Alessia Centonze et al. Nature. 2020 Aug.

Abstract

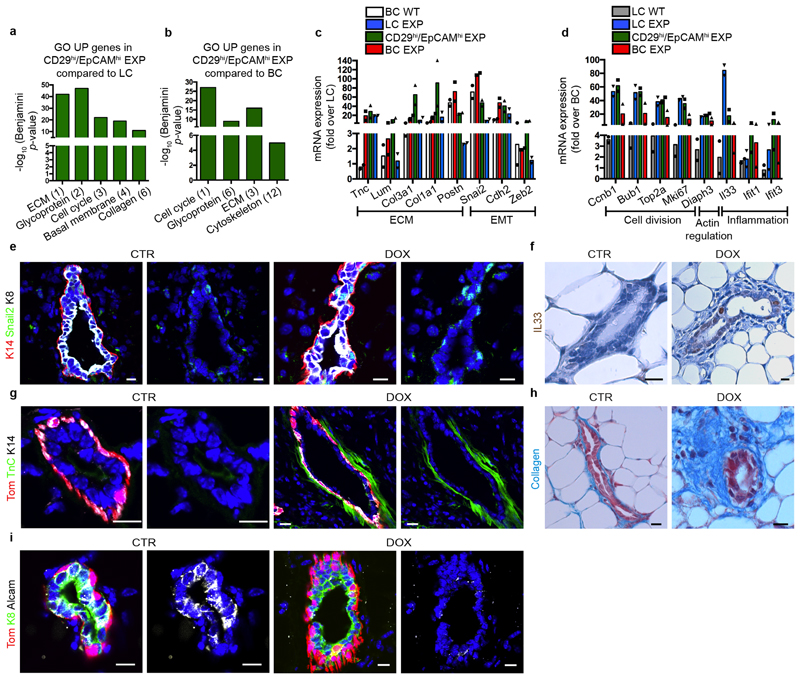
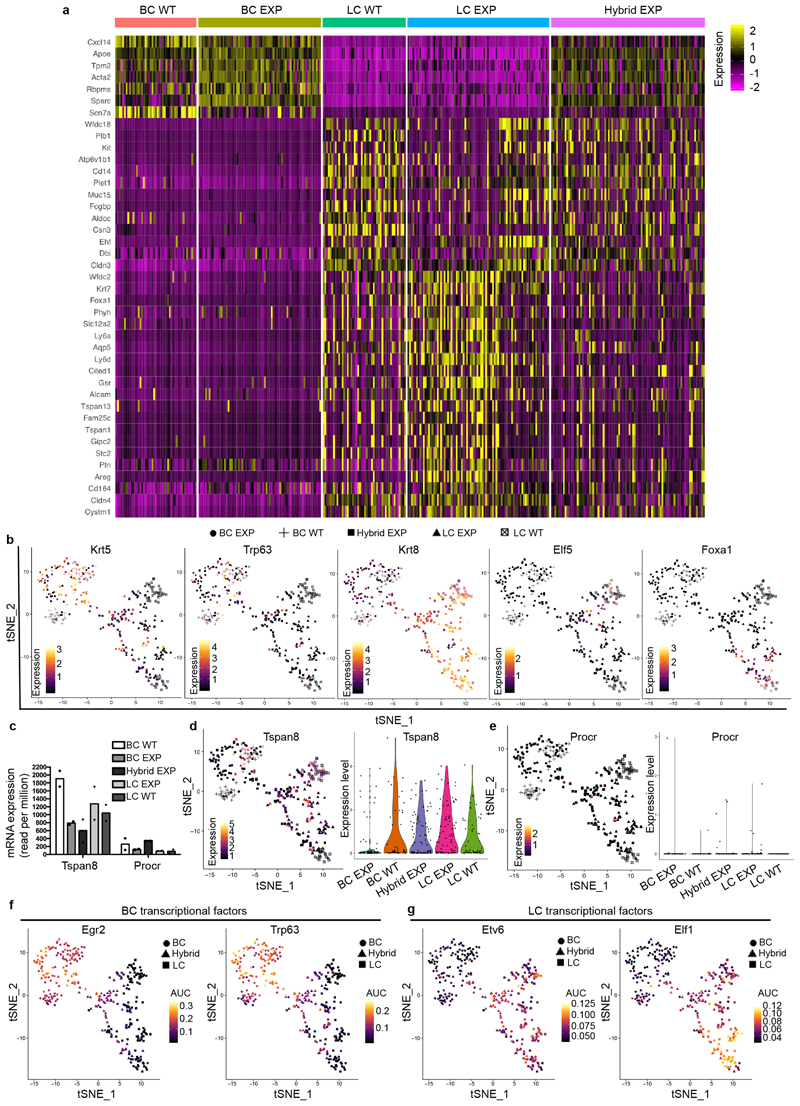
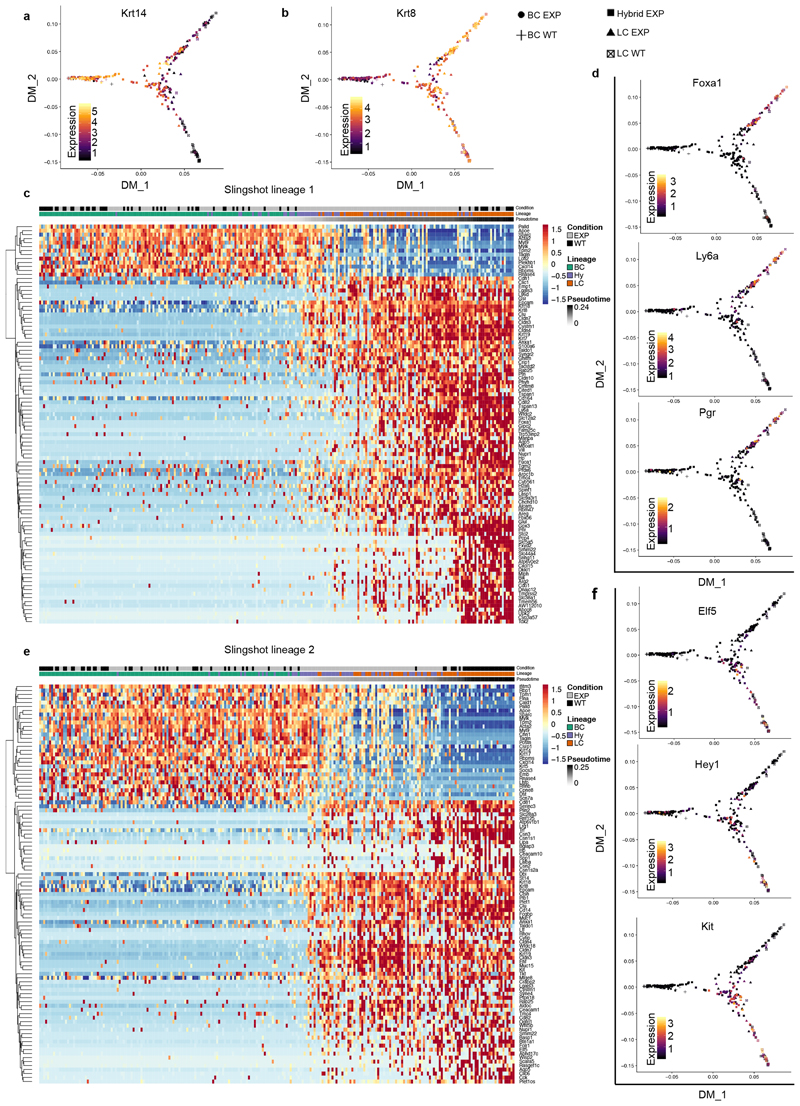
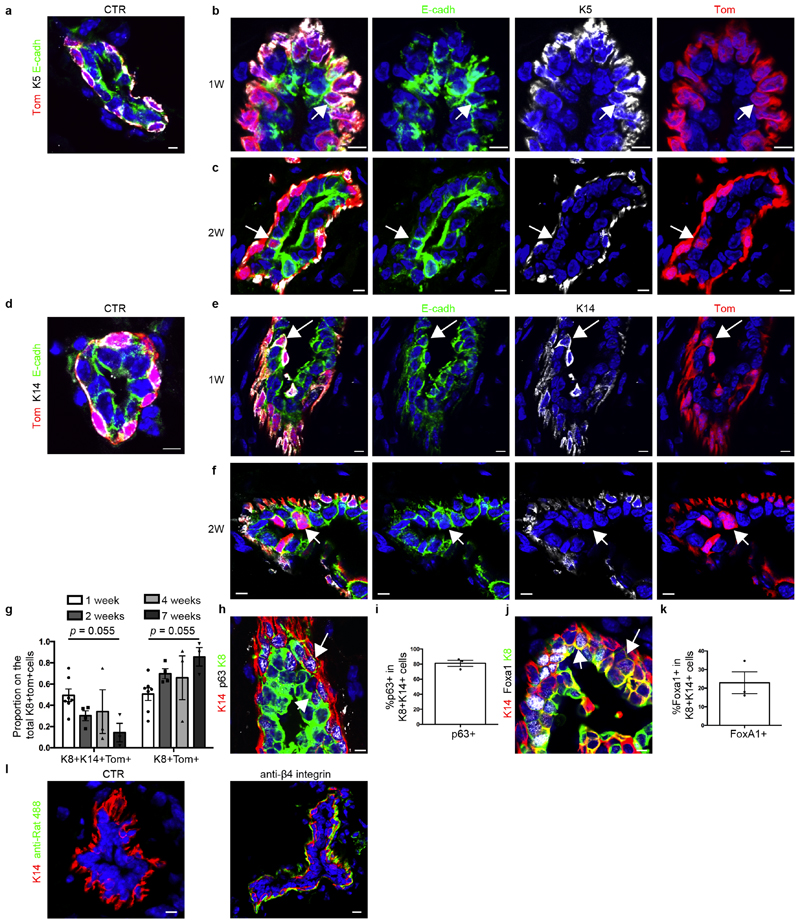
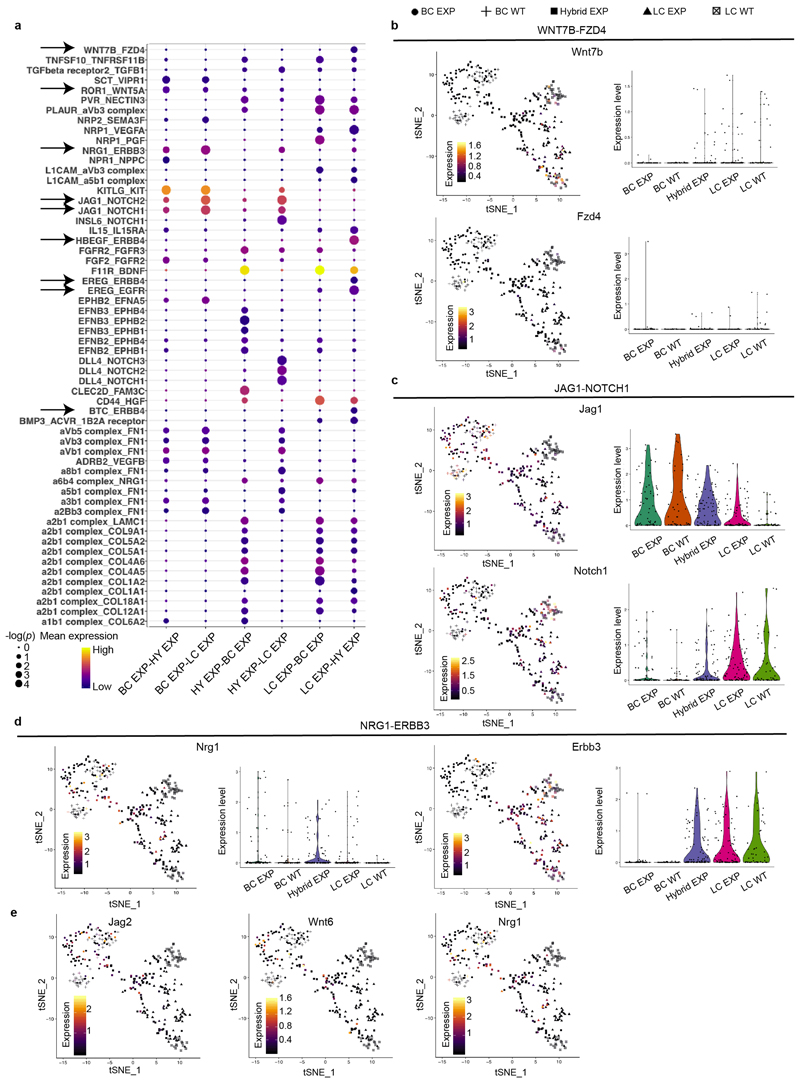
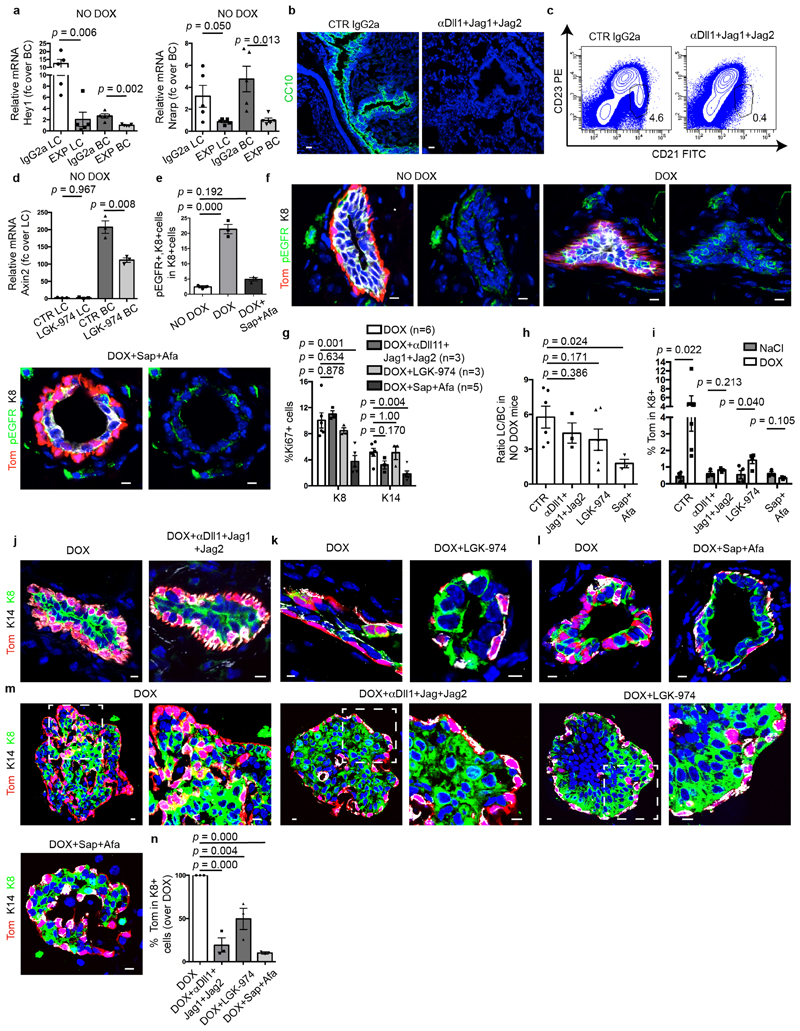
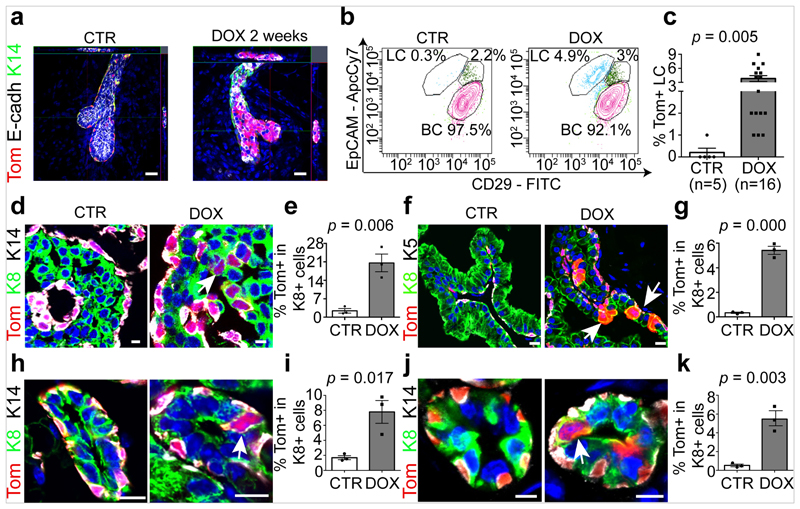
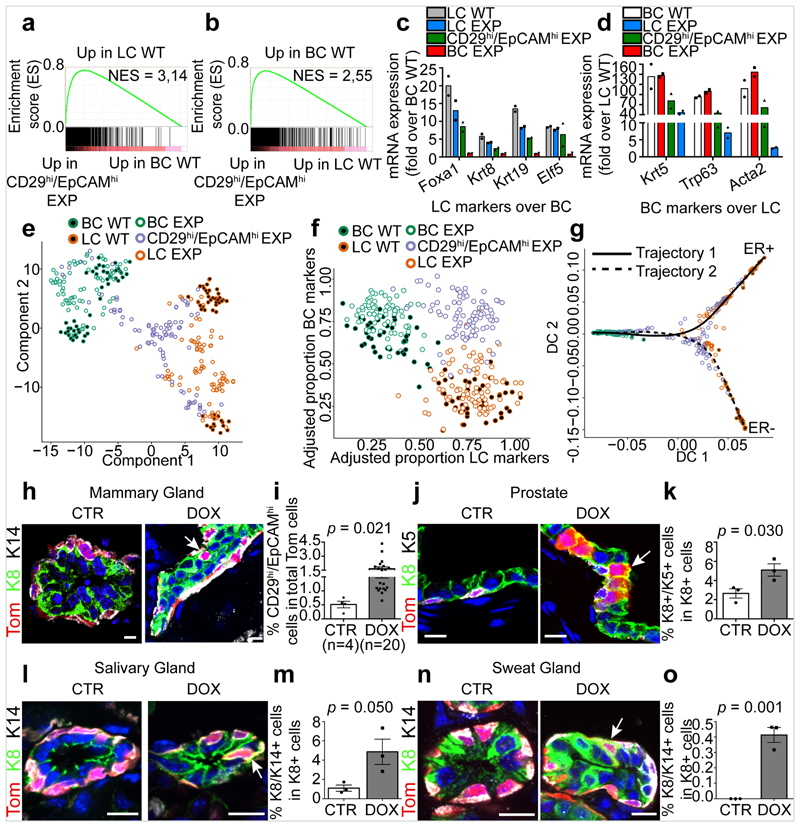
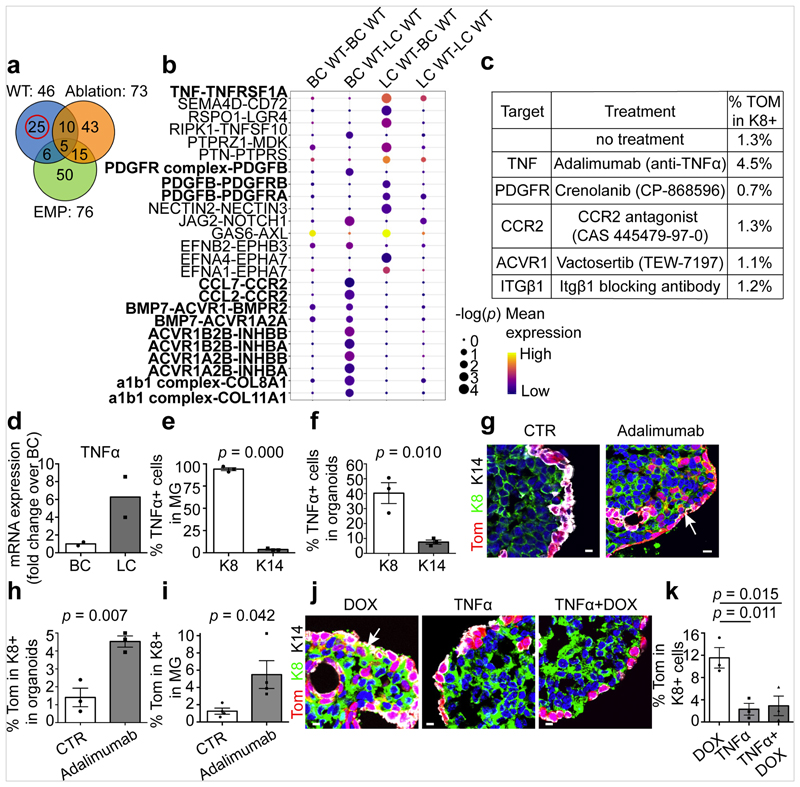
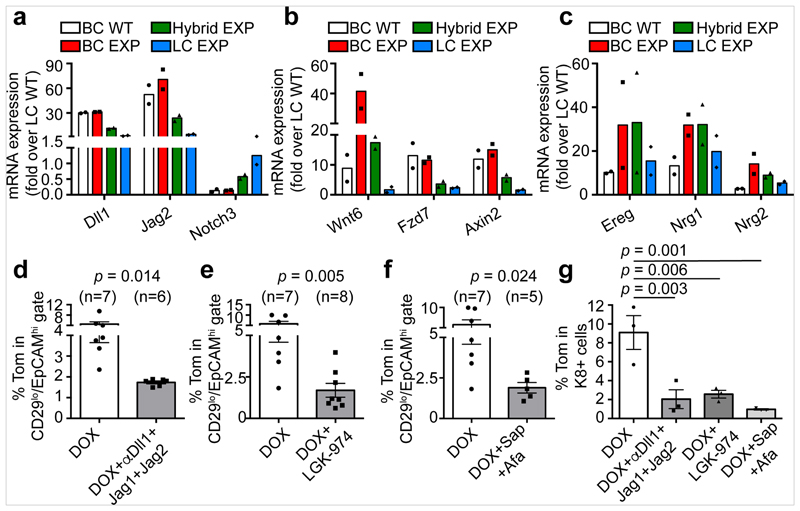
Glandular epithelia, including the mammary and prostate glands, are composed of basal cells (BCs) and luminal cells (LCs)1,2. Many glandular epithelia develop from multipotent basal stem cells (BSCs) that are replaced in adult life by distinct pools of unipotent stem cells1,3-8. However, adult unipotent BSCs can reactivate multipotency under regenerative conditions and upon oncogene expression3,9-13. This suggests that an active mechanism restricts BSC multipotency under normal physiological conditions, although the nature of this mechanism is unknown. Here we show that the ablation of LCs reactivates the multipotency of BSCs from multiple epithelia both in vivo in mice and in vitro in organoids. Bulk and single-cell RNA sequencing revealed that, after LC ablation, BSCs activate a hybrid basal and luminal cell differentiation program before giving rise to LCs-reminiscent of the genetic program that regulates multipotency during embryonic development7. By predicting ligand-receptor pairs from single-cell data14, we find that TNF-which is secreted by LCs-restricts BC multipotency under normal physiological conditions. By contrast, the Notch, Wnt and EGFR pathways were activated in BSCs and their progeny after LC ablation; blocking these pathways, or stimulating the TNF pathway, inhibited regeneration-induced BC multipotency. Our study demonstrates that heterotypic communication between LCs and BCs is essential to maintain lineage fidelity in glandular epithelial stem cells.


Conflict of interest statement

Competing interestsThe authors declare no competing interests.

Figures

Extended Data Fig. 1
Extended Data Fig. 1. FACS analysis of MG epithelial cells
ad, Unicellular suspension of MG cells from adult K5CreER/tdTomato/K8rtTA/TetO-DTA mice induced at 8 weeks stained for endothelial, immune and fibroblast markers (Lin+) (CD31, CD45, CD140a) in APC, EpCAM in Apc-Cy7 and CD29 in FITC, were gated to eliminate debris (a), doublets were discarded with gates (b), the living cells were gated by DAPI dye exclusion (c) and the non-epithelial Lin+ cells were discarded (d). CD24/CD29 and EpCAM/CD29 expression was studied in Lin. eg, CD24/CD29 gates, EpCAM/CD29 gates and the absence of leakiness of fluorescent reporter recombination before tamoxifen injection (e), after tamoxifen injection (f) and after DOX injection (g). The CD29low CD24high and the CD29low EpCAMhigh gate corresponds to LCs, the CD29high CD24low and the CD29high EpCAMlow gate corresponds to BCs, the CD29high EpCAMhigh correspond to the new population described in this manuscript. A total of 400,000 events is shown in the graphs. Percentages are calculated on the total LCs and BCs or LCs, CD29high EpCAMhigh and BCs shown. n = 3 independent experiments per condition. h, Graph showing the percentage of BCs that were tdTomato-labelled on the total number of BCs gated on CD24/CD29 before DOX injection (79.5 ± 2.2%; n = 20 mice, data are mean ± s.e.m.) after DOX injection (CD24 83.9 ± 2.6%; n = 23 mice, data are mean ± s.e.m.) and EpCAM/CD29 before DOX injection (84.8 ± 2.2%; n = 20 mice, data are mean ± s.e.m.) and after DOX injection (88.9 ± 1.9%; n = 23 mice, data are mean ± s.e.m.). P values are derived from unpaired two-sided t-tests.
Extended Data Fig. 2
Extended Data Fig. 2. DOX administration to K5CreER/tdTomato/K8rtTA/TetO-DTA mice promotes LC death, MG remodelling and proliferation
a, Scheme summarizing the histology of the MG and its different lineages. b, c, FACS plot of CD29/CD24 expression in LintdTomato+ epithelial cells (b) and quantification of tdTomato+ LC (c) in CTR mice and 1 week after DOX administration. The percentage of the gated population from all epithelial cells is shown. Number of mice analysed is shown in parentheses. P values are derived from unpaired two-sided t-test. d, e, Confocal imaging (d) and FACS quantification (e) of immunostaining for tdTomato, cleaved caspase 3 (CC3) and K8 in K5CreER/tdTomato/K8rtTA/TetO-DTA MG after IDI with NaCl (0.29 ± 0.02 CC3+ cells) or 0.2 mg DOX (1.3 ± 0.4 CC3+ cells) and chased for 12 h (n = 6 mice per condition). Scale bar (d), 5 μm. P values are derived from unpaired two-sided t-tests. fj, Scheme of the different parameters measured to quantify MG remodelling (f), quantification and representation after ImageJ analysis of branch length, number of branches, branch points and terminal end buds of K5CreER/Rosa-tdTomato/K8rtTA/tet-O-DTA (g, h) or K5CreER/Rosa-tdTomato/K8rtTA contralateral MG (i, j) injected either with NaCl or DOX. Number of mice analysed is shown in parentheses. Scale bars, 100 μm. P values are derived from paired two-sided t-tests. k, Confocal imaging of immunostaining for tdTomato, E-cadherin and K14 of terminal end buds, branching points and ducts where LC replacement is occurring in a patchy and focal manner throughout the gland (n = 3 mice). Scale bars, 20 μm. l, m, Graphs showing the percentage of K8+ CC3+ cells at 0 h, 12 h and 24 h (n = 3 mice per condition) after DOX injection (l) and FACS quantification of K8+ CC3+ cells 12 h after different DOX doses (m). Number of mice analysed is shown in parentheses. n, o, Confocal imaging of immunostaining for tdTomato, K8 and CC3 (n) and FACS quantification of K8+tdTomato+ cells (o) in mice after intraductal injection with NaCl or DOX at different doses after 12 h. Number of mice analysed is shown in parentheses. p, q, Confocal imaging (p) and quantification (q) of immunostaining for tdTomato, Ki67 and K8 in K5CreER/tdTomato/K8rtTA/TetO-DTA MG after IDI with NaCl or 0.2 mg DOX and chased for 1 week. Scale bars, 5 μm. n = 3 mice per condition. P values are derived from unpaired two-sided t-tests. Data are mean ± s.e.m. For the immunofluorescence data, Hoechst nuclear staining is shown in blue.
Extended Data Fig. 3
Extended Data Fig. 3. DOX-induced DTA in LCs promotes inflammation, LC death, proliferation and activation of BC multipotency in MG in vivo and organoids in vitro
a, b, Confocal imaging of immunostaining for tdTomato, CD68 and CD45 (a) and FACS quantification of CD45+ CD68+ cells in MG cells from K5CreER/Rosa-tdTomato/K8rtTA/tet-O-DTA CTR mice or DOX or DOX+DEX treated (DEX, dexamethasone) (b). n = 3 mice. P values are derived from unpaired two-sided t-tests. c, qRT–PCR analysis of the whole MG of K5CreER/Rosa-tdTomato/K8rtTA/tet-O-DTA mice CTR, DOX, No DOX+DEX or DOX+DEX (n = 3 mice for each group), showing the upregulation of inflammation markers upon LC ablation and its normalization after DEX treatment. d, FACS quantification of tdTomato+ LCs in mice after DOX or DOX+DEX treatment (n = 5 mice). P values are derived from unpaired two-sided t-tests. e, f, Representative FACS plot of CD29/EpCAM expression in Lin YFP+ epithelial cells of MG from K14rtTA/TetO-DTA/K8CreER/Rosa-YFP mice in CTR or one week after IDI of NaCl or DOX (e) and quantification of YFP+ cells in LCs and BCs (f) (n = 5 mice). g, h, Confocal imaging (g) and quantification of immunostaining (h) for tdTomato, CC3 and K8 in K5CreER/tdTomato/K8rtTA/TetO-DTA MG organoids without DOX (CTR) or 6 h after DOX. n = 4 independent experiments. P values are derived from unpaired two-sided t-tests. i, j, Confocal imaging and quantification of immunostaining for tdTomato, Ki67 and K8 in K5CreER/tdTomato/K8rtTA/TetO-DTA in organoids without DOX (CTR) or 24 h after DOX. n = 4 independent experiments. P values are derived from unpaired two-sided t-tests. k, Confocal imaging of immunostaining for tdTomato, K8 and K14 in K5CreER/tdTomato/K8rtTA/TetO-DTA CTR organoids or after DOX. Lower magnification of the images shown in Fig. 1d. n = 3 independent experiments. l, m, Confocal imaging (l) and quantification (m) of immunostaining for tdTomato, Ki67 and K8 in K5CreER/tdTomato/K8rtTA/TetO-DTA organoids treated with DOX, DOX+adeno-P21 or DOX+CDK1 inhibitor (CDK1-i) for 48 h and chased for 24 h. n, Quantification of tdTomato+ K8+ cells in K5CreER/tdTomato/K8rtTA/TetO-DTA organoids treated with DOX, DOX+adeno-P21 or DOX+CDK1 inhibitor. For ln, n = 3 independent experiments. P values are derived from ANOVA followed by two-sided Dunnett’s tests. Data are mean ± s.e.m. For the immunofluorescence data, Hoechst nuclear staining is shown in blue. Scale bars, 10 μm.
Extended Data Fig. 4
Extended Data Fig. 4. DOX administration in adult K5CreER/tdTomato/K8rtTA/TetO-DTA mice promotes LC death and proliferation in the prostate, salivary gland and sweat gland
a, Schematic representation of the histology of the salivary gland and its lineages. b, c, Confocal imaging (b) and quantification (c) of immunostaining for tdTomato, AQP5 and smooth muscle heavy chain myosin (SMH) of salivary gland acinar cells. n = 3 mice per condition. P values are derived from unpaired two-sided t-tests. d, e, Confocal imaging (d) and quantification (e) of immunostaining for tdTomato, K8 and SMH in the granulated duct showing the contribution of BCs to replenishing granulated ductal cells during homeostasis. n = 3 mice per condition. P values are derived from unpaired two-sided t-tests. f, Schematic representation of the histology of prostate and its lineages. gj, Confocal imaging (g) and quantification (h) of prostate immunostaining for tdTomato, K8 and CC3 or Ki67 in CTR or K5CreER/tdTomato/K8rtTA/TetO-DTA mice treated with DOX for 5 days and chased for 1 day. P values are derived from unpaired two-sided t-tests. n = 3 mice per condition. k, Schematic representation of the histology of the sweat gland and its different lineages. lo, Confocal imaging (l, n) and quantification (m, o) of sweat gland immunostaining for tdTomato, K8 and CC3 (l, m) or tdTomato, K8 and Ki67 (n, o) in CTR or K5CreER/tdTomato/K8rtTA/TetO-DTA mice treated with DOX for 5 days and chased for 1 day. P values are derived from unpaired two-sided t-tests. n = 3 mice per condition. ps, Confocal imaging (p, r) and quantification (q, s) of the intercalated duct of salivary gland immunostaining for tdTomato, K8 and CC3 (p, q) or tdTomato, K8 and Ki67 (r, s) in CTR or K5CreER/tdTomato/K8rtTA/TetO-DTA mice treated with DOX for 5 days and chased for 1 day. n = 4 for CC3 and n = 3 for Ki67 mice per condition. P values are derived from unpaired two-sided t-tests. Data are mean ± s.e.m. For the immunofluorescence data, Hoechst nuclear staining is shown in blue. Scale bars, 5 μm.
Extended Data Fig. 5
Extended Data Fig. 5. Transcriptional profiling associated with BC multipotency induced by LC ablation
a, b, Gene ontology (GO) analysis of genes upregulated more than 2.5-fold in CD29high EpCAMhigh cells compared to LCs (a) or BCs (b). Histograms represent –log10 of the Benjamini P value. n = 2 independent experiments. c, d, Graphs representing mRNA expression measured by bulk population RNA sequencing of basal (c) and luminal (d) upregulated genes in FACS-isolated wild-type BCs, LC EXP, BC EXP, CD29high EpCAMhigh EXP. Fold change over wild-type LCs (c) or over wild-type BCs (d) of genes involved in different biological processes. n = 2 independent experiments. e, Confocal images of MGs from CTR mice or mice with IDI DOX.Immunostaining for K14, Snail2 and K8. f, Immunohistochemistry of Il33 in CTR MGs or MG after DOX IDI. g, Immunostaining for tdTomato, TnC and K14. h, Masson’s trichrome staining for collagen in CTR MGs or MG after DOX IDI. i, Immunostaining for tdTomato, Alcam and K14. n = 3 mice per condition. Hoechst nuclear staining in blue. Scale bars, 5 μm.
Extended Data Fig. 6
Extended Data Fig. 6. Single-cell transcriptional profiling reveals the hybrid features of CD29high EpCAMhigh cells associated with LC-ablation-induced BC multipotency
a Heat map of normalized scRNa-seq expression. Rows represent marker genes (ROC AUC >0.7 and log fold change >0.25) for clusters discovered through unsupervised clustering (resolution = 0.2) and columns represent individual cells, grouped by lineage and treatment condition. Colour values in the heat map represent normalized and scaled expression values. These data show the hybrid basal and luminal signature of the CD29high EpCAMhigh cells (Hybrid EXP) after LC ablation. b, t-SNE plots illustrating the expression of markers for BC and LC lineages (n = 337 cells). c, Graph showing the mRNA expression (read per million) of Tspan8 and Procr. n = 2 independent experiments. d, t-SNE and violin plots illustrating the expression for Tspan8. These data show that Tspan8 is expressed at similar levels in the different MG populations under physiological conditions and after LC ablation (n = 337 cells). e, t-SNE and violin plots illustrating the expression for Procr. These data show that Procr is expressed at very low levels in the different MG populations under physiological conditions and is not increased after LC ablation (n = 337 cells). For t-SNE plots, data points represent individual cells, the colour scaling represents the expression level of the respective marker gene (high, yellow; low, black). For violin plots the minima, maxima, centre and percentiles are provided in the Source Data. f, g, t-SNE plots for differentially activated regulons (FDR-corrected P value <0.01 from one-sided Kolmogorov–Smirnov test) as computed by SCENIC, data points represent individual cells (n = 337), the colour scaling represents the regulon AUC value as a measure of the number of transcription factor target genes being expressed (high yellow, low black).
Extended Data Fig. 7
Extended Data Fig. 7. Lineage trajectory inference using Slingshot
a, b, Diffusion maps showing normalized expression of Krt14 (a, BC) and Krt8 (b, LC). c, Heat map representing the top 100 most significant (lowest adjusted P value) genes differentially expressed along trajectory 1 (n = 337 cells). FDR-corrected P values from F-test on Loess-term for pseudotime in the GAM fit. d, Diffusion maps showing normalized expression of markers for ER+ LC (Foxa1, Ly6a/Sca1 and Pgr). e, Heat map representing the top 100 most significant (lowest adjusted P value) genes differentially expressed along trajectory 2 (n = 337 cells). FDR-corrected P values from F-test on Loess-term for pseudotime in the GAM fit. f, Diffusion maps showing normalized expression of markers for ER- LC (Elf5, Hey1 and Kit). For the diffusion maps the colour bars represent normalized expression levels, going from black (low expression) to yellow (high expression). For the heat maps rows represent the genes, ordered by hierarchical clustering. Colours correspond to the Z-score scaled expression of a gene. Columns represent cells, which are ordered by their pseudotime value in the respective trajectory and their types (BC, hybrid or LC) in control or experimental condition (wild-type or EXP) are indicated at the top of the heat map.
Extended Data Fig. 8
Extended Data Fig. 8. Immunostaining of basal and luminal markers after LC ablation and antibody permeability
af, Confocal imaging of immunostaining for E-cadherin, K5 and tdTomato (ac) or E-cadherin, K14 and tdTomato (df) in CTR (a, d) or K5CreER/tdTomato/K8rtTA/TetO-DTA mice after IDI of DOX and chased for 1 week (b, e) or 2 weeks (c, f) (n = 3 mice per condition). g, Quantification of the proportion of hybrid K8+ K14+tdTomato+ cells and K8+tdTomato+ cells on the total K8+tdTomato+ cells at 1 week (n = 7 mice), 2 weeks (n = 4 mice), 4 weeks (n = 3 mice) and 7 weeks (n = 3 mice) after DOX treatment. The P value between 1 week and 7 weeks, derived from ANOVA followed by two-sided Dunnett’s test, is shown. h, i, Confocal imaging of immunostaining for K14, p63 and K8 (h) and quantification of p63+ cells in K8+ K14+ cells (i) in CTR or K5CreER/tdTomato/K8rtTA/TetO-DTA mice after DOX IDI and chased for 1 week. n = 3 mice per condition. j, k, Confocal imaging of immunostaining for K14, Foxa1 and K8 (j) and quantification of Foxa1+ cells in K8+ K14+ cells (k) in CTR or K5CreER/tdTomato/K8rtTA/TetO-DTA mice after DOX IDI and chased for 1 week. n = 3 mice per condition. l, Confocal imaging of immunostaining for K14 and anti-rat Alexa Fluor 488 (green) in CTR MG not injected or MG after IDI of rat anti-β4 integrin (CD104) and chased for 2 days. n = 3 mice per condition. Data are mean ± s.e.m. For the immunofluorescence data, Hoechst nuclear staining is shown in blue. Scale bars, 5 μm.
Extended Data Fig. 9
Extended Data Fig. 9. CellPhone-DB and scRNA-seq on the heterotypic interaction significant upon LC ablation
a, Graph representing the mean expression and P values of the heterotypic ligand–receptor interaction significant only after LC ablation compared to the wild type condition (n = 242 cells). P values are derived from a one-sided permutation test. bd, t-SNE and violin plots illustrating the expression for the ligand–receptor couples WNT7B–FZD4 (b), JAG1–NOTCH1 (c) and NRG1–ERBB3 (d) in the different cell populations and experimental conditions (n = 337 cells). For violin plots the minima, maxima, centre and percentiles are provided in Source Data. e, t-SNE plots illustrating the expression of Jag2, Wnt6 and Nrg1 (n = 337 cells). Data points represent individual cells. The colour scaling represents the expression level of the respective marker gene (high, yellow; low, black).
Extended Data Fig. 10
Extended Data Fig. 10. Effect of administration of anti Dll1, Jag1 and Jag2 blocking antibodies; LGK-974; sapitinib and afatinib on MG and MG organoids
a, qRT–PCR analysis of Notch target gene Hey1 and Nrarp of FACS-isolated LCs and BCs of K5CreER/tdTomato/K8rtTA/TetO-DTA mice treated with IgG2a (CTR Ab) or anti-Dll1, Jag1, Jag2 blocking antibodies (n = 5 mice per condition), showing the efficient inhibition of Notch target genes after blocking antibody administration. P values are derived from unpaired two-sided t-tests. b, Immunostaining for CC10 in lung sections of K5CreER/tdTomato/K8rtTA/TetO-DTA mice treated with CTR IgG2a or anti-Dll1, Jag1 and Jag2 blocking antibodies, showing the disappearance of the goblet cells demonstrating the efficiency of Notch inhibition (n = 3 mice per condition). c, Representative FACS plot of CD21/CD23 in CD45+ CD5 spleen cells in mice treated with CTR IgG2a or anti-Dll1, Jag1 and Jag2 blocking antibodies showing the disappearance of the marginal zone B cells (CD21high CD23) demonstrating the efficiency of Notch inhibition (n = 3 mice per condition). d, qRT–PCR analysis of Wnt target gene Axin2 of FACS-isolated LCs and BCs of K5CreER/tdTomato/K8rtTA/TetO-DTA CTR mice or treated with LGK-974, showing the efficient inhibition of Wnt target genes by LGK-974 (n = 3 mice per condition). P values are derived from unpaired two-sided t-tests. e, f, Confocal imaging (e) and quantification (f) of immunostaining for tdTomato, phospho-EGFR (p-EGFR) and K8 in CTR and K5CreER/tdTomato/K8rtTA/TetO-DTA MG after DOX IDI and chased for 1 week and mice after DOX IDI and treated with sapitinib (Sap) and afatinib (Afa) and chased for 1 week (n = 3 mice per condition). P values are derived from ANOVA followed by two-sided Dunnett’s tests. g, Quantification of the expression of Ki67 in MG after IDI of DOX in the absence or in the presence of different inhibitors. The number of independent mice analysed is shown in parentheses. P values are derived from ANOVA followed by two-sided Dunnett’s test. h, FACS analysis of the LC/BC ratio of MG in control mice (n = 6 mice); mice treated with anti-Notch ligand antibodies (n = 3 mice); with LGK-974 (n = 4 mice) and anti-ErbB inhibitors (n = 3 mice) for 9 days showing that the inhibition of Notch or Wnt signalling does not affect the ratio between LCs and BCs whereas Erbb inhibitors decreased the proportion of LCs. P values are derived from ANOVA followed by two-sided Dunnett’s test. i, FACS analysis of MG showing tdTomato+ cells in LCs after NaCl IDI (n = 4 mice); DOX IDI (n = 5 mice); NaCl or DOX IDI and anti-Notch ligand antibodies (n = 3 mice); NaCl or DOX IDI and Wnt inhibitor (n = 4 mice); NaCl or DOX IDI and anti-ErbB inhibitors (n = 3 mice); for 9 days. P values are derived from unpaired two-sided t-tests. jm, Confocal imaging of immunostaining for tdTomato, K8 and K14 of MG (jl) and organoids (m) after DOX or DOX+anti-Notch ligand antibodies (j); DOX+Wnt inhibitor (k); DOX+sapitinib/afatinib (l). n, Quantification of the expression of tdTomato in K8+ cells in MG organoids treated with DOX, DOX+anti-Notch ligand antibodies, DOX+LGK-974 or DOX+sapitinib/afatinib for 48 h and chased for 10 days with media and the corresponding inhibitor. Data are normalized over DOX. For m, n, n = 3 independent experiments. Data are mean ± s.e.m. P values are derived from ANOVA followed by two-sided Dunnett’s test. Data are mean ± s.e.m. For the immunofluorescence data, Hoechst nuclear staining is shown in blue. Scale bars, 5 μm.
Fig. 1
Fig. 1. LC ablation promotes BC multipotency in glandular epithelia
a, Whole-mount confocal imaging of immunostaining for tdTomato (Tom), K14 and E-cadherin (E-cadh) in the mammary glands of K5CreER/tdTomato/K8rtTA/TetO-DTA mice after IDI with NaCl (Control, n = 3 independent experiments) or 0.2 mg DOX (n = 3 independent experiments) and chasing for two weeks. Scale bars, 20 μm. b, Representative FACS plot of CD29 and EpCAM expression in LintdTomato+ epithelial cells from control mice (n = 5) and from mice 1 week after DOX administration (n = 16). The percentage of the gated population out of all epithelial cells is shown. c, Quantification of tdTomato expression in CD29low EpCAMhigh LCs from control (n = 5) and DOX-treated (n = 16) mice. The bar height and error bars are mean ±s.e.m., with individual data points shown. P values are derived from unpaired two-sided t-tests. dk, Confocal imaging of immunostaining for tdTomato, K8 and K14 or tdTomato, K8 and K5 in the MG organoid (d), prostate (f), salivary gland (h) and sweat gland (j) tissues and the respective quantification of tdTomato+ cells in K8+ LCs (e, g, i, k) in K5CreER/tdTomato/K8rtTA/TetO-DTA organoids (d, e) or in mice (fk) treated with DOX and analysed 72 h later for organoids and 1 week later for in vivo mouse experiments. Scale bars, 10 μm (organoid); 5 μm (mouse tissues). Hoechst nuclear staining is shown in blue in immunofluorescence images. n = 3 independent experiments. In e, g, i, k, the bar height and error bars are mean ±s.e.m., with individual data points shown. P values are derived from unpaired two-sided t-test.
Fig. 2
Fig. 2. BSC multipotency is associated with a hybrid basal and luminal signature
a, b, GSEA of the upregulated genes in LCs (a, compared with BCs) or in BCs (b, compared with LCs). Normalized enrichment scores (NES) are indicated. The designations ‘up in LCs’ and ‘up in BCs’ are derived from the RNA-seq analysis of FACS-isolated wild-type (WT) BCs and LCs (>2.5-fold). c, d, Relative mRNA expression of luminal (c, fold over wild-type BCs) and basal (d, fold over wild-type LCs) genes measured by RNA-seq in FACS-isolated wild-type LCs, LCs under experimental conditions (EXP LCs), CD29high EpCAMhigh EXP, EXP BCs and wild-type BCs. Mean of 2 independent experiments. e, Dimensionality reduction using t-SNE of scRNA-seq data of FACS-isolated wild-type BCs, wild-type LCs, EXP BCs, CD29high EpCAMhigh EXP and EXP LCs. f, Adjusted proportion of LC and BC marker genes detected in each cell of the different cell populations. g, Diffusion map of scRNA-seq data showing the lineage trajectories, obtained using Slingshot analysis. For scRNA-seq data, each circle (n = 337) represents one cell. h, Confocal imaging of the MG after immunostaining for tdTomato, K8 and K14 in K5CreER/tdTomato/K8rtTA/TetO-DTA mice, 1 week after IDI with NaCl or DOX. n = 3 mice per condition. i, FACS quantification of tdTomato in CD29high EpCAMhigh hybrid population. Control, n = 4 mice; DOX treatment, n = 20 mice. The bar height and error bars are mean ±s.e.m., with individual data points shown. P values are derived from unpaired two-sided t-tests. jo, Confocal imaging of prostate (j), salivary gland (l) and sweat gland (n) after immunostaining for tdTomato, K8 and K5 or tdTomato, K8 and K14 from K5CreER/tdTomato/K8rtTA/TetO-DTA mice treated with DOX for 5 days and chased for 1 week, and quantification of the K8+ K5+ (k) or K8+ K14+ (m, o) hybrid cells in the immunostaining of prostate (k), salivary gland (m) and sweat gland (o). n = 3 mice per condition. The bar height and error bars are mean ±s.e.m., with individual data points shown. P values are derived from unpaired two-sided t-test. Hoechst nuclear staining is shown in blue. Scale bars, 5 μm.
Fig. 3
Fig. 3. TNF expression by LCs restricts BC multipotency under homeostatic conditions
a, Venn diagram representing the interaction between the significant ligand–receptor pairs identified by CellPhone-DB analysis on scRNa-seq data from wild-type, ablation and embryonic mammary progenitors (EMP) (n = 95 cells). b, The mean expression and P values of the ligand–receptor interaction exclusively significant for wild-type cells (n = 25 pairs). For CellPhone-DB analysis, P values are derived from one-sided permutation tests (significant P < 0.05). c, The percentage of K8+tdTomato+ cells arising from BCs in K5CreER/tdTomato organoids treated with inhibitors of the ligand–receptor pairs tested. Mean of 2 independent experiments. df, mRNA (d) and protein (e, f) expression of TNF in MG (d, e) and MG organoids (f). Mean of 2 independent experiments normalized over wild-type BCs (d). Quantification of TNF K8+ and K14+ cells from the immunofluorescence after cytospin of MG cells (e) or organoids (f). n = 3 independent experiments. The bar height and error bars are mean ±s.e.m., with individual data points shown. P values are derived from unpaired two-sided t-tests. g, h, Confocal imaging of control or adalimumab-treated K5CreER/tdTomato organoids after immunostaining for tdTomato, K8 and K14 (g) and quantification of tdTomato+K8+ cells in these organoids (h). For adalimumab treatment, organoids were treated with adalimumab for 48 h and analysed after 72 h. The bar height and error bars are mean ±s.e.m., with individual data points shown. P values are derived from paired two-sided t-tests. n = 3 independent experiments. i, Quantification of tdTomato+K8+ cells in the MG of control K5CreER/tdTomato mice or mice analysed one week after IDI of adalimumab (n = 4 mice per condition). The bar height and error bars are mean ±s.e.m., with individual data points shown. P values are derived from unpaired two-sided t-test. j, k, Confocal imaging of immunostaining for tdTomato, K8 and K14 in K5CreER/tdTomato organoids treated with DOX, TNF and DOX+TNF for 48 h and analysed after 72 h (j) and quantification of tdTomato+ K8+ cells in these organoids (k). n = 3 independent experiments. The bar height and error bars are mean ±s.e.m., with individual data points shown. P values are derived from ANOVA followed by two-sided Dunnett’s test. Hoechst nuclear staining is shown in blue. Scale bars, 10 μm.
Fig. 4
Fig. 4. Notch, Wnt and ErbB signalling pathways regulate BSC multipotency after LC ablation
ac, mRNA expression of key genes involved in Notch (a), Wnt (b) and ErbB (c) pathways that were upregulated after LC ablation in BCs and/or hybrid cells (CD29high EpCAMhigh). Results are normalized over wild-type LC expression. Replicates from n = 2 independent experiments. df, Quantification of the expression of tdTomato in CD29low EpCAMhigh LCs in mice treated with DOX and with anti-Notch ligand antibodies (d), Wnt inhibitor (e) or anti-ErbB inhibitors (f). Afa, afatinib; sap, sapitinib. The number of mice analysed is shown in parentheses. The bar height and error bars are mean ±s.e.m., with individual data points shown. P values are derived from unpaired two-sided t-tests. g, Quantification of tdTomato+K8+ cells in MG organoids first treated with tamoxifen and then with DOX and the different inhibitors for 72 h. n = 3 independent experiments. The bar height and error bars are mean ±s.e.m., with individual data points shown. P values are derived from ANOVA followed by two-sided Dunnett’s tests.

References

    1. Lloyd-Lewis B, Harris OB, Watson CJ, Davis FM. Mammary stem cells: premise, properties, and perspectives. Trends Cell Biol. 2017;27:556–567. - PubMed
    1. Toivanen R, Shen MM. Prostate organogenesis: tissue induction, hormonal regulation and cell type specification. Development. 2017;144:1382–1398. - PMC - PubMed
    1. Van Keymeulen A, et al. Distinct stem cells contribute to mammary gland development and maintenance. Nature. 2011;479:189–193. - PubMed
    1. Choi N, Zhang B, Zhang L, Ittmann M, Xin L. Adult murine prostate basal and luminal cells are self-sustained lineages that can both serve as targets for prostate cancer initiation. Cancer Cell. 2012;21:253–265. - PMC - PubMed
    1. Ousset M, et al. Multipotent and unipotent progenitors contribute to prostate postnatal development. Nat Cell Biol. 2012;14:1131–1138. - PubMed

Publication types

MeSH terms