

Glutamate Chemical Exchange Saturation Transfer (GluCEST) Magnetic Resonance Imaging in Pre-clinical and Clinical Applications for Encephalitis
- PMID: 32848546
- PMCID: PMC7399024
- DOI: 10.3389/fnins.2020.00750
Glutamate Chemical Exchange Saturation Transfer (GluCEST) Magnetic Resonance Imaging in Pre-clinical and Clinical Applications for Encephalitis
Abstract
Background: Encephalitis is a common central nervous system inflammatory disease that seriously endangers human health owing to the lack of effective diagnostic methods, which leads to a high rate of misdiagnosis and mortality. Glutamate is implicated closely in microglial activation, and activated microglia are key players in encephalitis. Hence, using glutamate chemical exchange saturation transfer (GluCEST) imaging for the early diagnosis of encephalitis holds promise.
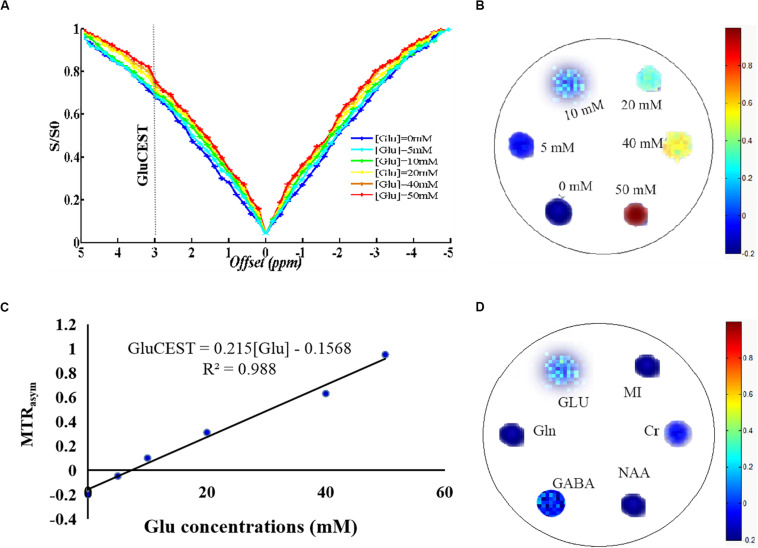
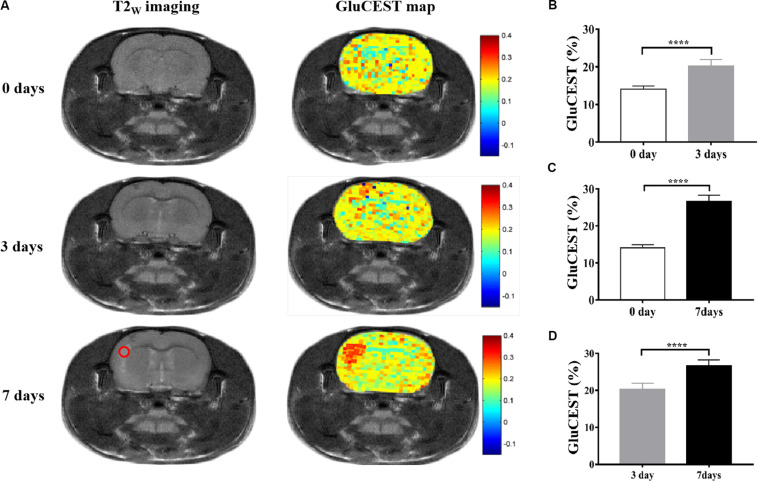
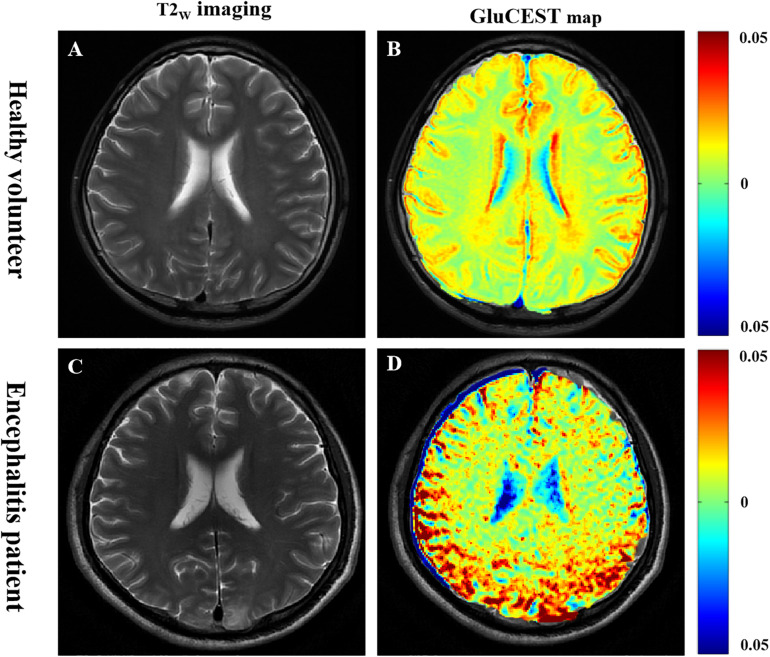
Methods: The sensitivity of GluCEST imaging with different concentrations of glutamate and other major metabolites in the brain was validated in phantoms. Twenty-seven Sprague-Dawley (SD) rats with encephalitis induced by Staphylococcus aureus infection were used for preclinical research of GluCEST imaging in a 7.0-Tesla scanner. For the clinical study, six patients with encephalitis, six patients with lacunar infarction, and six healthy volunteers underwent GluCEST imaging in a 3.0-Tesla scanner.
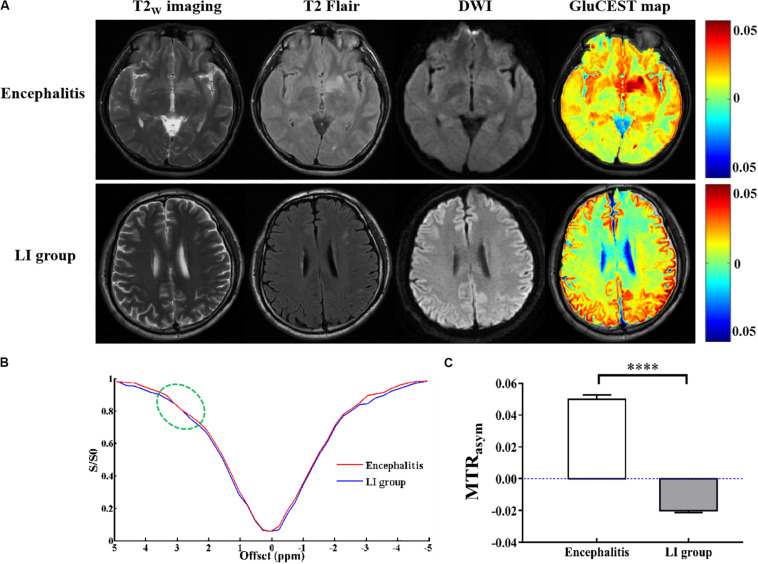
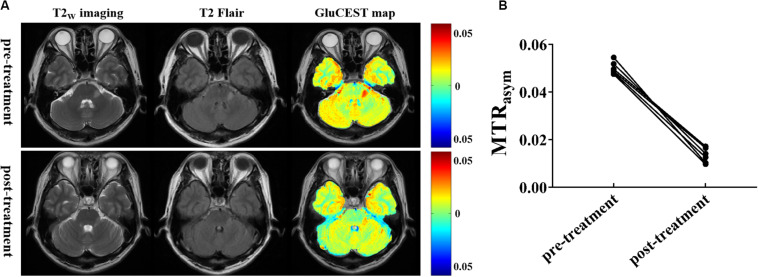
Results: The number of amine protons on glutamate that had a chemical shift of 3.0 ppm away from bulk water and the signal intensity of GluCEST were concentration-dependent. Under physiological conditions, glutamate is the main contributor to the GluCEST signal. Compared with normal tissue, in both rats and patients with encephalitis, the encephalitis areas demonstrated a hyper-intense GluCEST signal, while the lacunar infarction had a decreased GluCEST signal intensity. After intravenous immunoglobulin therapy, patients with encephalitis lesions showed a decrease in GluCEST signal, and the results were significantly different from the pre-treatment signal (1.34 ± 0.31 vs 5.0 ± 0.27%, respectively; p = 0.000).
Conclusion: Glutamate plays a role in encephalitis, and the GluCEST imaging signal has potential as an in vivo imaging biomarker for the early diagnosis of encephalitis. GluCEST will provide new insight into encephalitis and help improve the differential diagnosis of brain disorders.
Keywords: Staphylococcus aureus; chemical exchange saturation transfer; encephalitis; glutamate; magnetic resonance imaging.
Copyright © 2020 Jia, Chen, Geng, Cheng, Li, Qiu, Huang, Wang, Zhang and Wu.
Figures
Similar articles
-
Regional Mapping of Brain Glutamate Distributions Using Glutamate-Weighted Chemical Exchange Saturation Transfer Imaging.Diagnostics (Basel). 2020 Aug 8;10(8):571. doi: 10.3390/diagnostics10080571. Diagnostics (Basel). 2020. PMID: 32784483 Free PMC article.
-
Towards the molecular origin of glutamate CEST (GluCEST) imaging in rat brain.Magn Reson Med. 2020 Apr;83(4):1405-1417. doi: 10.1002/mrm.28021. Epub 2019 Nov 5. Magn Reson Med. 2020. PMID: 31691367
-
Cerebral mapping of glutamate using chemical exchange saturation transfer imaging in a rat model of stress-induced sleep disturbance at 7.0T.J Magn Reson Imaging. 2019 Dec;50(6):1866-1872. doi: 10.1002/jmri.26769. Epub 2019 Apr 29. J Magn Reson Imaging. 2019. PMID: 31033089
-
Glutamate-weighted CEST (gluCEST) imaging for mapping neurometabolism: An update on the state of the art and emerging findings from in vivo applications.NMR Biomed. 2023 Jun;36(6):e4780. doi: 10.1002/nbm.4780. Epub 2022 Jul 4. NMR Biomed. 2023. PMID: 35642353 Review.
-
Magnetization Transfer Contrast and Chemical Exchange Saturation Transfer MRI. Features and analysis of the field-dependent saturation spectrum.Neuroimage. 2018 Mar;168:222-241. doi: 10.1016/j.neuroimage.2017.04.045. Epub 2017 Apr 21. Neuroimage. 2018. PMID: 28435103 Free PMC article. Review.
Cited by
-
CEST MRI in the Management/Diagnosis of Neuroinfectious Diseases.Int J Mol Sci. 2025 Jun 12;26(12):5650. doi: 10.3390/ijms26125650. Int J Mol Sci. 2025. PMID: 40565114 Free PMC article. Review.
-
Toward quantitative CEST imaging of glutamate in the mouse brain using a multi-pool exchange model calibrated by 1H-MRS.Magn Reson Med. 2025 Mar;93(3):1394-1410. doi: 10.1002/mrm.30353. Epub 2024 Oct 24. Magn Reson Med. 2025. PMID: 39449296 Free PMC article.
-
Novel Nanoprobe with Combined Ultrasonography/Chemical Exchange Saturation Transfer Magnetic Resonance Imaging for Precise Diagnosis of Tumors.Pharmaceutics. 2023 Nov 28;15(12):2693. doi: 10.3390/pharmaceutics15122693. Pharmaceutics. 2023. PMID: 38140034 Free PMC article.
-
The Distribution of Major Brain Metabolites in Normal Adults: Short Echo Time Whole-Brain MR Spectroscopic Imaging Findings.Metabolites. 2022 Jun 14;12(6):543. doi: 10.3390/metabo12060543. Metabolites. 2022. PMID: 35736476 Free PMC article.
-
Current understanding of the human microbiome in glioma.Front Oncol. 2022 Aug 8;12:781741. doi: 10.3389/fonc.2022.781741. eCollection 2022. Front Oncol. 2022. PMID: 36003766 Free PMC article. Review.
References
-
- Burger A., Kotze M. J., Stein D. J., Janse Van Rensburg S., Howells F. M. (2019). The relationship between measurement of in vivo brain glutamate and markers of iron metabolism: a proton magnetic resonance spectroscopy study in healthy adults. Eur. J. Neurosci. 51 984–990. 10.1111/ejn.14583 - DOI - PubMed
LinkOut - more resources
Full Text Sources