. 2020 Aug 4:14:216.
doi: 10.3389/fncel.2020.00216. eCollection 2020.

Substantia Nigra Hyperechogenicity Reflects the Progression of Dopaminergic Neurodegeneration in 6-OHDA Rat Model of Parkinson's Disease

Affiliations

Substantia Nigra Hyperechogenicity Reflects the Progression of Dopaminergic Neurodegeneration in 6-OHDA Rat Model of Parkinson's Disease

Siyan Zhang et al. Front Cell Neurosci. .

Abstract

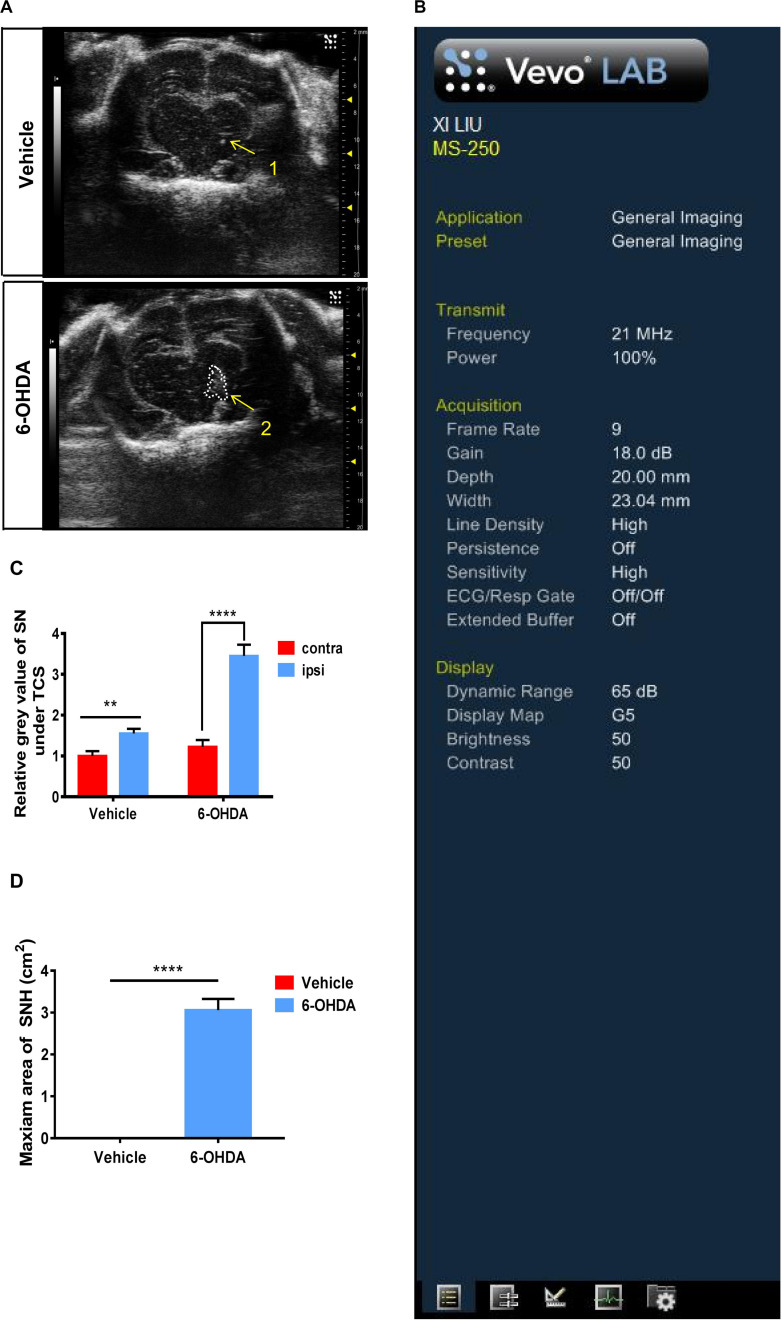
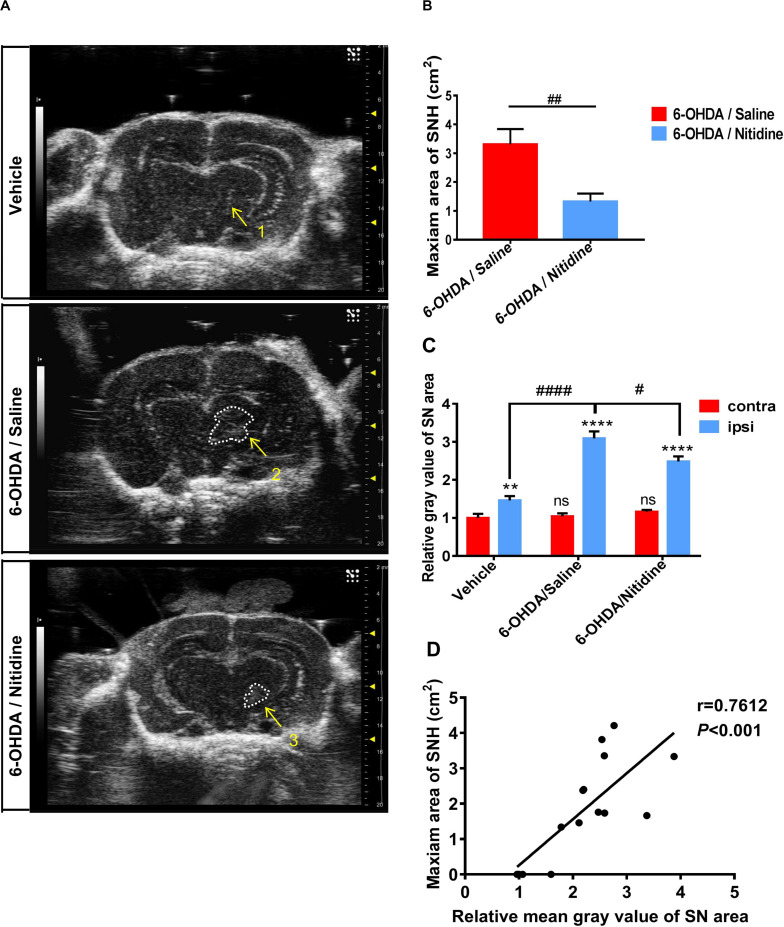
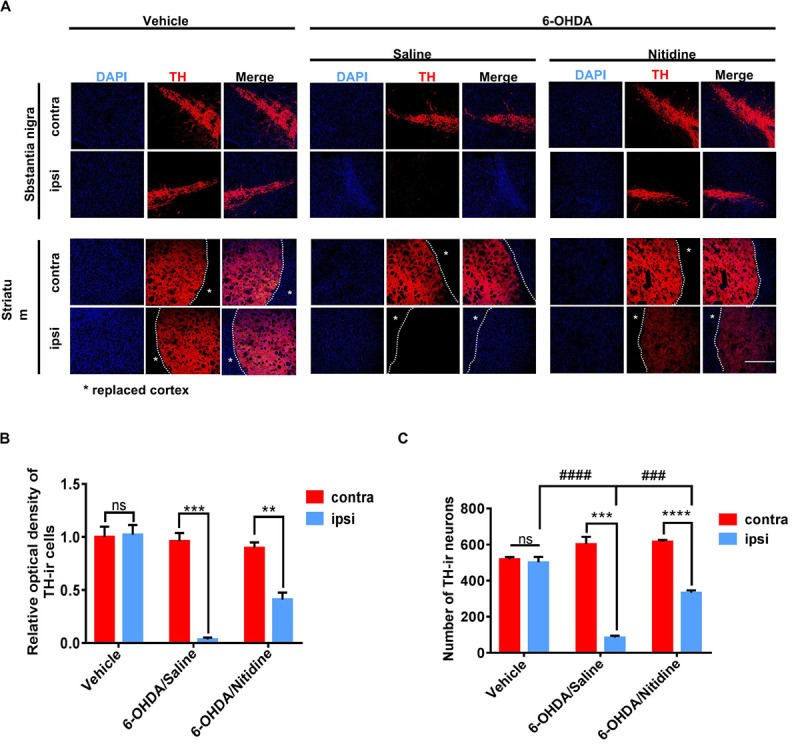
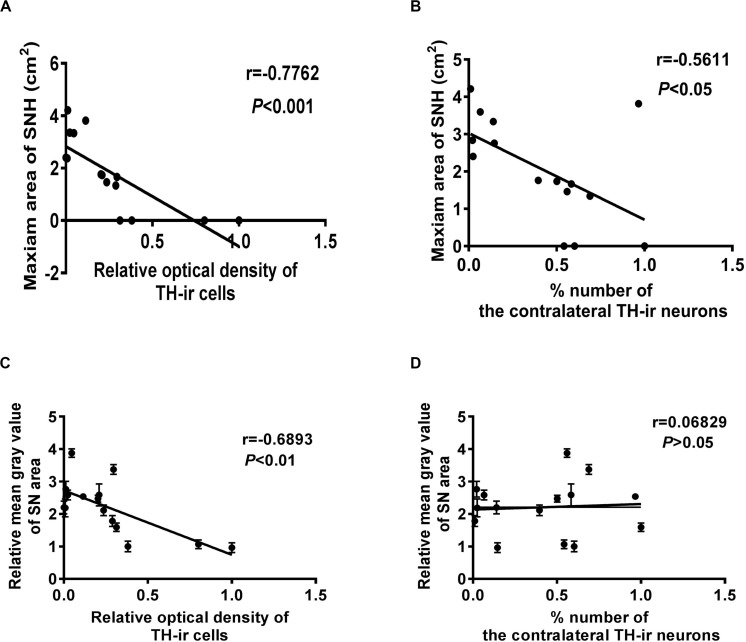
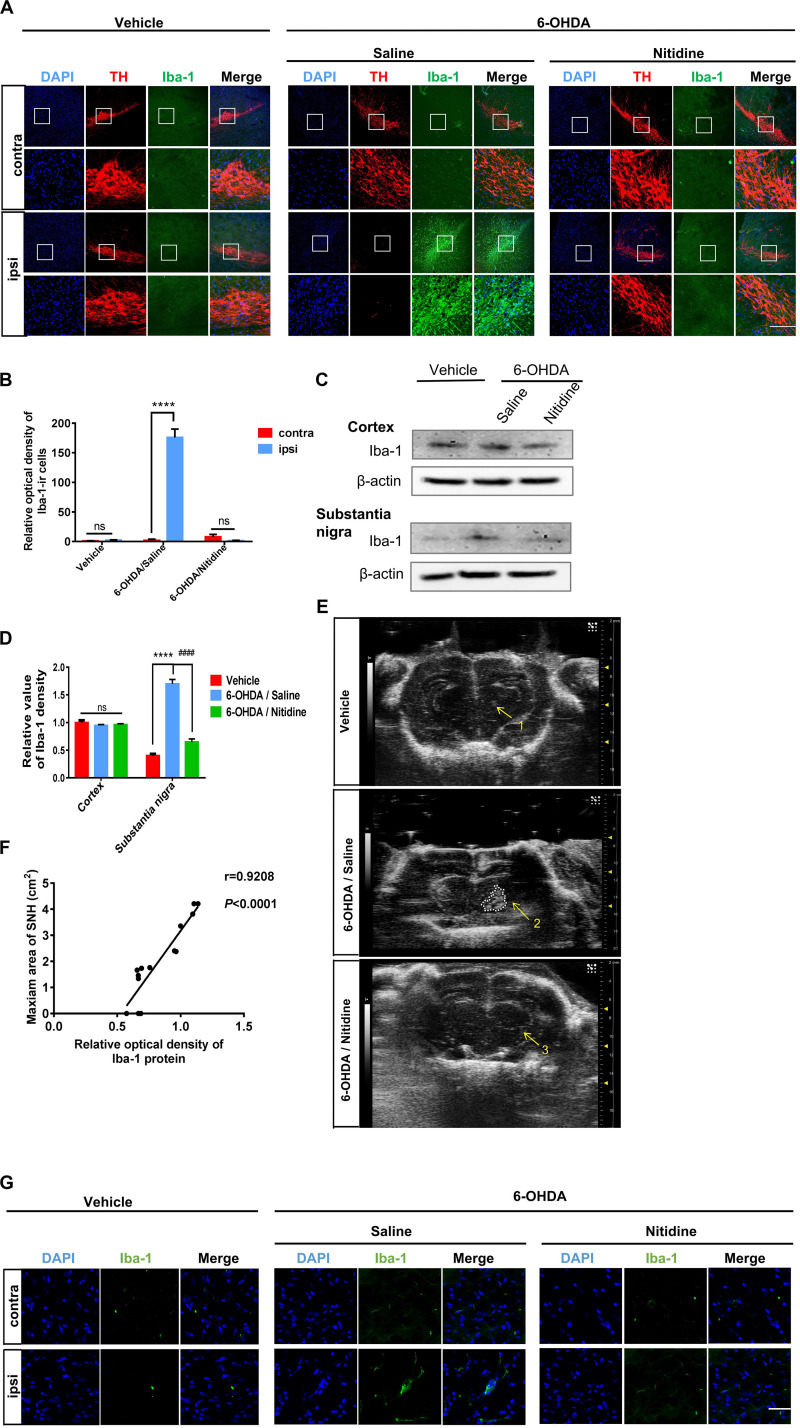
Parkinson's disease (PD) is the second most common neurodegenerative disease, and there is still no effective way to stop its progress. Therefore, early detection is crucial for the prevention and the treatment of Parkinson's disease. The current diagnosis of Parkinson's disease, however, mainly depends on the symptoms, so it is necessary to establish a reliable imaging modality for PD diagnosis and its progression monitoring. Other studies and our previous ones demonstrated that substantia nigra hyperechogenicity (SNH) was detected by transcranial sonography (TCS) in the ventral midbrain of PD patients, and SNH is regarded as a characteristic marker of PD. The present study aimed to explore whether SNH could serve as a reliable imaging modality to monitor the progression of dopaminergic neurodegeneration of PD. The results revealed that the size of SNH was positively related with the degree of dopaminergic neuron death in PD animal models. Furthermore, we revealed that microglia activation contributed to the SNH formation in substantia nigra (SN) in PD models. Taken together, this study suggests that SNH through TCS is a promising imaging modality to monitor the progression of dopaminergic neurodegeneration of PD.

Keywords: Parkinson’s disease; dopaminergic neuron; microglia activation; substantia nigra hyperechogenicity; transcranial sonography.


Figures

FIGURE 1
FIGURE 1
Transcranial sonography (TCS) images and qualification of substantia nigra hyperechogenicity (SNH) after unilateral stereotactic surgery. Male rats were injected with either 6-hydroxydopamine (6-OHDA) (n = 10) or vehicle (n = 10). At 15 days after surgery, TCS detection was performed. (A) Image of the midbrain plane showing a significant hyperechogenicity of 6-OHDA-lesioned rats (2), while only a scatter echo corresponding to the shape of the needle was observed in the vehicle group (1). Area 2 = 3.057 cm2. (B) General condition of TCS detection. (C) Statistical result of the mean gray values of substantia nigra (t-test). Vehicle group: P = 0.0015, t = 3.35, df = 50, F = 1.002. 6-OHDA group: P < 0.0001, t = 6.935, df = 52, F = 2.713. (D) Statistical result of the maximum SNH area (t-test). P < 0.0001, t = 11.44, df = 12. *Comparison between contralateral and ipsilateral from a single group. ns P > 0.05, **P < 0.01, ***P < 0.001, ****P < 0.0001.
FIGURE 2
FIGURE 2
Transcranial sonography (TCS) images and qualification of substantia nigra hyperechogenicity (SNH) after unilateral stereotactic surgery following treatment with nitidine. The rats were pretreated with nitidine (2.5 mg/kg, once daily) or sterile saline for 2 days before surgery and 15 days after surgery. (A) The TCS images showed that the SNH area in the midbrain plane of the nitidine-treated group (4, 5) was significantly smaller than that in the saline-treated group (2, 3), while only a scatter echo matching the shape of the needle emerged in the vehicle group (1). Area 2 = 4.211 cm2, area 3 = 3.336 cm2. (B) Statistical result of the maximum SNH areas in different groups (t-test). P = 0.0069, t = 3.776, df = 7, F = 1.821. (C) Statistical results of the mean gray values of substantia nigra (SN) area. Vehicle group: t-test. P = 0.0052, t = 2.915, df = 52, F = 1.086. 6-Hydroxydopamine (6-OHDA)/saline group: t-test. P < 0.0001, t = 10.25, df = 52, F = 5.769. 6-OHDA/nitidine: t-test. P < 0.0001, t = 11.25, df = 130, F = 7.791. Comparison between contralateral sides: one-way ANOVA. P = 0.2051, F = 1.606. Comparison between ipsilateral sides: one-way ANOVA. P < 0.0001, F = 11.43. (D) Correlation analysis of mean gray values of SN areas and the maximum SNH area. P = 0.0010, r = 0.7612, R2 = 0.5794, F = 17.9. *Comparison between contralateral and ipsilateral from a single group. #Comparison between different groups. ns P > 0.05, #P < 0.05, ####P < 0.0001, **P < 0.01, ***P < 0.001, ****P < 0.0001.
FIGURE 3
FIGURE 3
Dopaminergic neuron survival in Parkinson’s disease (PD) models following treatments. (A) Tyrosine hydroxylase (TH)-immunoreactive neurons (red) in the PD rats. Scale bar depicts 500 μm. (B) Statistical result of optical density values of TH-ir cells in SN (t-test). Vehicle group: P = 0.8816, t = 0.1587, df = 4, F = 1.144. 6-Hydroxydopamine (6-OHDA)/saline: P = 0.0003, t = 11.86, df = 4, F = 18.13. 6-OHDA/nitidine: P = 0.0043, t = 5.853, df = 4, F = 1.571. (C) Statistical result of TH-ir cell numbers in SN (t-test). Vehicle group: P = 0.6134, t = 0.5472, df = 4, F = 6.356. 6-OHDA/saline: P = 0.0002, t = 12.47 df = 4, F = 14.23. 6-OHDA/nitidine: P < 0.0001, t = 17.85, df = 4, F = 1.652. Comparison between ipsilateral sides: one-way ANOVA. P < 0.0001, F = 113.8. *Comparison between contralateral and ipsilateral from a single group. #Comparison between different groups. ns P > 0.05, #P < 0.05, ####P < 0.0001, **P < 0.01, ***P < 0.001, ****P < 0.0001.
FIGURE 4
FIGURE 4
Correlation analysis between different qualification standards of dopaminergic neuron survival and substantia nigra hyperechogenicity (SNH) in Parkinson’s disease (PD). (A) Correlation analysis between optical density (OD) values of TH-ir cells and maximum SNH area under transcranial sonography (TCS). P = 0.0007, r = –0.7762, R2 = 0.6025, F = 19.7. (B) Correlation analysis between TH-ir cell numbers and maximum SNH area under TCS. P = 0.0296, r = –0.5611, R2 = 0.3148, F = 5.972. (C) Correlation analysis between OD values of TH-ir cells and mean gray values of substantia nigra (SN) under TCS. P = 0.0045, r = –0.6893, R2 = 0.4752, F = 11.77. (D) Correlation analysis between TH-ir cell numbers and mean gray values of SN under TCS. P = 0.8089, r = 0.06829, R2 = 0.004664, F = 0.06092.
FIGURE 5
FIGURE 5
Reactive microgliosis in the substantia nigra (SN) of 6-hydroxydopamine (6-OHDA)-induced Parkinson’s disease rats with or without nitidine treatment. (A) Double immunofluorescence of the activated microglia marker Iba-1 (green) and tyrosine hydroxylase-immunoreactive dopaminergic neurons (red). Scale bar depicts 500 μm. (B) Statistical result of the optical density values of Iba-1-ir cells. Vehicle group: t-test. P = 0.0589, t = 2.618 df = 4, F = 4.355. 6-OHDA/saline group: t-test. P < 0.0001, t = 20.99, df = 4, F = 52.36. 6-OHDA/nitidine: t-test. P = 0.0554, t = 2.678, df = 4, F = 86.41. (C) Iba-1 protein expression revealed by Western blot. (D) Histogram showing that the level of Iba-1 protein was significantly decreased in the SN of the nitidine-treated group. One-way ANOVA. Cortex: P = 0.4348, F = 0.96. Substantia nigra: P < 0.0001, F = 141.8. (E) Transcranial sonography (TCS) images and substantia nigra hyperechogenicity (SNH) qualification after nitidine or saline treatment. Only a scatter echo matching the shape of the needle emerged in the vehicle group (1); the nitidine-treated group did not show visible SNH (3), while the saline-treated group showed a significant SNH (2). Area 2 = 1.111 cm2. (F) Correlation analysis between Iba-1 protein expression and maximum SNH area under TCS. P < 0.0001, r = 0.9208, R2 = 0.848, F = 66.93. (G) Morphological changes of Iba-1-ir microglia under × 80 lens. Scale bar depicts 3 cm. *Comparison between contralateral and ipsilateral from a single group. #Comparison between different groups. ns P > 0.05, #P < 0.05, ####P < 0.0001, **P < 0.01, ***P < 0.001, ****P < 0.0001.

Similar articles

Cited by

References

    1. Becker G., Seufert J., Bogdahn U., Reichmann H., Reiners K. (1995). Degeneration of substantia nigra in chronic Parkinson’s disease visualized by transcranial color-coded real-time sonography. Neurology 45 182–184. 10.1212/wnl.45.1.182 - DOI - PubMed
    1. Behnke S., Berg D., Naumann M., Becker G. (2005). Differentiation of Parkinson’s disease and atypical parkinsonian syndromes by transcranial ultrasound. Dkgest World Latest Med. Inform. 76 423–425. 10.1136/jnnp.2004.049221 - DOI - PMC - PubMed
    1. Berg D. (2007). Disturbance of iron metabolism as a contributing factor to SN hyperechogenicity in Parkinson’s Disease: implications for idiopathic and monogenetic forms. Neurochem. Res. 32 1646–1654. 10.1007/s11064-007-9346-5 - DOI - PubMed
    1. Berg D., Godau J., Riederer P., Gerlach M., Arzberger T. (2010). Microglia activation is related to substantia nigra echogenicity. J. Neural Transm. 117 1287–1292. 10.1007/s00702-010-0504-6 - DOI - PubMed
    1. Berg D., Grote C., Rausch W. D., Mäurer M., Wesemann W., Riederer P., et al. (1999). Iron accumulation in the substantia nigra in rats visualized by ultrasound. Ultrasound Med. Biol. 25 901–904. 10.1016/s0301-5629(99)00046-0 - DOI - PubMed

LinkOut - more resources