. 2020 Jul 29:14:228.
doi: 10.3389/fncel.2020.00228. eCollection 2020.

Purkinje Cell-Specific Knockout of Tyrosine Hydroxylase Impairs Cognitive Behaviors

Affiliations

Purkinje Cell-Specific Knockout of Tyrosine Hydroxylase Impairs Cognitive Behaviors

Timothy M Locke et al. Front Cell Neurosci. .

Abstract

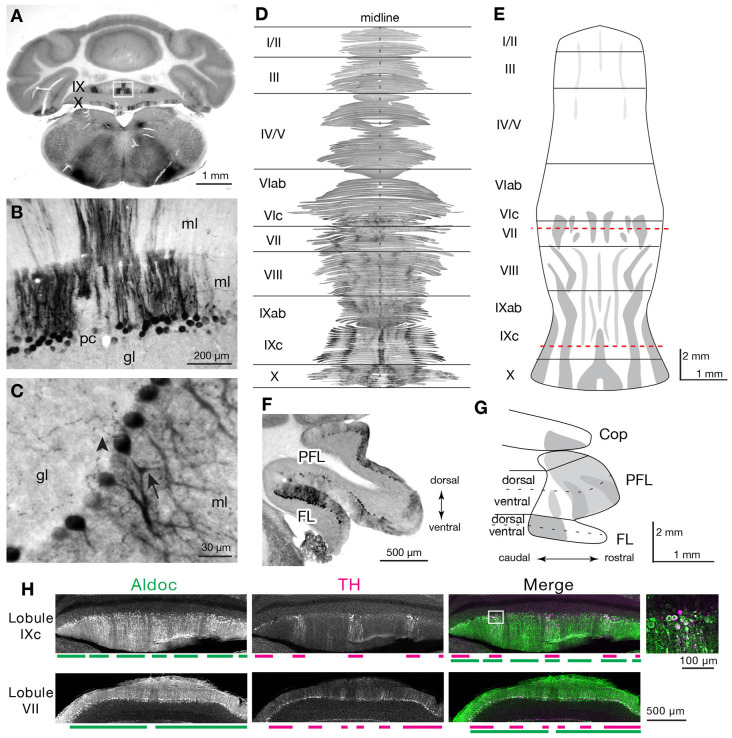
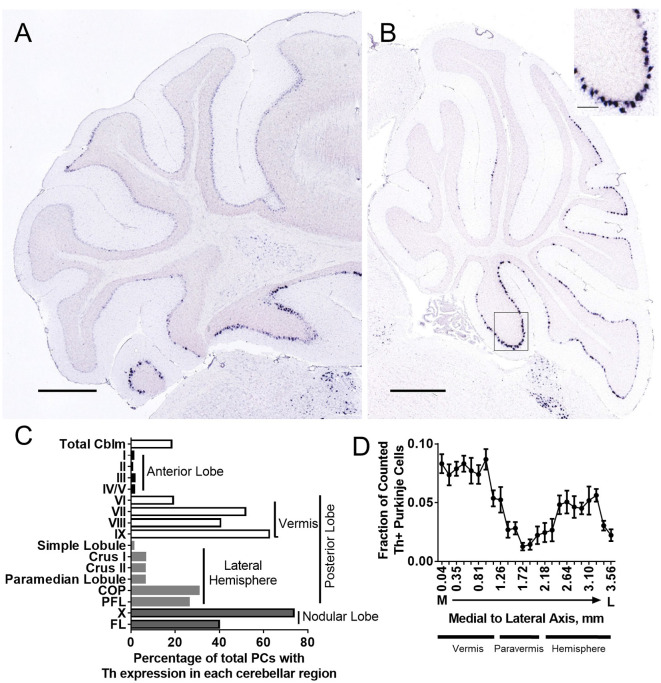
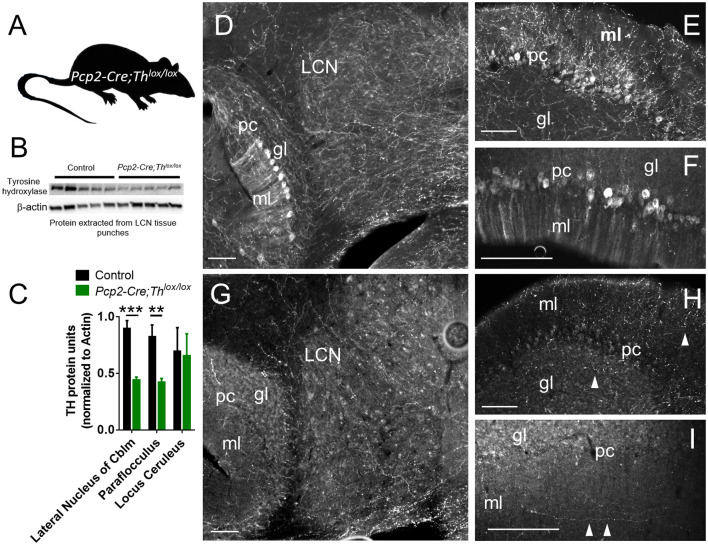
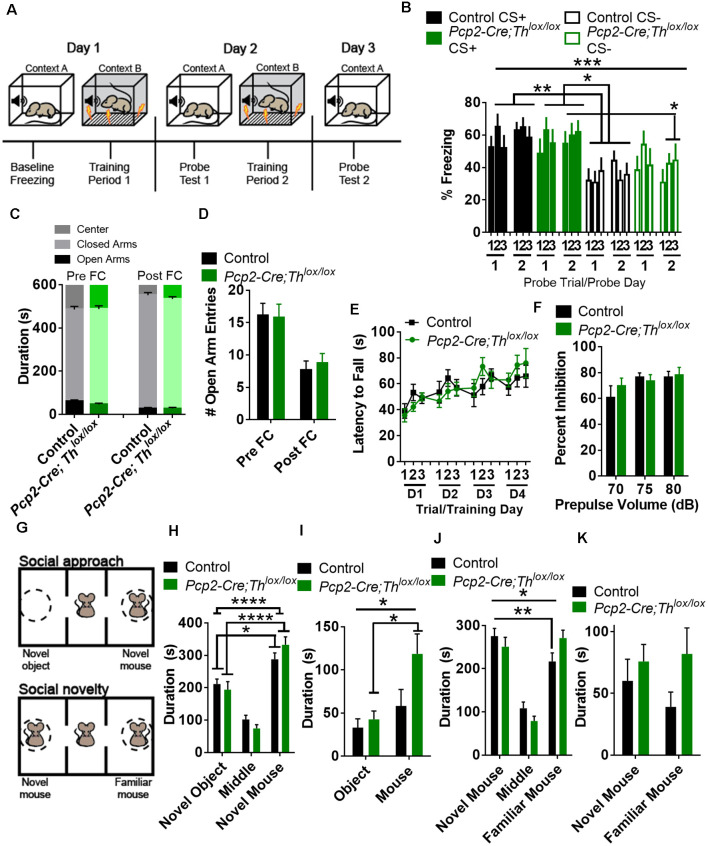
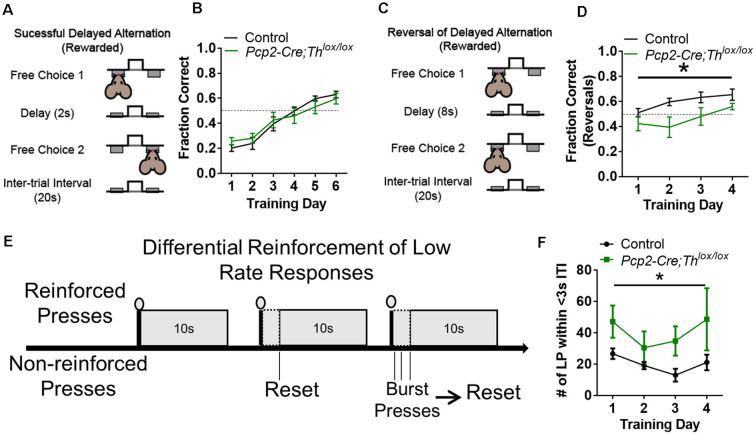
Tyrosine hydroxylase (Th) expression has previously been reported in Purkinje cells (PCs) of rodents and humans, but its role in the regulation of behavior is not understood. Catecholamines are well known for facilitating cognitive behaviors and are expressed in many regions of the brain. Here, we investigated a possible role in cognitive behaviors of PC catecholamines, by mapping and testing functional roles of Th positive PCs in mice. Comprehensive mapping analyses revealed a distinct population of Th expressing PCs primarily in the posterior and lateral regions of the cerebellum (comprising about 18% of all PCs). To identify the role of PC catecholamines, we selectively knocked out Th in PCs using a conditional knockout approach, by crossing a Purkinje cell-selective Cre recombinase line, Pcp2-Cre, with a floxed tyrosine hydroxylase mouse line (Thlox/lox) to produce Pcp2-Cre;Thlox/lox mice. This manipulation resulted in approximately 50% reduction of Th protein expression in the cerebellar cortex and lateral cerebellar nucleus, but no reduction of Th in the locus coeruleus, which is known to innervate the cerebellum in mice. Pcp2-Cre;Thlox/lox mice showed impairments in behavioral flexibility, response inhibition, social recognition memory, and associative fear learning relative to littermate controls, but no deficits in gross motor, sensory, instrumental learning, or sensorimotor gating functions. Catecholamines derived from specific populations of PCs appear to support cognitive functions, and their spatial distribution in the cerebellum suggests that they may underlie patterns of activation seen in human studies on the cerebellar role in cognitive function.

Keywords: catecholamine; cerebellum; cognition; dopamine; purkinje cell.


Figures

Figure 1
Figure 1
Immunostaining for Th reveals the striped distribution of the Th+ Purkinje cells (PCs) in the cerebellar cortex of the posterior vermis and parafloccular/floccular complex. (A) Immunostaining for Th reveals physiological Th expression in the cerebellum. Expression in lobules IX and X are shown in the coronal section. (B) Robust immunoreactivity for Th is identified in a subset of Purkinje cells that are arranged in parasagittal stripes. Cell bodies and dendrites of these PCs were labeled. ml, molecular layer; pc, Purkinje cell layer; gl, granule cell layer. (C) High magnification of Th+ PCs demonstrates Th+ puncta (arrowhead) that are in close apposition to PCs. Purkinje cell bodies and apical dendrites (Arrow) again show intense immunoreactivity for Th. ml, molecular layer; pc, Purkinje cell layer; gl, granule cell layer. (D) Serial section alignment analysis for the entire vermal cortex to visualize stripes of Th+ PCs. The result demonstrates an unfolded flat map of the vermal cortex reconstructed from the serial cerebellar sections immunostained for Th (see “Materials and Methods” section). (E) Schematic representation of the striped distribution of the Th+ vermal PCs. Drawn from the analysis in panel (D). Red dotted lines indicate the approximate location of the images in panel (H). (F) Th-immunoreactive PCs identified in the parafloccular/floccular (PFL/FL) complex. (G) Schematic representation of the distribution of the Th+ parafloccular/floccular PCs. (H) Double immunostaining for Th and Aldoc of cerebellar sections. Colabeling of Th (magenta) and Aldoc (green) is revealed in a subset of Aldoc+ Purkinje cells. Images of lobules IXc or VII, at levels indicated in (B), are shown. Below each panel is magenta and green bars that represent striped expression patterns of Th and Aldoc, respectively. Inset shows a higher magnification image of PCs, at an area marked with a white rectangle, that is colabeled with Th and Aldoc.
Figure 2
Figure 2
Th+ Purkinje cell counting with in situ hybridization (ISH). Th+ Purkinje cells (dark blue) populate multiple regions of the cerebellum. Th mRNA was measured in six brains from the Allen Brain Atlas (Table 1). (A) Coronal section from Allen Mouse Brain Atlas (2004). Image credit: Allen Institute (Experiment 1056; Lein et al., 2007). (B) Sagittal section from Allen Mouse Brain Atlas (2004). Image credit: Allen Institute (Experiment 1058; Lein et al., 2007). Scale bar = 652 microns. N = 6 brains. Inset, higher magnification from area in square. Inset scale bar = 100 microns. (C) Estimated percentage of Purkinje cells with Th+ expression in each cerebellar cortical region. (D) A fraction of counted Th+ Purkinje cells in sagittal sections along medial to the lateral axis. Error bars are SEM.
Figure 3
Figure 3
Generation and confirmation of mouse with conditional deletion of Th in Purkinje Cells. (A) Schematic for Purkinje Cell-specific knockout of Th: Pcp2-Cre mice crossed with Thlox/lox mice to generate Pcp2-Cre;Thlox/lox mice. (B) Western Blot from LCN with five representative controls on the left and five Pcp2-Cre;Thlox/lox mice on the right. The top band is Th, the β-actin band is on the bottom. (C) Quantification of Western Blots, from LCN, paraflocculus, and locus coeruleus. Error bars are SEM. Each Th band normalized to β-actin. ***p < 0.0003, one-tailed t-test, t(8) = 6.03. **p < 0.0065, one-tailed t-test, t(8) = 3.69. For LC comparison, p = 0.9. (D–I) Staining of Th in the red color channel in LCN, paraflocculus, and vermis (Lobule IX) of control (D–F) and Pcp2-Cre;Thlox/lox mice (G–I). Labels: ml = molecular layer, pc = Purkinje cell layer, gl = granule cell layer. Scale bars = 100 microns. The manipulation resulted in a significant reduction in the Th+ fibers innervating the LCN (D vs. G), and complete deletion of the Th signals in the PCs [D vs. G, E vs. H, for the paraflocculus, F vs. I for the posterior vermis (Lobule IX)], though some Th fibers (white arrowheads) are still present in the ml and gl layers in Pcp2-Cre;Thlox/lox mice, likely representing extrinsic sources of Th.
Figure 4
Figure 4
Conditional knockout of Th in all Purkinje cell fibers results in altered fear conditioning and social recognition memory, but not anxiety, sensorimotor gating, or gross motor deficits. (A) Schematic for fear conditioning experiment. (B) Freezing after fear conditioning of Pcp2-Cre;Thlox/lox mice (Green, n = 10) and littermate controls (Black, n = 18) on a fear discrimination task with a low-amplitude shock (0.3 mA) in both groups showed an increased association of CS+ to shock on the probe. There was an effect of genotype, F(3,52) = 6.59, p = 0.0007, but not an effect of training F(5,260) = 1.37, p = 0.236, or an effect of interaction between genotype and training F(15,260) = 0.96, p = 0.498, Two-way rmANOVA. On post hoc analyses (Tukey’s multiple comparisons test) Control mice discriminated between CS+ and CS− over the entire period (**p < 0.01), while Pcp2-Cre;Thlox/lox mice did not. Both groups discriminated between CS+ and CS− after 2 days of conditioning, *p < 0.05. Error bars are SEM. (C) Time spent in the center area, open and closed arms before (Pre FC), and after (Post FC) fear conditioning. Pcp2-Cre;Thlox/lox mice (Green, n = 10) and littermate controls (Black, n = 18) mice showed no differences in time spent in any region before or after fear conditioning. Error bars are SEM. (D) Number of entries into open arms before (Pre FC) and after (Post FC) fear conditioning. Pcp2-Cre;Thlox/lox mice (Green, n = 10) and littermate controls (Black, n = 18) mice showed no differences in time spent in open arms before or after fear conditioning. Error bars are SEM. (E) Performance of control (black, n = 9) and Pcp2-Cre;Thlox/lox mice (green, n = 6) on accelerating rotarod over 4 days of training. No difference observed between groups or the effect of group interaction with training. Error bars are SEM. (F) Prepulse inhibition of the acoustic startle reflex was not significantly different between groups; Pcp2-Cre;Thlox/lox mice (Green, n = 10), controls (Black, n = 10). No difference observed between groups or the effect of interaction between group and prepulse volume. Error bars are SEM. (G) Schematic of social interaction assays. (H) Social approach as measured by time spent in the arena with a novel mouse or novel object. Factor for time spent in zone(F(2,78) = 71.53, p < 0.0001) was significant, but interaction (genotype group × zone, F(2,78) = 2.22, *p = 0.115) and genotype (F(1,78) < 0.0001, p = 0.996) were not. On post hoc analysis, both controls and Pcp2-Cre;Thlox/lox had preferences for novel animal over novel objects (Black, n = 11, *p < 0.05), Pcp2-Cre;Thlox/lox mice (Green, n = 7, ****p < 0.0001), Two-way rmANOVA, Sidak’s multiple comparison’s test. Error bars are SEM. (I) Social approach as measured by time spent in interaction zones with a novel mouse or novel object. Factors for time spent in interaction zone (F(1,16) = 20.63, ***p < 0.001) and interaction (genotype group × zone, F(1,16) = 5.2, *p < 0.05) were significant, but genotype (F(1,16) = 2.79, *p < 0.114) was not. On post hoc analysis, only Pcp2-Cre;Thlox/lox had preferences for novel animal interaction zone over the novel object (Green, n = 7, ***p < 0.001), Two-way rmANOVA, Sidak’s multiple comparison’s tests. Error bars are SEM. (J) Social preference as measured by time spent in the arena with a novel or familiar mouse. Factors for interaction (genotype group × zone, F(2,32) = 3.87, *p < 0.05) and zone (F(2,32) = 25.33, p < 0.0001) were significant, as well as for time spent (preference for novel mouse over a familiar mouse) in control mice (Black, n = 11, **p < 0.01), but not Pcp2-Cre;Thlox/lox mice (Green, n = 7) on post hoc analysis. Two-way rmANOVA, Sidak’s multiple comparison test. Error bars are SEM. (K) Time spent in interaction zones in the social novelty phase of the test. No significant difference in the factors of time, genotype or interaction was found between controls and Pcp2-Cre;Thlox/lox mice in this comparison. Error bars are SEM.
Figure 5
Figure 5
Conditional knockout of Th in all Purkinje cells results in altered behavioral flexibility and response inhibition, but not instrumental learning, or working memory. (A) Schematic of delayed alternation test for working memory, adapted from Beas et al. (2017). (B) Performance between Pcp2-Cre;Thlox/lox mice (Green, n = 8) and littermate controls (Black, n = 8) in delayed alternation with a 2-s delay. No difference observed between groups or the effect of interaction between group and time. Error bars are SEM. (C) Schematic of reversal of delayed alternation test for behavioral flexibility, adapted from Beas et al. (2017). (D) Performance of Pcp2-Cre;Thlox/lox mice (Green, n = 8) relative to littermate controls (Black, n = 8) in performance of delayed alternation reversal with 8-s delay. There was an effect of genotype group, F(1,13) = 5.96, *p < 0.03 and training F(3,39) = 6.68, *p < 0.001, but not for an effect between group × training F(3,39) = 1.23, p = 0.313. Two-way rmANOVA. Error bars are SEM. (E) Schematic of differential reinforcement of low rate responses test for impulsive pressing, adapted from Nautiyal et al. (2015) and Locke et al. (2018). (F) Burst pressing performance (presses <3 s after last rewarded press, ITI = intertrial interval) of Pcp2-Cre;Thlox/lox mice (Green, n = 6) relative to littermate controls (black, n = 7) on DRL task over 4 days of training. There was an effect of group, F(1,11) = 6.59, *p < 0.03. There was not an effect of training or the effect of interaction between group and training. Two-way rmANOVA. Error bars are SEM.

References

    1. Aarsland D., Bronnick K., Williams-Gray C., Weintraub D., Marder K., Kulisevsky J., et al. . (2010). Mild cognitive impairment in Parkinson disease: a multicenter pooled analysis. Neurology 75, 1062–1069. 10.1212/wnl.0b013e3181f39d0e - DOI - PMC - PubMed
    1. Abbott L. C., Isaacs K. R., Heckroth J. A. (1996). Co-localization of tyrosine hydroxylase and zebrin II immunoreactivities in Purkinje cells of the mutant mice, tottering and tottering/leaner. Neuroscience 71, 461–475. 10.1016/0306-4522(95)00444-0 - DOI - PubMed
    1. Apps R., Hawkes R. (2009). Cerebellar cortical organization: a one-map hypothesis. Nat. Rev. Neurosci. 10, 670–681. 10.1038/nrn2698 - DOI - PubMed
    1. Apps R., Hawkes R., Aoki S., Bengtsson F., Brown A. M., Chen G., et al. . (2018). Cerebellar modules and their role as operational cerebellar processing units: a consensus paper [corrected]. Cerebellum 17, 654–682. 10.1007/s12311-018-0959-9 - DOI - PMC - PubMed
    1. Arnsten A. F. (2006). Stimulants: therapeutic actions in ADHD. Neuropsychopharmacology 31, 2376–2383. 10.1038/sj.npp.1301164 - DOI - PubMed

LinkOut - more resources