. 2020 Jul 23:12:28.
doi: 10.3389/fnsyn.2020.00028. eCollection 2020.

Identification of Potential Interacting Proteins With the Extracellular Loops of the Neuronal Glycoprotein M6a by TMT/MS

Affiliations

Identification of Potential Interacting Proteins With the Extracellular Loops of the Neuronal Glycoprotein M6a by TMT/MS

Gabriela I Aparicio et al. Front Synaptic Neurosci. .

Abstract

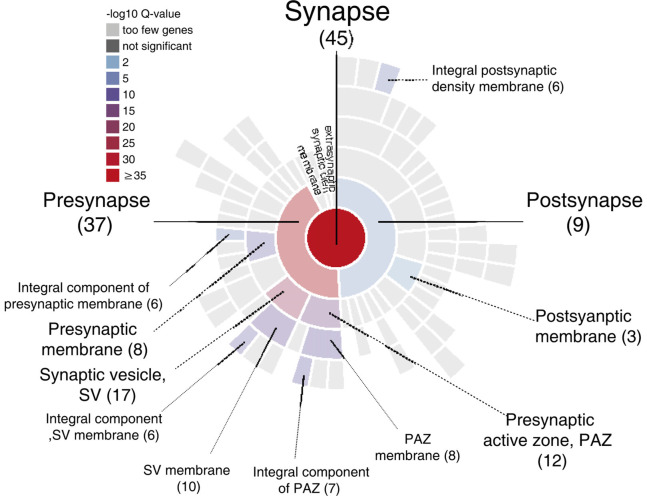
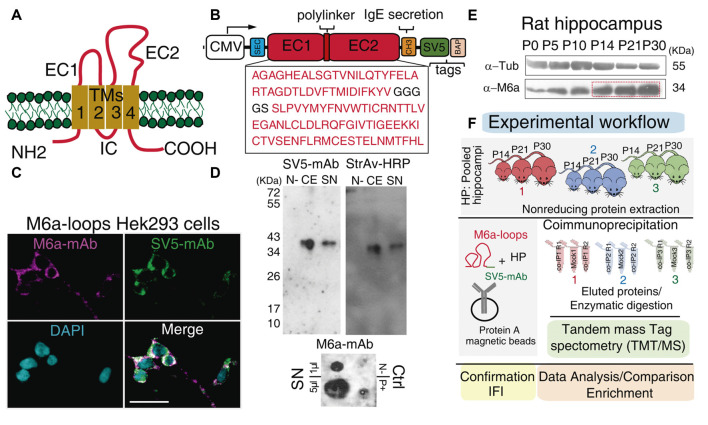
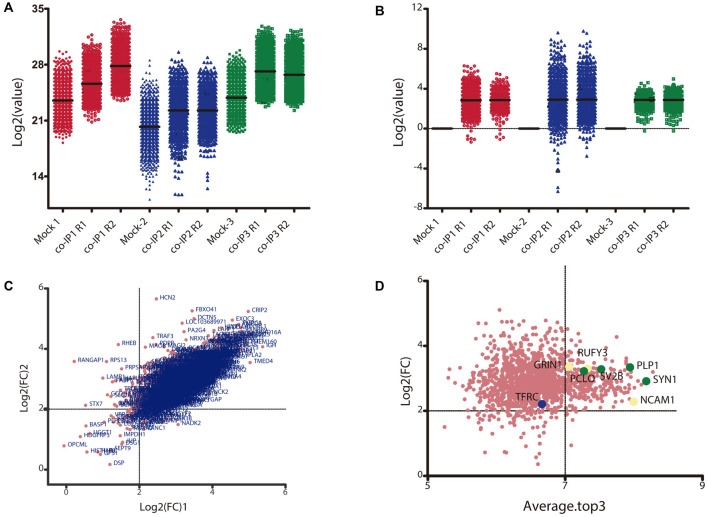
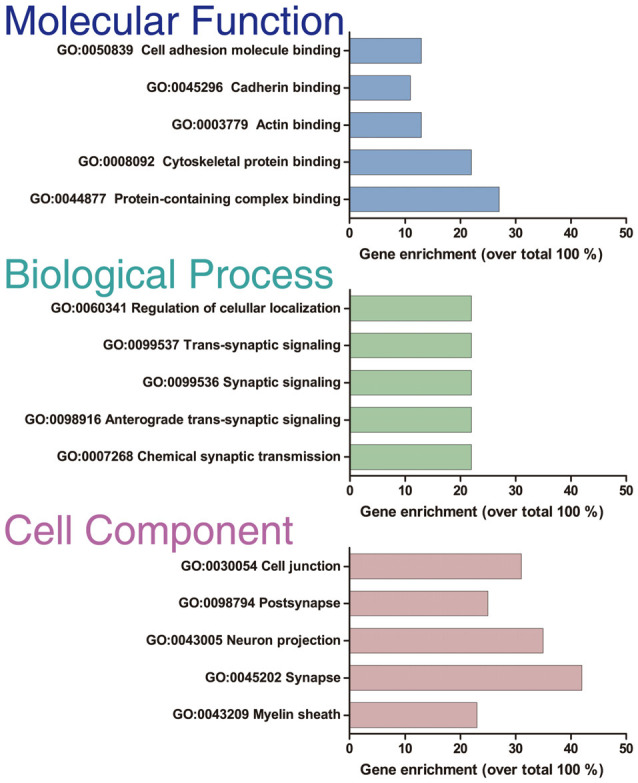
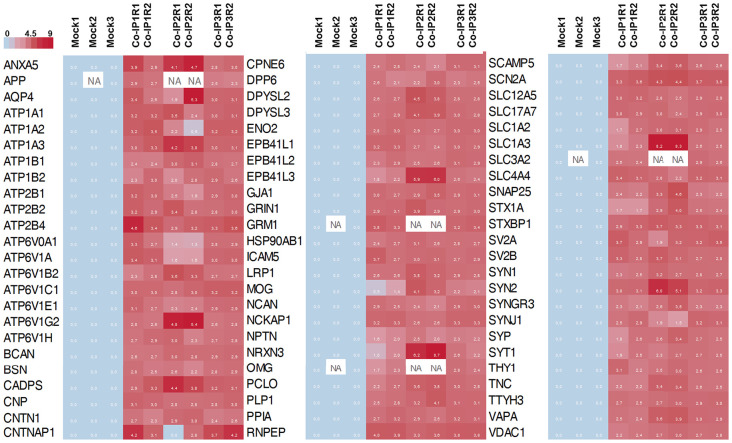
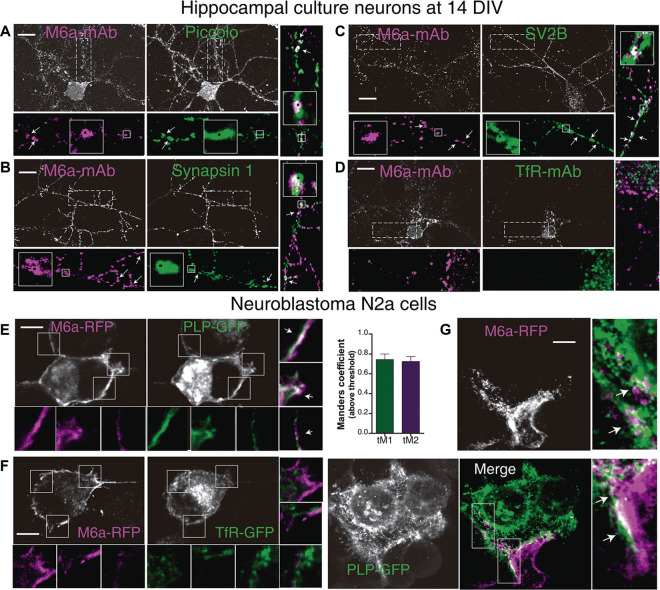
Nowadays, great efforts are made to gain insight into the molecular mechanisms that underlie structural neuronal plasticity. Moreover, the identification of signaling pathways involved in the development of psychiatric disorders aids the screening of possible therapeutic targets. Genetic variations or alterations in GPM6A expression are linked to neurological disorders such as schizophrenia, depression, and Alzheimer's disease. GPM6A encodes the neuronal surface glycoprotein M6a that promotes filopodia/spine, dendrite, and synapse formation by unknown mechanisms. A substantial body of evidence suggests that the extracellular loops of M6a command its function. However, the proteins that associate with them and that modulate neuronal plasticity have not been determined yet. To address this question, we generated a chimera protein that only contains the extracellular loops of M6a and performed a co-immunoprecipitation with rat hippocampus samples followed by TMT/MS. Here, we report 72 proteins, which are good candidates to interact with M6a's extracellular loops and modify its function. Gene ontology (GO) analysis showed that 63% of the potential M6a's interactor proteins belong to the category "synapse," at both sides of the synaptic cleft, "neuron projections" (51%) and "presynapse" (49%). In this sense, we showed that endogenous M6a interacts with piccolo, synaptic vesicle protein 2B, and synapsin 1 in mature cultured hippocampal neurons. Interestingly, about 28% of the proteins left were related to the "myelin sheath" annotation, suggesting that M6a could interact with proteins at the surface of oligodendrocytes. Indeed, we demonstrated the (cis and trans) interaction between M6a and proteolipid protein (PLP) in neuroblastoma N2a cells. Finally, the 72 proteins were subjected to disease-associated genes and variants screening by DisGeNET. Apart from the diseases that have already been associated with M6a, most of the proteins are also involved in "autistic disorder," "epilepsy," and "seizures" increasing the spectrum of disorders in which M6a could play a role. Data are available via ProteomeXchange with identifier PXD017347.

Keywords: mass spectometry; protein-protein interaction; proteolipd protein family; rat hippocampal neurons; synaptic proteins.


Figures

GRAPHICAL ABSTRACT
GRAPHICAL ABSTRACT
Sunburst plot from SynGO analysis of M6a’s potential synaptic interactors (https://www.syngoportal.org/, Koopmans et al., 2019). This work shows a combination of co-immunoprecipitation assay with quantitative tandem mass tag spectrometry (TMT/MS) to identify potential protein-protein interactions. Using a chimera protein that only contains the extracellular loops of neuronal glycoprotein M6a, we performed a co-IP with rat hippocampi samples followed by TMT/MS. Data analysis revealed 72 potential interactors of M6a’s loops, 45 of which are related to synapse localization.
Figure 1
Figure 1
Workflow: from the chimera protein to co-immunoprecipitation and protein identification. (A) Schematic representation of M6a: it has four transmembrane domains (TM1-4), two extracellular loops, a small (EC1) and a large (EC2), an intracellular loop (IC) and the N- and C-terminus at the cell cytoplasm. (B) Scheme of the chimera protein: M6a-loops construct. The EC1 and EC2 of rat M6a (NCBI Reference Sequence: NP_835206.1), were cloned into the pBig plasmid. White box: CMV promoter, blue box: secretion signal peptide, SEC, red boxes: EC1, EC2, and the polylinker peptide, orange box: IgE secretion sequence, green box: SV5 tag and pink box: biotin acceptor peptide (BAP) tag. (C) M6a-loops-HEK293 cells were labeled with structural anti-M6a-mAb (magenta), anti-SV5-mAb (green), and the superposition of both channels is shown in white (Merge). Cells nuclei were stained with DAPI. Scale bar: 30 μm. (D) Representative Western blots (top panels) and Dot blot (DB, bottom panel) of cell extracts (CEs) and concentrated supernatants (SN) from M6a-loops-HEK293 cells and culture media respectively. Non-transfected HEK293 cells were used as the negative control. Rat hippocampi homogenates were used as a positive control in DB. Anti-SV5-mAb and Streptavidin-HRP were used to characterize the expression and secretion of M6a-loops. DB was done under non-denaturing conditions and 1 μl and 5 μl of M6a-loops from SN (0.5 mg/ml) were used. (E) Representative Western blot of rat hippocampus from postnatal day 0 (P0) to P30. Primary antibodies used were anti-M6a:COOH and anti-tubulin as the loading control. (F) Workflow of the co-IP-TMT/MS experiment. M6a-loops was captured with anti-SV5-mAb cross-linked into protein A magnetic beads. After, protein extracts from rat hippocampi homogenates of postnatal days 14, 21, and 30 (n = 3 animals per co-IP, one animal of each P day per experiment) were co-immunoprecipitated with M6a-loops. A total of three co-IPs were performed with their replicates (n = 9). Eluted proteins were enzymatically digested and peptides were subjected to TMT/MS. Finally, we performed data analysis, gene ontology (GO) enrichment analysis, and validation of these results.
Figure 2
Figure 2
Data transformation and analysis of differentially immunoprecipitated proteins per condition. (A) Raw intensity signal data from the TMT/MS assay. The Log2 of the raw intensity signal data is represented for each identified protein in each control (Mock 1-3) and experimental condition with their replicate (co-IP1-3R1-2). (B) Raw signal data after batch effect removal and data transformation. The plot shows the Log2 of the control ratio for each protein identified in each experimental condition after being processed. (C) Correlation between replicates for each co-IP experiment. The plot shows the Log2 of the fold change (Log2FC) for each identified protein in replicate 1 vs. replicate 2. The Pearson correlation between the two replicates is 0.751 (p < 0.0001). (D) Analysis of differentially immunoprecipitated proteins between Mock and co-IP conditions. The plot shows the Log2FC vs. the total peptide abundance; where the Average.Top3 is the average intensity for the three most abundant peptides of an individual protein and the denominator is the sum of all Top3 values in a condition. Proteins with a Log2FC ≥2 and an Average.Top3 ≥7 represents the optimal interacting proteins, which were used for further analysis. Proteins highlighted with cream dots have already been functionally related to M6a. Proteins highlighted with green dots and blue dots were selected for ulterior proteomic validation.
Figure 3
Figure 3
GO enrichment analysis. GO enrichment analysis of the 414 optimal interacting proteins. The analysis was done with the ToppFun application of the ToppGene Suit server. The plot shows the top five categories in which the proteins were classified for each category analyzed: “Molecular function,” “Biological process,” and “Cellular component.”
Figure 4
Figure 4
Heat map representation of the 72 differentially abundance proteins. The heat map shows the abundance of each protein in each co-IP (and replicates) compare to the control condition (Mock). In the color scale, sky blue represents proteins with low levels, and red represents proteins with high levels of abundance. White spots represent proteins with no signal available (NA).
Figure 5
Figure 5
M6a interacts with synaptic proteins and with major myelin protein, PLP. (A–D) Representative images of primary hippocampal cultured neurons at 14 DIV. Neurons were labeled for endogenous M6a (gray or magenta in the insets) and endogenous piccolo (A), synapsin 1 (B), SV2B (C), and TfR ((D; gray and green in the insets). The magnifications show 25 μm of primary (C,D), secondary (A), and tertiary (A,B) dendrite length. Punta Analyzer plugin of ImageJ was used to measure the colocalization between M6a and synaptic markers. Puncta Analyzer displayed images such as the ones shown here in which colocalization puncta are indicated by black squares (inset). Merged images show clusters of M6a colocalizing with clusters of piccolo (A) or synapsin-1 (B) and SV2B (C; with arrows and black squares). Scale bar: 10 μm. (E,F) Representative images of murine neuroblastoma N2a cells co-transfected with M6a-RFP/PLP-GFP (E) and M6a-RFP/TfR-GFP (F). The insets (5 × 5 μm) show the pattern of distribution of M6a-RFP (magenta) and PLP-GFP or TfR-GFP (green) and the merged images show colocalization between M6a-RFP and PLP-GFP (E, white arrows), but not between M6a-RFP and TfR-GFP. (G) Representative images of co-culture experiment between cells that only expressed PLP-GFP and cells that only expressed M6a-RFP. The magnification (5 × 10 μm) reveals patches of colocalization (white) between both cell surfaces. Scale bar: 5 μm. Confocal images were acquired with a 60× objective on an Olympus FV1000 confocal microscope. The colocalization between M6a and TfR or PLP was measured by the Coloc2 plugin of ImageJ. For those pairs of proteins positive for colocalization (average of Pearson’s coefficient over than 0.5). Mander’s coefficients (M1, green channel and M2, red channel) were measured and plotted (n = 13–25 cells). No positive Pearson’s coefficients of colocalization between endogenous M6a and TfR or M6a-RFP and TfR-GFP were measured.

References

    1. Alam M. S. (2018). Proximity ligation assay (PLA). Curr. Protoc. Immunol. 123:e58. 10.1002/cpim.58 - DOI - PMC - PubMed
    1. Alfonso J., Fernandez M. E., Cooper B., Flugge G., Frasch A. C. (2005). The stress-regulated protein M6a is a key modulator for neurite outgrowth and filopodium/spine formation. Proc. Natl. Acad. Sci. U S A 102, 17196–17201. 10.1073/pnas.0504262102 - DOI - PMC - PubMed
    1. Alfonso J., Pollevick G. D., Castensson A., Jazin E., Frasch A. C. (2002). Analysis of gene expression in the rat hippocampus using real time PCR reveals high inter-individual variation in mRNA expression levels. J. Neurosci. Res. 67, 225–234. 10.1002/jnr.10105 - DOI - PubMed
    1. Alfonso J., Pollevick G. D., Van Der Hart M. G., Flugge G., Fuchs E., Frasch A. C. (2004). Identification of genes regulated by chronic psychosocial stress and antidepressant treatment in the hippocampus. Eur. J. Neurosci. 19, 659–666. 10.1111/j.1460-9568.2004.03178.x - DOI - PubMed
    1. Almandoz-Gil L., Persson E., Lindstrom V., Ingelsson M., Erlandsson A., Bergstrom J. (2018). In situ proximity ligation assay reveals co-localization of alpha-synuclein and snare proteins in murine primary neurons. Front. Neurol. 9:180. 10.3389/fneur.2018.00180 - DOI - PMC - PubMed