. 2020 Jul 30:11:746.
doi: 10.3389/fpsyt.2020.00746. eCollection 2020.

Neural Decoding of Multi-Modal Imagery Behavior Focusing on Temporal Complexity

Affiliations

Neural Decoding of Multi-Modal Imagery Behavior Focusing on Temporal Complexity

Naoki Furutani et al. Front Psychiatry. .

Abstract

Mental imagery behaviors of various modalities include visual, auditory, and motor behaviors. Their alterations are pathologically involved in various psychiatric disorders. Results of earlier studies suggest that imagery behaviors are correlated with the modulated activities of the respective modality-specific regions and the additional activities of supramodal imagery-related regions. Additionally, despite the availability of complexity analysis in the neuroimaging field, it has not been used for neural decoding approaches. Therefore, we sought to characterize neural oscillation related to multimodal imagery through complexity-based neural decoding. For this study, we modified existing complexity measures to characterize the time evolution of temporal complexity. We took magnetoencephalography (MEG) data of eight healthy subjects as they performed multimodal imagery and non-imagery tasks. The MEG data were decomposed into amplitude and phase of sub-band frequencies by Hilbert-Huang transform. Subsequently, we calculated the complexity values of each reconstructed time series, along with raw data and band power for comparison, and applied these results as inputs to decode visual perception (VP), visual imagery (VI), motor execution (ME), and motor imagery (MI) functions. Consequently, intra-subject decoding with the complexity yielded a characteristic sensitivity map for each task with high decoding accuracy. The map is inverted in the occipital regions between VP and VI and in the central regions between ME and MI. Additionally, replacement of the labels into two classes as imagery and non-imagery also yielded better classification performance and characteristic sensitivity with the complexity. It is particularly interesting that some subjects showed characteristic sensitivities not only in modality-specific regions, but also in supramodal regions. These analyses indicate that two-class and four-class classifications each provided better performance when using complexity than when using raw data or band power as input. When inter-subject decoding was used with the same model, characteristic sensitivity maps were also obtained, although their decoding performance was lower. Results of this study underscore the availability of complexity measures in neural decoding approaches and suggest the possibility of a modality-independent imagery-related mechanism. The use of time evolution of temporal complexity in neural decoding might extend our knowledge of the neural bases of hierarchical functions in the human brain.

Keywords: convolutional neural network (CNN); expanded multiscale entropy (expMSE); magnetoencephalography (MEG); mental imagery; modality specific-regions; multivariate pattern analysis (MVPA); neural decoding; supramodal regions.


Figures

Figure 1
Figure 1
Frequency decomposition by ensemble empirical mode decomposition (EEMD): left panel, examples of the decomposed time series; right panel, relative power spectral densities of the respective IMFs.
Figure 2
Figure 2
Convolutional neural network (CNN) architecture for the expMSE, including Input, Conv, Pool, and FC layers. The equivalent model was also used for the band power, but the input was reduced to 68 × 3. Therefore, only the convolutional filter was reduced to 5 × 2. Conv., convolutional; Pool, = max pooling; FC, fully connected.
Figure 3
Figure 3
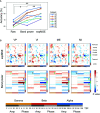
Intra-subject decoding of each task. (A) Decoding accuracies compared among raw data, band power and expMSE. Each color corresponds to a subject; **p < 0.01. (B) Task-related sensitivity maps of the example (subject S4). Upper and lower panels respectively portray maps for the expMSE and band power (VP, visual perception; VI, visual imagery; ME, motor execution; MI, motor imagery; black arrow, modality-specific sensitivity; green arrow, inverted sensitivity in the modality-specific regions). At the bottom are details of the horizontal axes: frequency × component (Amp/Phase) × TSF; Amp, amplitude expMSE; Phase, phase expMSE.
Figure 4
Figure 4
Inter-subject decoding of each task. (A) Decoding accuracies compared by band power and expMSE. Each color corresponds to a subject used for test data. *p < 0.05. (B) Task-related sensitivity maps. Upper and lower panels respectively portray maps for the expMSE and band power (VP, visual perception; VI, visual imagery; ME, motor execution; MI, motor imagery; black arrow, modality-specific sensitivity; green arrow, inverted sensitivity in the modality-specific regions). At the bottom are details of the horizontal axes: frequency × component (Amp/Phase) × TSF; Amp, amplitude expMSE; Phase, phase expMSE.
Figure 5
Figure 5
Intra-subject decoding of imagery behavior. (A) Decoding accuracies compared among raw data, band power and expMSE. Each color corresponds to a subject. *p < 0.05 and **p < 0.01. (B) Task-related sensitivity maps of example (subject S0). Upper and lower panels respectively show maps for the expMSE and band power (VP, visual perception; VI, visual imagery; ME, motor execution; MI, motor imagery; black filled arrow, modality-specific sensitivity; green filled arrow, inverted sensitivity in the modality-specific regions; black open arrow, modality-independent sensitivity; green open arrow, inverted sensitivity in the modality-independent regions). At the bottom are details of the horizontal axes: frequency × component (Amp/Phase) × TSF; Amp, amplitude expMSE; Phase, phase expMSE.
Figure 6
Figure 6
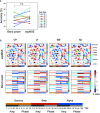
Inter-subject decoding of imagery behavior. (A) Decoding accuracies compared by band power and expMSE. Each color corresponds to a subject used for test data. n.s., not significant. (B) Task-related sensitivity maps. Upper and lower panels respectively portray maps for the expMSE and band power: VP, visual perception; VI, visual imagery; ME, motor execution; MI, motor imagery; black filled arrow, modality-specific sensitivity; green filled arrow, inverted sensitivity in the modality-specific regions; black open arrow, modality-independent sensitivity; green open arrow, inverted sensitivity in the modality-independent regions. At the bottom are details of the horizontal axes: frequency × component (Amp/Phase) × TSF; Amp, amplitude expMSE; Phase, phase expMSE.

References

    1. Haynes JD, Rees G. Decoding mental states from brain activity in humans. Nat Rev Neurosci (2006) 7:523–34. 10.1038/nrn1931 - DOI - PubMed
    1. Kragel PA, LaBar KS. Decoding the Nature of Emotion in the Brain. Trends Cognit Sci (2016) 20:444–55. 10.1016/j.tics.2016.03.011 - DOI - PMC - PubMed
    1. Skottnik L, Linden DEJ. Mental imagery and brain regulation—new links between psychotherapy and neuroscience. Front Psychiatry (2019) 10:779. 10.3389/fpsyt.2019.00779 - DOI - PMC - PubMed
    1. Chiba T, Kanazawa T, Koizumi A, Ide K, Taschereau-Dumouchel V, Boku S, et al. Current status of neurofeedback for post-traumatic stress disorder: A systematic review and the possibility of decoded neurofeedback. Front Hum Neurosci (2019) 13:233. 10.3389/fnhum.2019.00233 - DOI - PMC - PubMed
    1. Kummar AS, Correia H, Fujiyama H. A brief review of the EEG literature on mindfulness and fear extinction and its potential implications for Posttraumatic Stress Symptoms (PTSS). Brain Sci (2019) 9:258. 10.3390/brainsci9100258 - DOI - PMC - PubMed

LinkOut - more resources