. 2020 Jul 28:11:1640.
doi: 10.3389/fimmu.2020.01640. eCollection 2020.

Children From the Age of Three Show a Developmental Switch in T-Cell Differentiation

Affiliations

Children From the Age of Three Show a Developmental Switch in T-Cell Differentiation

Julienne Knolle et al. Front Immunol. .

Abstract

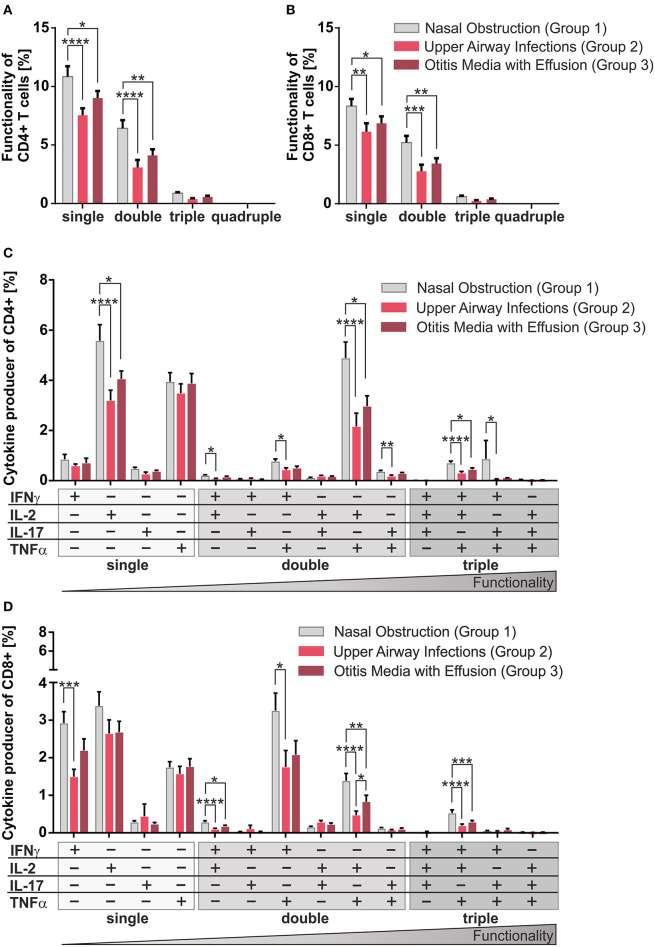
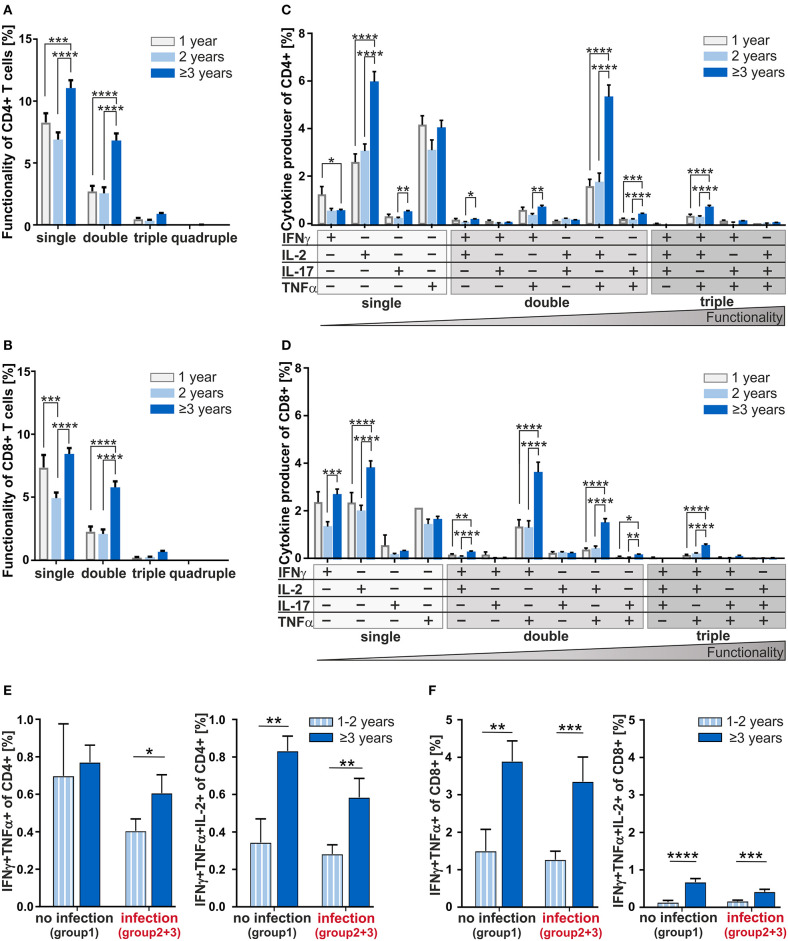
Every sixth child suffers from hypertrophy of the adenoid, a secondary lymphoid organ, at least once in childhood. Little is known about the impact of pathogen-provocation vs. developmental impact on T-cell responses after 1 year of age. Therefore, developmental and infection-driven influences on the formation of T-cell-compartments and -multifunctionality in adenoids were analyzed taking into account patient's history of age and inflammatory processes. Here, we show that in adenoids of 102 infants and children similar frequencies of naïve, effector, and memory T-cells were accumulated, whereby history of suffering from subsequent infection symptoms resulted in lower frequencies of CD4+ and CD8+ T-cells co-expressing several cytokines. While patients suffering from sole nasal obstruction had balanced Th1- and Th17-compartments, Th1 dominated in patients with concomitant upper airway infections. In addition, analysis of cytokine co-expressing CD4+ and CD8+ T-cells showed that children at the age of three or older differed significantly from those being 1- or 2-years old, implicating a developmental switch in T-cell differentiation at that age. Yet, dissecting age and infectious history of the patients revealed that while CD8+ T-cell differentiation seems to be triggered by development, CD4+ T-cell functionality is partly impaired by infections. However, this functionality recovers by the age of 3 years. Thus, 3 years of age seems to be a critical period in an infant's life to develop robust T-cell compartments of higher quality. These findings identify important areas for future research and distinguish an age period in early childhood when to consider adjusting the choice of treatment of infections.

Keywords: T-cell differentiation; adenoid; children; development; immune system; infant; multifunctional T-cells; pediatric immunology.


Figures

Figure 1
Figure 1
Phenotype of CD4+ and CD8+ T-cells among the three clinical groups. Mononuclear cells (MC) were isolated from adenoids of 102 children suffering from adenoid hypertrophy that underwent adenoidectomy. MCs of children with sole nasal obstruction (group 1), with those suffering from recurrent infections of the upper airways (group 2), or with concomitant otitis media with effusion (group 3) were either left unstimulated for phenotyping or stimulated for analysis of cytokine production with PMA and Ionomycin in the presence of Brefeldin A for 6 h. Surface marker or cytokine expression of CD4+ and CD8+ T-cells was determined by using flow cytometry. (A) Frequencies of naive/recent thymic emigrants, effector, and memory T-cells were compared depending on predominant clinical symptoms, each shown for total CD4+ (left side) and CD8+ (right side) T-cells. Children suffering from sole nasal obstruction (group 1, light gray bars), suffering from recurrent upper airway obstructions (group 2, red bars), or suffering from concomitant otitis media with effusion (group 3, dark red bars) are depicted. Each dot represents an individual patient out of n = 102. Horizontal lines indicate mean ± SEM (one-way ANOVA, Tukey HSD multiple comparisons). (B) The percentages of total IFNγ+ (light gray) or IL-17+ (dark gray) CD4+ (upper panel) and CD8+ (lower panel) T-cells were determined, calculated to hundred percent, and presented in a comparative manner. Kolmogorov-Smirnoff test as well as a Kruskal-Wallis method with post-hoc Dunn multiple comparison were used. Horizontal lines indicate mean ± SEM. *p < 0.05, **p < 0.01.
Figure 2
Figure 2
Multifunctionality of CD4+ and CD8+ T-cells among the three clinical groups. MCs of pediatric adenoids were stimulated as described in Figure 1. Intracellular cytokine expression of CD4+ and CD8+ T-cells was determined by using flow cytometry and the Boolean gating strategy. (A,B) Frequency of summarized CD4+ and CD8+ subpopulations (summarized subsets that express just one (single), or simultaneously two (double), three (triple), or four (quadruple) different cytokines) among all CD4+ (A) and CD8+ (B) T-cells. (C,D) Frequencies of individual CD4+ and CD8+ subpopulations (+ indicates the expressed cytokine) among all CD4+ (C) and CD8+ (D) T-cells. Light gray bars represent children suffering from sole upper airway obstruction (group 1), whereas red bars represent children additionally suffering from recurrent upper airway infections (group 2), and dark red bars stand for children with concomitant otitis media with effusion (group 3). The triangle symbolizes that the functionality of the T-cells increases with the number of cytokines produced simultaneously (two-way ANOVA, Tukey HSD multiple comparisons) *p < 0.05, **p < 0.01, ***p < 0.001, ****p < 0.0001.
Figure 3
Figure 3
Phenotype of CD4+ and CD8+ T-cells depending on age. MCs of adenoids of children being 1, 2, or 3 years and older with adenoidectomy were stimulated and analyzed as in Figure 1. (A) Frequencies of naive/recent thymic emigrants, effector, and memory T-cells are compared depending on age at the time of surgery, each shown for total CD4+ (left side) and CD8+ (right side) T-cells. One-year-old (light gray bars), 2-year-old (light blue bars), and 3-year-old and older (dark blue bars) infants and children are depicted. Each dot represents an individual patient from n = 102 infants and children included in the study. Horizontal lines indicate mean ± SEM (one-way ANOVA, Tukey HSD multiple comparison). *p < 0.05, **p < 0.01. (B) Line graphs represent linear regression with 95% confidence intervals among CD4+ and CD8+ T-cells. Functional populations for single producers for each individual cytokine analyzed within participants by advancing age (1–11 years). Line graph statistics were analyzed by Spearman r correlation (*p < 0.05, **p < 0.01, ****p < 0.0001). (C) The percentages of total IFNγ+ (light gray) or IL-17+ (dark gray) CD4+ (upper panel) and CD8+ (lower panel) T-cells were determined, calculated to hundred percent, and presented in a comparative manner. Kolmogorov-Smirnoff test as well as a Kruskal-Wallis method with post-hoc Dunn multiple comparison were used. Horizontal lines indicate mean ± SEM. *p < 0.05, **p < 0.01, ***p < 0.001.
Figure 4
Figure 4
Multifunctionality of CD4+ and CD8+ T-cells depending on age and cytokine co-expression profiles depending on the infection status. MCs of adenoids from children being 1, 2, or 3 years and older with adenoidectomy were stimulated as in Figure 1 and analyzed as in Figure 2. (A,B) Frequencies of summarized CD4+ and CD8+ subpopulations (summarized subsets that express just one (single), or simultaneously two (double), three (triple), or four (quadruple) different cytokines) among all CD4+ (A) and CD8+ (B) T-cells. (C,D) Frequencies of individual CD4+ and CD8+ subpopulations (+ indicates the expressed cytokine) among all CD4+ (C) and CD8+ (D) T-cells. Children being 1 year old (light gray bars) at the time of surgery, children being 2 years old (light blue bars), and children being 3 years and older (dark blue bars) are depicted. The triangle symbolizes that the functionality of the T-cells increases with the number of cytokines produced simultaneously (two-way ANOVA, Tukey HSD multiple comparisons). *p < 0.05, **p < 0.01, ***p < 0.001, ****p < 0.0001. (E,F) Frequencies of IFNγ and TNFα double positive CD4+ (E) and CD8+ (F) T-cells in children being 1 and 2 years of age or 3 years and older either with (summarized group 2 and 3) or without (group 1) infections are shown on the left, while frequencies of IFNγ, TNFα, and IL-2 triple positive CD4+ (E) and CD8+ (F) T-cells are shown on the right. White and light blue bars represent children being 1 and 2 years of age whereas dark blue bars represent children of 3 years and older at the time of surgery. Horizontal lines indicate mean ± SEM (Kolmogorov-Smirnoff test; Kruskal-Wallis method with post-hoc Dunn multiple comparison). *p < 0.05, **p < 0.01, ***p < 0.001, ****p < 0.0001.

References

    1. Moulton VR, Farber DL. Committed to memory: lineage choices for activated T cells. Trends Immunol. (2006) 27:261–7. 10.1016/j.it.2006.04.006 - DOI - PubMed
    1. Vogel K, Pierau M, Arra A, Lampe K, Schlueter D, Arens C, et al. . Developmental induction of human T-cell responses against Candida albicans and Aspergillus fumigatus. Sci Rep. (2018) 8:16904. 10.1038/s41598-018-35161-5 - DOI - PMC - PubMed
    1. van den Aardweg MT, Schilder AG, Herkert E, Boonacker CW, Rovers MM. Adenoidectomy for recurrent or chronic nasal symptoms in children. Cochrane Database Syst Rev. (2010) 328:487 10.1002/14651858.CD008282 - DOI - PMC - PubMed
    1. van den Aardweg MT, Schilder AG, Herkert E, Boonacker CW, Rovers MM. Adenoidectomy for otitis media in children. Cochrane Database Syst Rev. (2010) 300:1551. 10.1002/14651858.CD007810.pub2 - DOI - PubMed
    1. Ingram DG, Friedman NR. Toward adenotonsillectomy in children: a review for the general pediatrician. JAMA Pediatr. (2015) 169:1155–61. 10.1001/jamapediatrics.2015.2016 - DOI - PubMed

Publication types

MeSH terms