. 2020 Jul 28:11:1641.
doi: 10.3389/fimmu.2020.01641. eCollection 2020.

Androgen-Influenced Polarization of Activin A-Producing Macrophages Accompanies Post-pyelonephritic Renal Scarring

Affiliations

Androgen-Influenced Polarization of Activin A-Producing Macrophages Accompanies Post-pyelonephritic Renal Scarring

Teri N Hreha et al. Front Immunol. .

Abstract

Ascending bacterial pyelonephritis, a form of urinary tract infection (UTI) that can result in hospitalization, sepsis, and other complications, occurs in ~250,000 US patients annually; uropathogenic Escherichia coli (UPEC) cause a large majority of these infections. Although UTIs are primarily a disease of women, acute pyelonephritis in males is associated with increased mortality and morbidity, including renal scarring, and end-stage renal disease. Preclinical models of UTI have only recently allowed investigation of sex and sex-hormone effects on pathogenesis. We previously demonstrated that renal scarring after experimental UPEC pyelonephritis is augmented by androgen exposure; testosterone exposure increases both the severity of pyelonephritis and the degree of renal scarring in both male and female mice. Activin A is an important driver of scarring in non-infectious renal injury, as well as a mediator of macrophage polarization. In this work, we investigated how androgen exposure influences immune cell recruitment to the UPEC-infected kidney and how cell-specific activin A production affects post-pyelonephritic scar formation. Compared with vehicle-treated females, androgenized mice exhibited reduced bacterial clearance from the kidney, despite robust myeloid cell recruitment that continued to increase as infection progressed. Infected kidneys from androgenized mice harbored more alternatively activated (M2) macrophages than vehicle-treated mice, reflecting an earlier shift from a pro-inflammatory (M1) phenotype. Androgen exposure also led to a sharp increase in activin A-producing myeloid cells in the infected kidney, as well as decreased levels of follistatin (which normally antagonizes activin action). As a result, infection in androgenized mice featured prolonged polarization of macrophages toward a pro-fibrotic M2a phenotype, accompanied by an increase in M2a-associated cytokines. These data indicate that androgen enhancement of UTI severity and resulting scar formation is related to augmented local activin A production and corresponding promotion of M2a macrophage polarization.

Keywords: Escherichia coli; activin A; follistatin; macrophage polarization; urinary tract infection.


Figures

Figure 1
Figure 1
Androgenized mice exhibit severe UTI. Organ titers (CFU) were quantified in serially diluted bladder (A) or kidney (B) homogenates at the indicated time points post UPEC infection of vehicle-treated mice (open triangles) or TC-treated mice (filled triangles). Dotted line indicates the limit of detection; dpi, days post-infection. n = 4–10 mice per group. *P < 0.05, **P < 0.01, ***P < 0.001.
Figure 2
Figure 2
Activin A expression and production is increased in the kidneys of androgenized mice. (A) Relative whole-kidney mRNA expression of Inhba was determined in vehicle-treated mice (open bars) and TC-treated mice (filled bars) by qPCR at various time points post UPEC infection. n = 4–8 mice per group. The relative mean fluorescence intensity (MFI) of activin A in (B) epithelial cells (CD45− E-cadherin+), (C) non-epithelial cells (CD45− E-cadherin−), or (D) leukocytes (CD45+ E-cadherin−) compared to the MFI in the total live cell population was determined by flow cytometry at the indicated time points in vehicle-treated mice (open triangles) or TC-treated mice (filled triangles). n = 4–10 mice per group. *P < 0.05, ***P < 0.001.
Figure 3
Figure 3
Follistatin production is reduced during pyelonephritis in androgenized mice. (A) Relative whole-kidney Fst mRNA was measured by qPCR at the indicated time points in vehicle-treated mice (open bars) and TC-treated mice (filled bars). n = 4–8 mice per group. Whole-kidney protein production of follistatin was determined by quantitative western blot [representative blot shown in (B); quantitation in (C)] at the indicated time points in vehicle-treated mice (open triangles) and TC-treated mice (filled triangles). n = 4–5 mice per group. *P < 0.05.
Figure 4
Figure 4
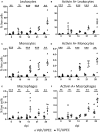
Androgenized mice have larger populations of activin A-producing leukocytes, including monocytes and macrophages, in the kidneys during UPEC infection. The population of (A) total leukocytes (CD45+), (B) activin A+ leukocytes, (C) monocytes (CD45+ CD115+ CD19− CD3e− Ly6G− CD11c− NK1.1−), (D) activin A+ monocytes, (E) macrophages (CD45+ CD115− CD19− CD3e− Ly6G− CD11c− NK1.1−), and (F) activin A+ macrophages as a percentage of the total live cell population was determined by flow cytometry in vehicle-treated mice (open triangles) and TC-treated mice (filled triangles) at the indicated time points. n = 4–10 mice per group. *P < 0.05, **P < 0.01, ***P < 0.001.
Figure 5
Figure 5
Androgenized mice have increased populations of both M1 and M2 macrophages, but a reduced M1:M2 ratio. The populations of (A) M1 macrophages (CD80+) and (B) M2 macrophages (CD80−) as a percentage of total live cells was determined by flow cytometry at the indicated time points in vehicle-treated mice (open triangles) and TC-treated mice (filled triangles). (C) The ratio of M1 to M2 macrophages for each mouse was calculated from the data represented in (A,B). n = 4–10 mice per group. *P < 0.05, **P < 0.01, ***P < 0.001.
Figure 6
Figure 6
Androgenized mice harbor an increased proportion of M2a polarized macrophages. The population of (A) M1 macrophages (CD80+), (B) M2a macrophages (CD80− CD206+ CD150−), (C) M2b macrophages (CD80− CD86+), and (D) M2c macrophages (CD80− CD150+) as a percentage of the polarized macrophage population was determined by flow cytometry at various time points in vehicle-treated mice (open triangles) and TC-treated mice (filled triangles). n = 4–10 mice per group. *P < 0.05, ***P < 0.001.
Figure 7
Figure 7
Kidneys of androgenized mice contain reduced M1- and increased M2-polarizing cytokines. The concentrations of (A) IFNγ, (B) TNFα, (C) CXCL1, (D) G-CSF, (E) IL-1β, and (F) IL-10 were quantified by Bio-Plex assay from protein extracted from whole kidneys of vehicle-treated mice (open triangles) and TC-treated mice (filled triangles) at the indicated time points post-infection. n = 4–10 mice per group. *P < 0.05, **P < 0.01.

References

    1. Foxman B, Barlow R, D'Arcy H, Gillespie B, Sobel JD. Urinary tract infection: self-reported incidence and associated costs. Ann Epidemiol. (2000) 10:509–15. 10.1016/S1047-2797(00)00072-7 - DOI - PubMed
    1. Hummers-Pradier E, Ohse AM, Koch M, Heizmann WR, Kochen MM. Urinary tract infection in men. Int J Clin Pharmacol Ther. (2004) 42:360–6. 10.5414/CPP42360 - DOI - PubMed
    1. Wettergren B, Jodal U, Jonasson G. Epidemiology of bacteriuria during the first year of life. Acta Pædiatrica. (1985) 74:925–33. 10.1111/j.1651-2227.1985.tb10059.x - DOI - PubMed
    1. Foxman B. Epidemiology of urinary tract infections: incidence, morbidity, and economic costs. Am J Med. (2003) 113:5S−13. 10.1016/S0002-9343(02)01054-9 - DOI - PubMed
    1. Ruben FL, Dearwater SR, Norden CW, Kuller LH, Gartner K, Shalley A, et al. . Clinical infections in the noninstitutionalized geriatric age group: methods utilized and incidence of infections: the pittsburgh good health study. Am J Epidemiol. (1995) 141:145–57. 10.1093/oxfordjournals.aje.a117402 - DOI - PubMed

Publication types

MeSH terms