. 2020 Jul 30:11:1145.
doi: 10.3389/fpls.2020.01145. eCollection 2020.

Aphid-Responsive Defense Networks in Hybrid Switchgrass

Affiliations

Aphid-Responsive Defense Networks in Hybrid Switchgrass

Kyle G Koch et al. Front Plant Sci. .

Abstract

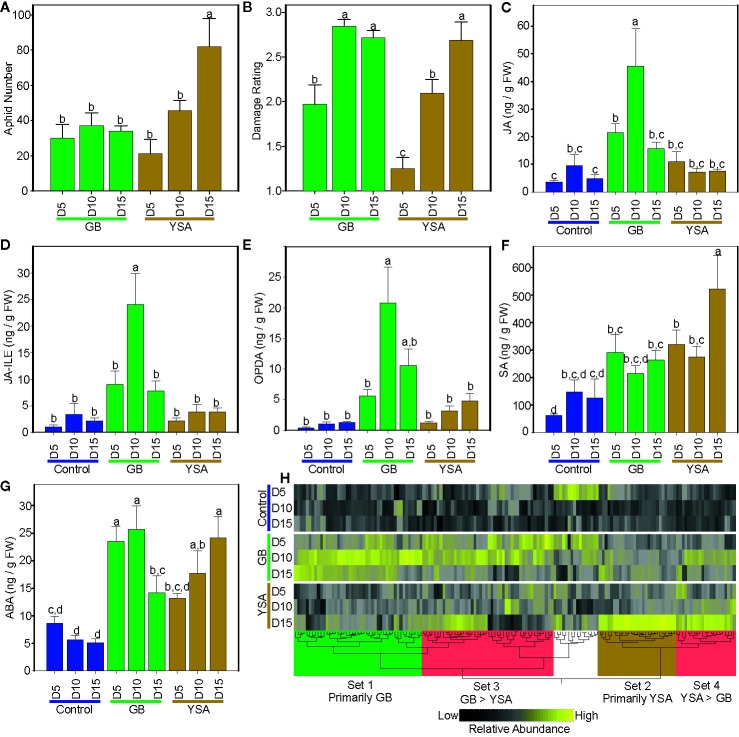
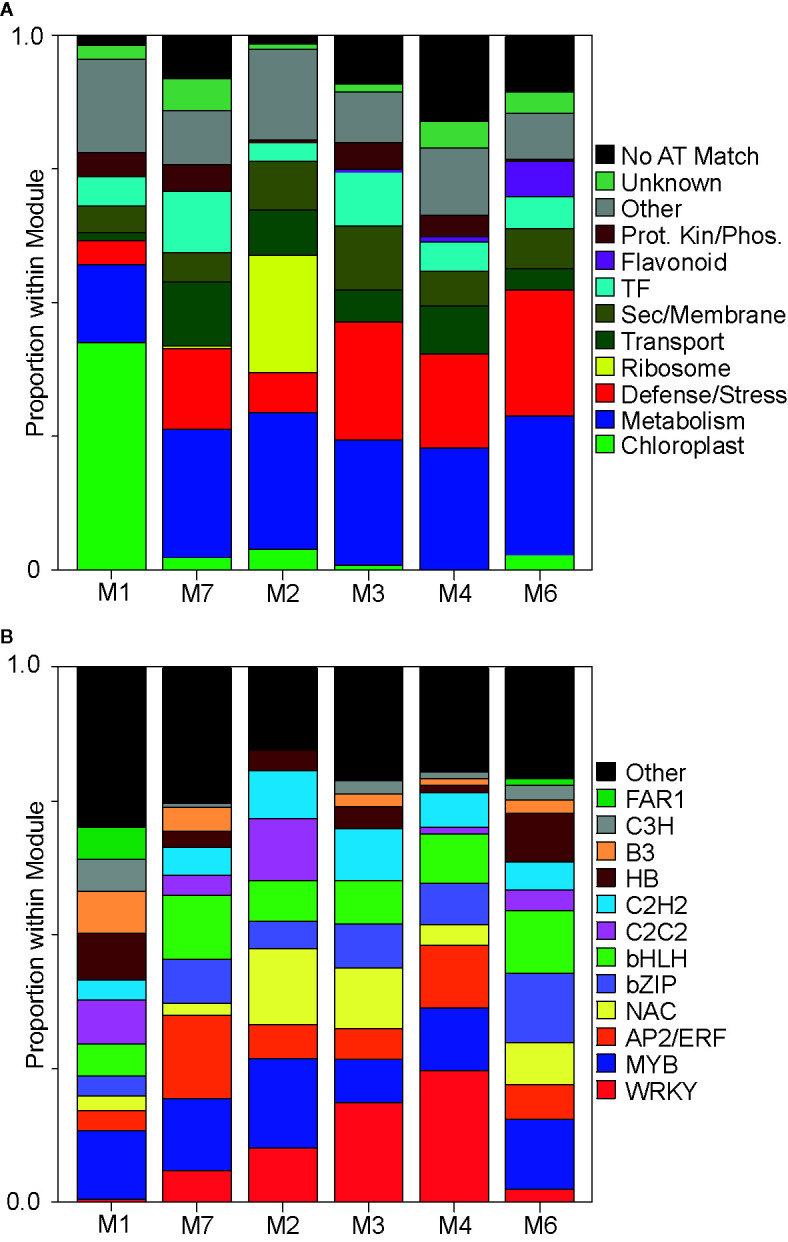
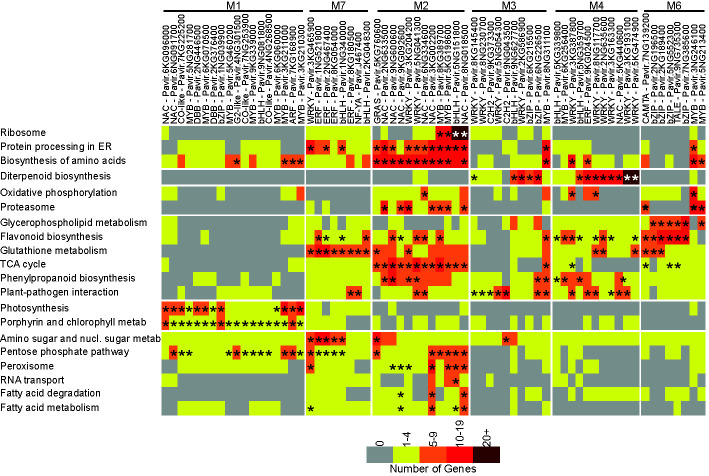
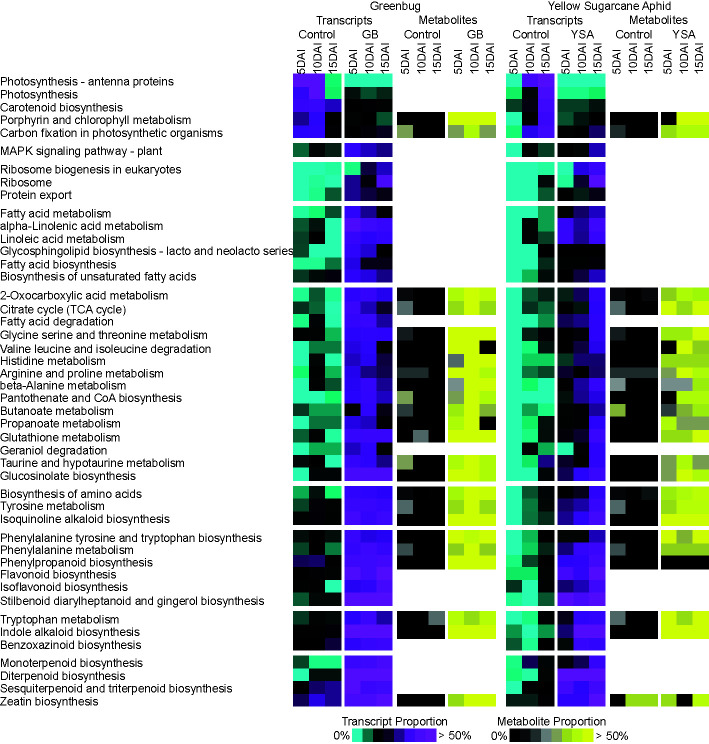
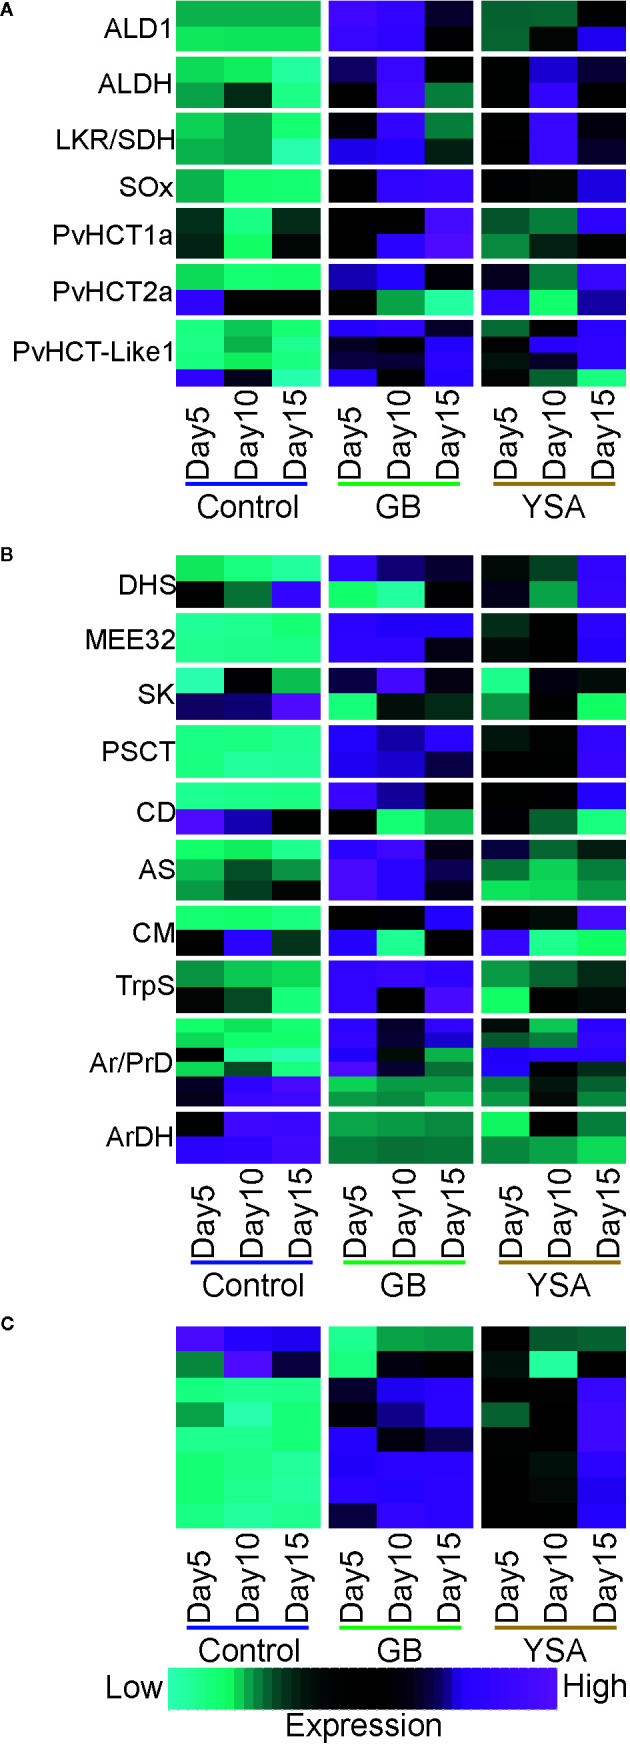
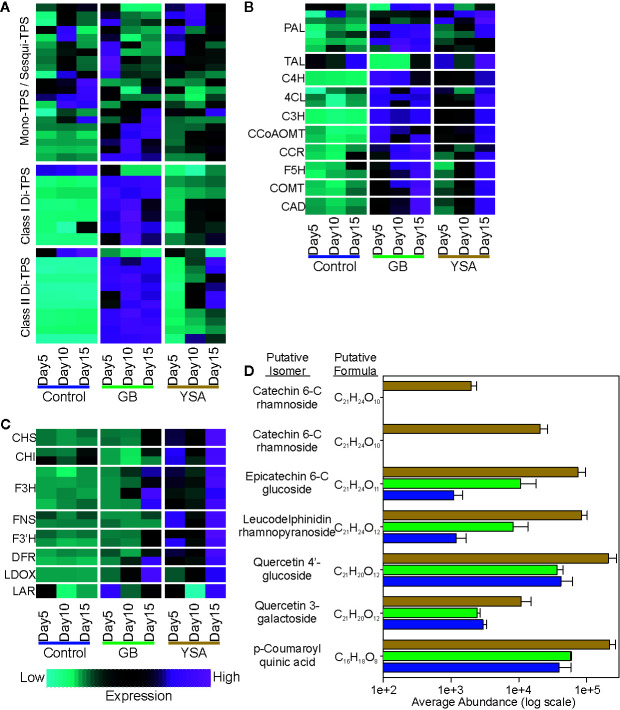
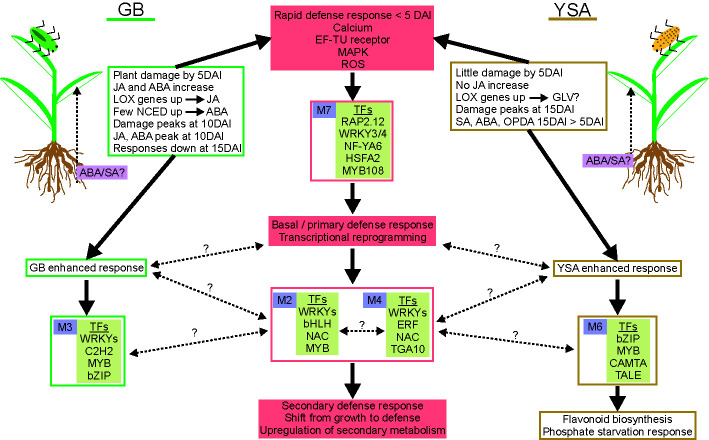
Aphid herbivory elicits plant defense-related networks that are influenced by host genetics. Plants of the upland switchgrass (Panicum virgatum) cultivar Summer can be a suitable host for greenbug aphids (Schizaphis graminum; GB), and yellow sugarcane aphids (Sipha flava, YSA), whereas the lowland cultivar Kanlow exhibited multi-species resistance that curtails aphid reproduction. However, stabilized hybrids of Summer (♀) x Kanlow (♂) (SxK) with improved agronomics can be damaged by both aphids. Here, hormone and metabolite analyses, coupled with RNA-Seq analysis of plant transcriptomes, were utilized to delineate defense networks induced by aphid feeding in SxK switchgrass and pinpoint plant transcription factors (TFs), such as WRKYs that potentially regulate these responses. Abscisic acid (ABA) levels were significantly higher in GB infested plants at 5 and 10 days after infestation (DAI). ABA levels were highest at 15DAI in YSA infested plants. Jasmonic acid levels were significantly elevated under GB infestation, while salicylic acid levels were signifi40cantly elevated only at 15 DAI in YSA infested plants. Similarly, levels of several metabolites were altered in common or specifically to each aphid. YSA infestation induced a significant enrichment of flavonoids consistent with an upregulation of many genes associated with flavonoid biosynthesis at 15DAI. Gene co-expression modules that responded singly to either aphid or in common to both aphids were differentiated and linked to specific TFs. Together, these data provide important clues into the interplay of metabolism and transcriptional remodeling accompanying defense responses to aphid herbivory in hybrid switchgrass.

Keywords: Panicum virgatum; aphids; gene-networks; hybrid switchgrass; metabolites; plant defense; transcription factors; transcriptomes.


Figures

Figure 1
Figure 1
Changes in aphid numbers, plant damage and metabolites across three sampling dates. (A) Aphid numbers. (B) plant damage ratings. (C) Jasmonic acid (JA). (D) JA-isoleucine (JA-Ile). (E)12-Oxo-phytodienoic acid (OPDA). (F) Salicylic acid (SA). (G) Abscisic acid (ABA). (H) Metabolite heat map, black = low abundance, yellow = high abundance. In (A) to (G), green bars are from plants infested with greenbugs (GB), and gold bars are from plants infested with infested with yellow sugarcane aphids (YSA). In (C) to (G), blue bars are control uninfested plants. Different letters above bars in (A) to (G) denote significant differences at P ≤ 0.05, with separation of means using Fisher’s LSD. In all panels, days after initial infestation are shown as D5, D10, and D15. In (H), metabolites preferentially enriched in plants infested with GB (set 1, green box), in plants infested with YSA (set 2, gold box), and metabolites enriched in common in infested plants (sets 3 and 4, red boxes). Metabolite lists are provided in Data S1 .
Figure 2
Figure 2
Functional classification of genes within each co-expression module. (A) Proportional distribution of the ~top 200 genes within each module. Proteins encoded by these ~top 200 genes were manually assigned into predicted cellular functions. Proteins whose functions were ambiguous were grouped into “other” category, (black color). Assigned functional classifications are in colored boxes to the right of panel (see Data S1 ). (B) Transcription factor abundances in the top ~10% of all genes present within each module. Encoded proteins were grouped into known plant transcription factor families [PlantTFDB, http://planttfdb.gao-lab.org/index.php?sp=Pvi (Jin et al., 2017)], which are color coded and shown to the right of panel (also see Data S1 ).
Figure 3
Figure 3
Target TF subnetwork analysis. Modules and target TFs with family and gene id. are shown at the top of the figure. KEGG pathways showing subnetwork enrichment are shown on the left. The number of genes associated with individual TFs in each KEGG pathway are color coded, from gray – no genes to brown – >20 genes. Asterisks denote significant enrichment within the subnetwork at P ≤ 0.05.
Figure 4
Figure 4
Coordinate changes in transcripts and metabolites associated with KEGG metabolic pathways in response to aphid herbivory. Transcripts were assigned to KEGG pathways based on their provided KO and EC annotations in Phytozome. Relative enrichment of transcripts and metabolites were compared between control uninfested plants to plants infested with greenbugs (GB) or yellow sugarcane aphids (YSA) at the three sampling times. Transcript proportions (number of genes upregulated in control or aphid infested plants relative to all expressed genes in that pathway) in each pathway identified is shown from 0% - cyan to >50% - magenta. Metabolite proportion (number of metabolites more abundant in control or aphid infested plants relative to all detected metabolites in that pathway) is shown from 0% - black to >50% yellow.
Figure 5
Figure 5
Expression heat maps of genes required for biosynthesis of select defense-related compounds. Maps are based on z-scores of DEGs where cyan is low expression and magenta is high expression. (A) Pipecolic acid and caffeoyl conjugate biosynthesis. (B) Shikimate and aromatic acid pathways. (C) Enolases. Gene abbreviations and locus information are provided in Data S1 .
Figure 6
Figure 6
Expression heat maps of select genes associated with biosynthesis of secondary metabolites. Maps are based on z-scores of DEGs where cyan is low expression and magenta is high expression. (A) Terpene synthases (TPS). (B) Phenylpropanoid pathway genes. (C) Flavonoid and anthocyanin pathway genes. (D) Abundance of putative flavonoids in plant tissues at 15DAI. Blue bars, control plants; green bars, GB infested plants; gold bars, YSA infested plants. Gene lists are provided in Data S1 .
Figure 7
Figure 7
Proposed tentative model integrating primary and secondary defense responses of hybrid switchgrass to GB and YSA. GB is on left and YSA is on right side of the figure. Solid pink boxes show significant aspects of defense responses. Green and gold boxes highlight summary of changes associated with GB (green) or YSA (gold) herbivory. Gene co-expression modules (purple boxes with module number) and significant TFs within each module are identified. GB and YSA-enhanced responses are shown in green or gold boxes, respectively. Solid arrows denote processes for which experimental evidence is presented, and broken black lines with question marks indicate knowledge gaps.

References

    1. Anders S., Huber W. (2010). Differential expression analysis for sequence count data. Genome Biol. 11, R106. 10.1186/gb-2010-11-10-r106 - DOI - PMC - PubMed
    1. Boone C. H. T., Grove R. A., Adamcova D., Seravalli J., Adamec J. (2017). Oxidative stress, metabolomics profiling, and mechanism of local anesthetic induced cell death in yeast. Redox Biol. 12, 139–149. 10.1016/j.redox.2017.01.025 - DOI - PMC - PubMed
    1. Boursiac Y., Leran S., Corratge-Faillie C., Gojon A., Krouk G., Lacombe B. (2013). ABA transport and transporters. Trends Plant Sci. 18, 325–333. 10.1016/j.tplants.2013.01.007 - DOI - PubMed
    1. Brunetti C., Sebastiani F., Tattini M. (2019). Review: ABA, flavonols, and the evolvability of land plants. Plant Sci. 280, 448–454. 10.1016/j.plantsci.2018.12.010 - DOI - PubMed
    1. Burd J. D., Porter D. R. (2006). Biotypic diversity in Greenbug (Hemiptera: Aphididae): Characterizing new virulence and host associations. J. Econ. Entomol. 99, 959–965. 10.1093/jee/99.3.959 - DOI - PubMed

LinkOut - more resources