. 2020 Aug 5:11:1153.
doi: 10.3389/fpls.2020.01153. eCollection 2020.

Advanced Microscopy Reveals Complex Developmental and Subcellular Localization Patterns of ANNEXIN 1 in Arabidopsis

Affiliations

Advanced Microscopy Reveals Complex Developmental and Subcellular Localization Patterns of ANNEXIN 1 in Arabidopsis

Michaela Tichá et al. Front Plant Sci. .

Abstract

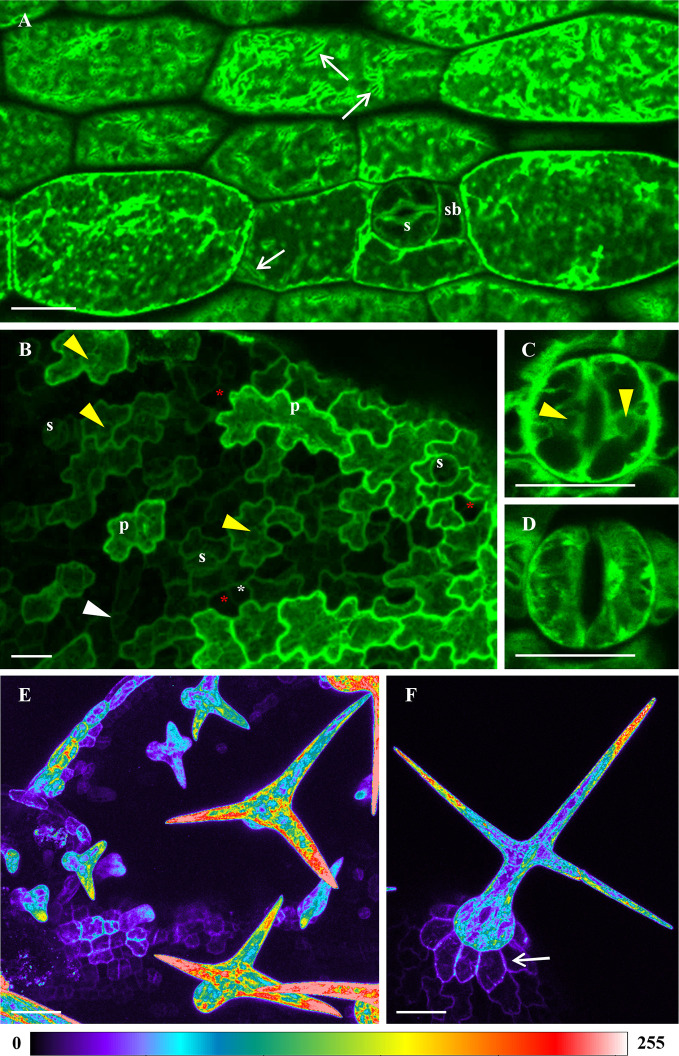
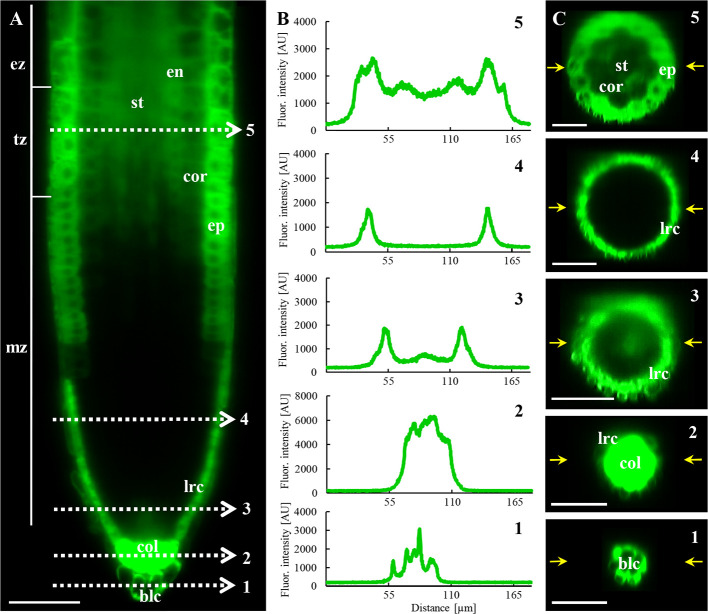
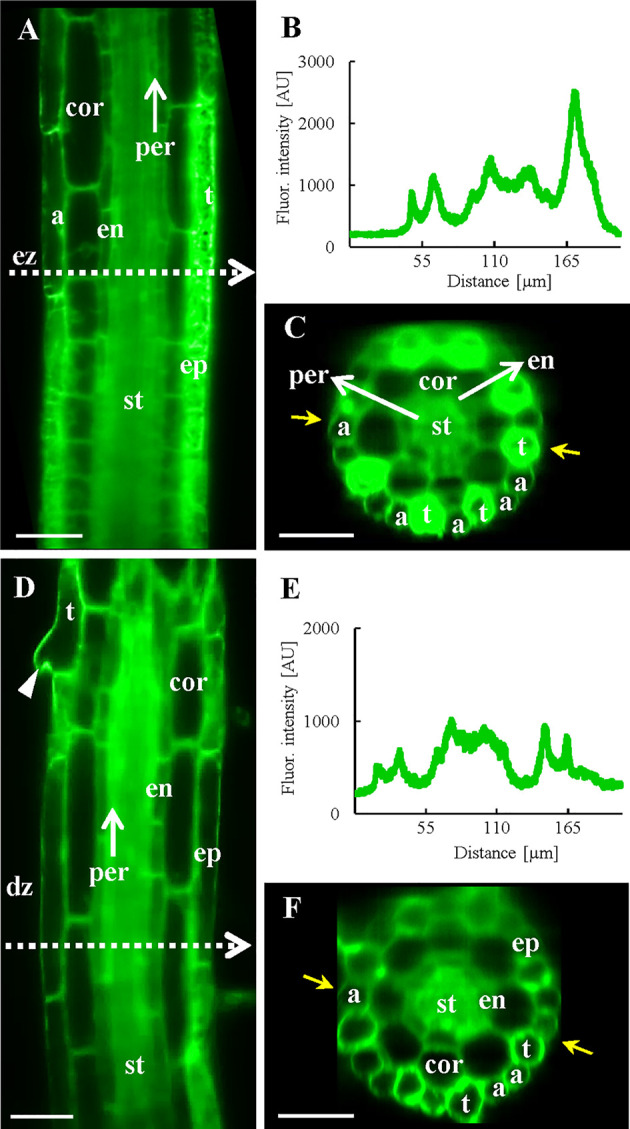
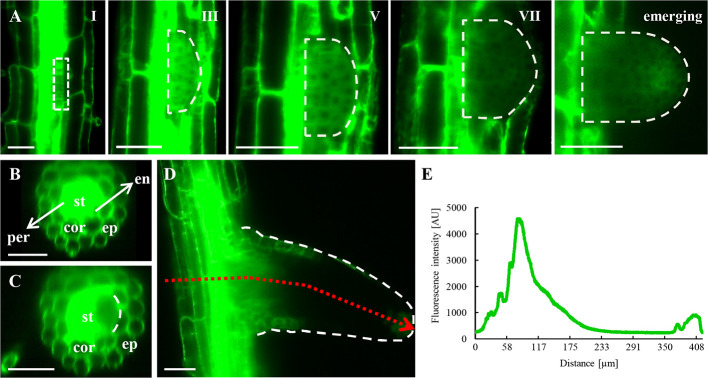
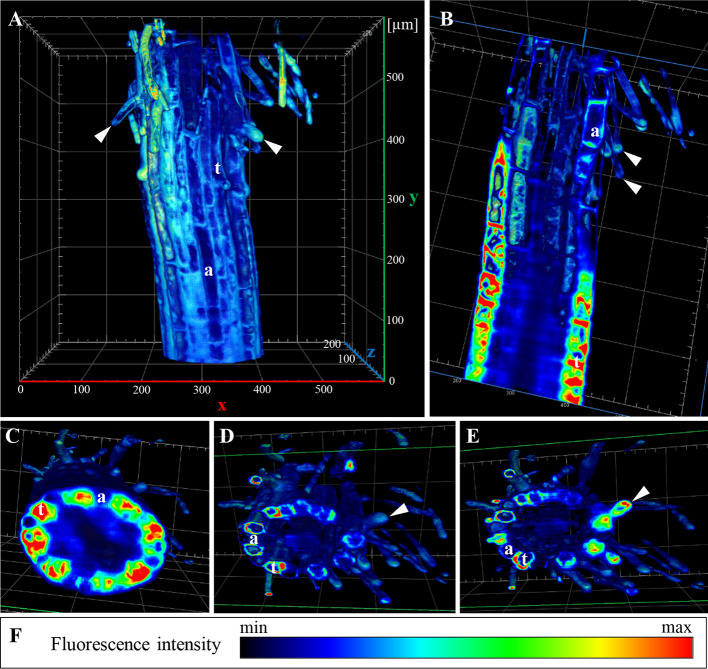
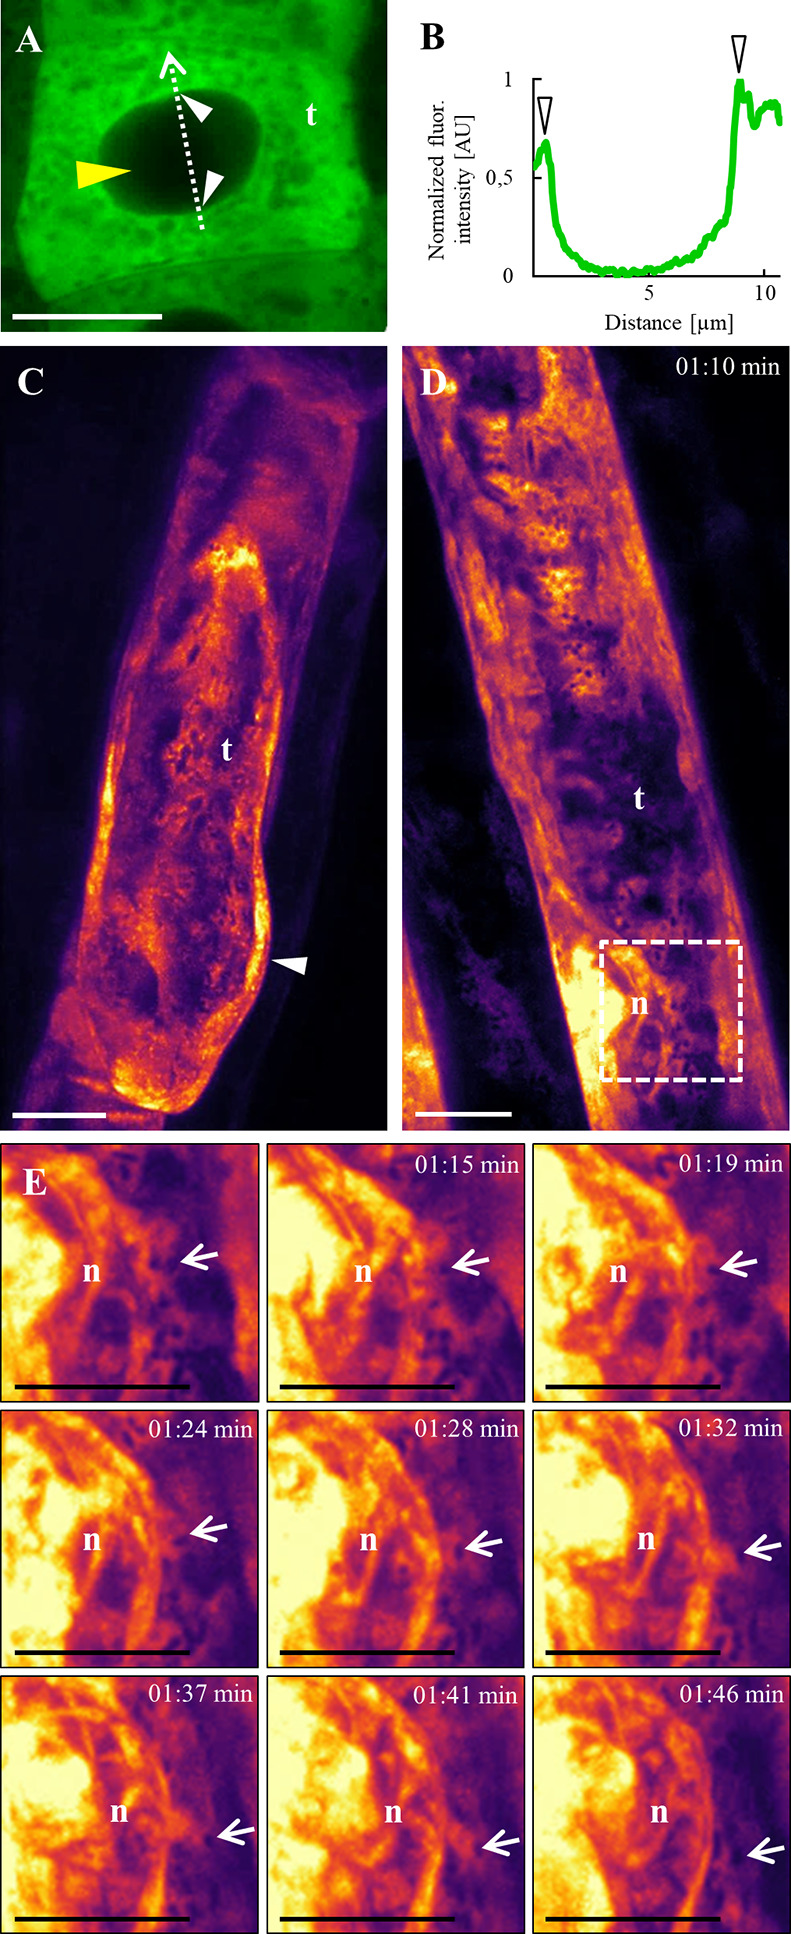
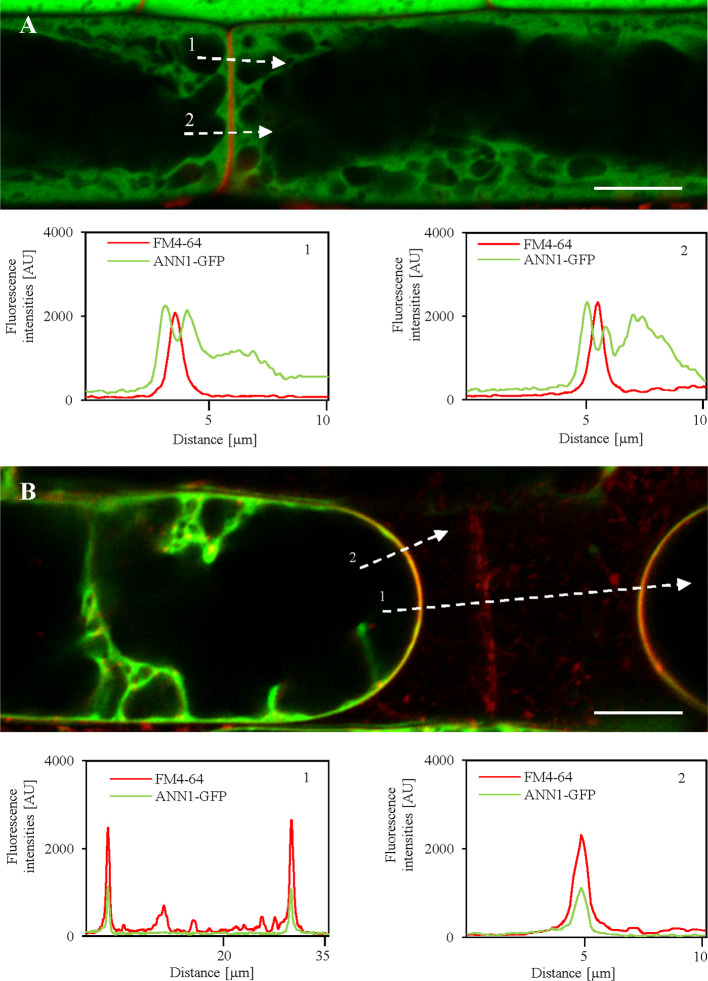
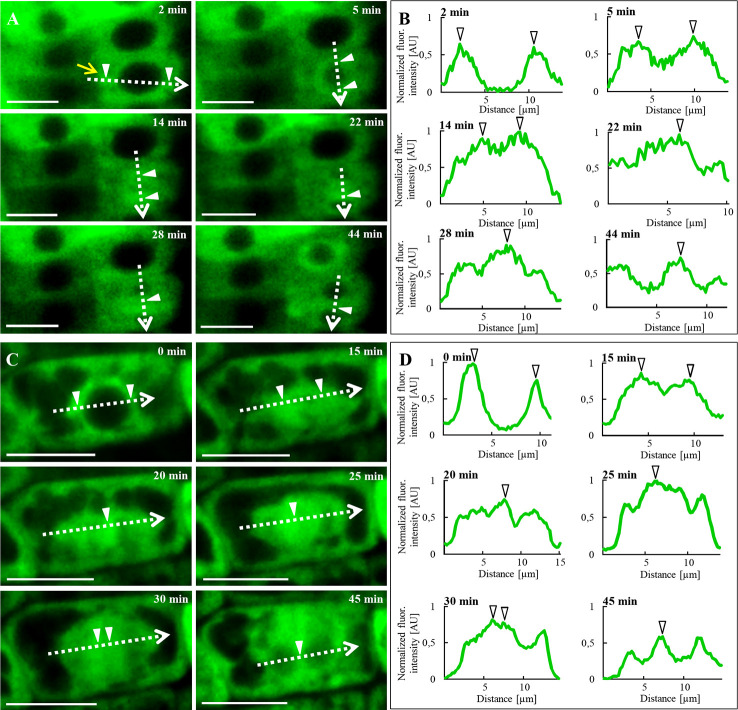
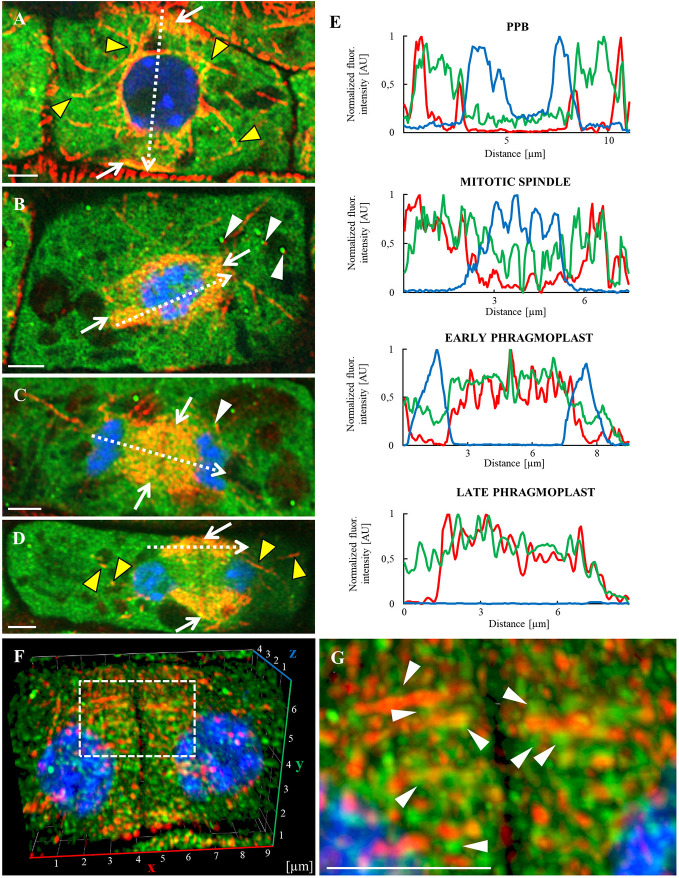
Annexin 1 (ANN1) is the most abundant member of the evolutionary conserved multigene protein superfamily of annexins in plants. Generally, annexins participate in diverse cellular processes, such as cell growth, differentiation, vesicle trafficking, and stress responses. The expression of annexins is developmentally regulated, and it is sensitive to the external environment. ANN1 is expressed in almost all Arabidopsis tissues, while the most abundant is in the root, root hairs, and in the hypocotyl epidermal cells. Annexins were also occasionally proposed to associate with cytoskeleton and vesicles, but they were never developmentally localized at the subcellular level in diverse plant tissues and organs. Using advanced light-sheet fluorescence microscopy (LSFM), we followed the developmental and subcellular localization of GFP-tagged ANN1 in post-embryonic Arabidopsis organs. By contrast to conventional microscopy, LSFM allowed long-term imaging of ANN1-GFP in Arabidopsis plants at near-environmental conditions without affecting plant viability. We studied developmental regulation of ANN1-GFP expression and localization in growing Arabidopsis roots: strong accumulation was found in the root cap and epidermal cells (preferentially in elongating trichoblasts), but it was depleted in dividing cells localized in deeper layers of the root meristem. During root hair development, ANN1-GFP accumulated at the tips of emerging and growing root hairs, which was accompanied by decreased abundance in the trichoblasts. In aerial plant parts, ANN1-GFP was localized mainly in the cortical cytoplasm of trichomes and epidermal cells of hypocotyls, cotyledons, true leaves, and their petioles. At the subcellular level, ANN1-GFP was enriched at the plasma membrane (PM) and vesicles of non-dividing cells and in mitotic and cytokinetic microtubular arrays of dividing cells. Additionally, an independent immunolocalization method confirmed ANN1-GFP association with mitotic and cytokinetic microtubules (PPBs and phragmoplasts) in dividing cells of the lateral root cap. Lattice LSFM revealed subcellular accumulation of ANN1-GFP around the nuclear envelope of elongating trichoblasts. Massive relocation and accumulation of ANN1-GFP at the PM and in Hechtian strands and reticulum in plasmolyzed cells suggest a possible osmoprotective role of ANN1-GFP during plasmolysis/deplasmolysis cycle. This study shows complex developmental and subcellular localization patterns of ANN1 in living Arabidopsis plants.

Keywords: Arabidopsis thaliana; annexin 1; cell division; development; lattice light-sheet fluorescence microscopy; light-sheet fluorescence microscopy; plasma membrane; subcellular localization.


Figures

Figure 1
Figure 1
Tissue- and cell-specific localization of ANN1-GFP in different aerial organs of A. thaliana seedlings stably expressing proANN1::ANN1:GFP construct using confocal laser scanning microscopy (CLSM). (A) Expression of ANN1-GFP in hypocotyl epidermal cells showing its localization in the cell cortex, cytoplasmic strands, and in areas around membranous compartments resembling ER bodies (arrows). ANN1-GFP expression delineated cell cortex in stomata guard cells (s) and subsidiary cells (sb). (B) Unequal distribution of ANN1-GFP in epidermal cells of developing first true leaf. Prominent production of ANN1-GFP was evident in expanding pavement cells (p), whereas it was almost absent in stomatal precursor cells: meristemoid mother cells (red asterisks), meristemoids (white arrowhead) and guard mother cells (white asterisks). (C, D) Distribution of ANN1-GFP within radially organized arrays of cytoplasmic strands in leaf stomata guard cells presented in the medial plane (C) and in the cortical plane (D). Note the absence of ANN1-GFP fluorescence in nuclei indicated by yellow arrowheads in (B, C). (E, F) Color-coded images of ANN1-GFP localization in different developmental stages of trichomes. Note the tip-focused accumulation of ANN1-GFP in trichomes (E, F) and its lower abundance in basal cells of developed trichome indicated by an arrow in (F). Scale bars = 20 μm.
Figure 2
Figure 2
Localization of ANN1-GFP in the primary root of A. thaliana stably expressing proANN1::ANN1:GFP construct using CLSM. (A) Maximum intensity projection and (B) medial optical section overview of ANN1-GFP localization in the root apex. In the meristematic zone (mz) the expression level is very low. ANN1-GFP starts to be detectable in root epidermis (ep) within the distal portion of the meristematic zone (mz) and in the transition zone (tz), where ANN1-GFP signal appears also in deeper root tissues. (A) Relatively high expression level of ANN1-GFP is present in apical root cap cells (arc) and lateral root cap cells (lrc). (B) Apparent accumulation of ANN1-GFP is also in border-like cells (blc) and the apical layer of columella (col) in medial plane of the root. (C, D) A striped-like pattern of ANN1-GFP expression in root epidermis within the elongation (C) and differentiation zone (D) of the root. A pattern of higher expression in trichoblasts (t) and lower expression in atrichoblasts (a) is preserved from the end of meristematic zone (mz) through the transition zone (tz) to the elongation zone (ez). The abundance of ANN1-GFP in trichoblast cell files is enhanced before and during the root hair initiation within the differentiation zone (dz), when ANN1-GFP is accumulated in the bulge and emerging root hair tip [arrowhead in (D)]. Note the absence of ANN1-GFP fluorescence in nuclei of trichoblasts indicated by yellow arrowheads in (C). (E) A color-coded image representing maximum intensity projection from individual Z-stacks of root differentiation zone with moderate fluorescence signal in trichoblast cell files (t), high fluorescence signal in emerging and growing root hairs, whereas low signal was observed in atrichoblast cell files (a). Note the tip-focused accumulation of ANN1-GFP in emerging and actively-growing root hairs indicated by arrowheads. (F) Typical net-like distribution of ANN1-GFP in cortical layers of cytoplasm in the trichoblast (t) and fully-grown root hair. Scale bars = 50 μm.
Figure 3
Figure 3
In vivo localization of ANN1-GFP in meristematic and transition zone of primary root in A. thaliana expressing proANN1::ANN1:GFP construct using LSFM. (A) Medial optical section of the primary root showing the distribution pattern of ANN1-GFP expression. Strong level of ANN1-GFP production is visible in the columella cells (col) and in lateral root cap cells (lrc). Cells of the root meristematic zone (mz) are devoited of ANN1-GFP. The signal of ANN1-GFP is enhanced in epidermal cells (ep) within the meristematic zone and stays strong through the transition (tz) to elongation zone (ez). Starting in the transition zone (tz) ANN1-GFP is produced also in inner root tissues: cortex (cor), endodermis (en), and stele (st). White dashed lines (1–5) indicate the position of the profiles along which the fluorescence intensities, showed in (B), were measured for quantitative evaluation of ANN1-GFP distribution. (C) Distribution of ANN1-GFP visualized in radial root sections prepared from orthogonal projections of the root apex at the position of respective fluorescence intensity profiles in (A), indicated by yellow arrows. Scale bars = 50 µm.
Figure 4
Figure 4
In vivo localization of ANN1-GFP in elongation and differentiation zone of the primary root in A. thaliana expressing proANN1::ANN1:GFP construct using LSFM. (A) Medial optical section of the elongation zone shows tissue-specific localization pattern of ANN1-GFP, with higher amount in trichoblasts (t) in comparison to atrichoblasts (a) of the epidermis (ep), lowering of the ANN1-GFP content in vacuolated cortical cells (cor) and in endodermal cells (en), and rather homogenous distribution in the stele (st) and pericycle (per) cells. White dashed arrow indicates the position where the fluorescence intensity profile has been measured. (B) The fluorescence intensity along the profile shown in (A) and yellow arrows in (C). (C) The corresponding orthogonal projection of the radial root section at the position of the intensity profile in (A). (D) Medial optical section of the differentiation zone with the strongest level of ANN1-GFP production in the stele (st) and decreased amount in vacuolated cells of endodermis (en), cortex (cor), and epidermis (ep). Trichoblast with emerged root hair is marked by an arrowhead. White dashed arrow indicates the position where the fluorescence intensity profile has been measured. (E) The fluorescence intensity along the profile shown in (D) and yellow arrows in (F). (F) The corresponding orthogonal projection of the radial root section at the position of the intensity profile in (D). Scale bars = 50 µm.
Figure 5
Figure 5
In vivo localization of ANN1-GFP during lateral root formation and emergence in transgenic A. thaliana expressing proANN1::ANN1:GFP construct using LSFM. (A) Representative images of selected developmental stages of lateral root primordium (LRP) establishment. ANN1-GFP signal was localized in the cytoplasm and was absent in nuclei of LRP cells in early stages of LRP formation (phases I, III, and V). ANN1-GFP signal considerably decreased in LRP cells in the phase VII and during lateral root emergence. (B) Cross-section of the primary root from orthogonal projection before LRP initiation with the strong and uniformly distributed signal of ANN1-GFP in the stele (st) and decreased amount in vacuolated cells of endodermis (en), cortex (cor), and epidermis (ep). (C) Drop of the ANN1-GFP signal intensity in the pericycle and adjacent stele tissue at the time of LRP establishment. (D) Distribution of ANN1-GFP signal in the emerging lateral root. Tissue-specific fluorescence intensity in emerging lateral root was determined along the profile representing a cross-section of the primary root and longitudinal gradient in developing lateral root (as shown by dotted red arrow). (E) The fluorescence intensity along the profile shown in (D). Scale bars = 50 μm.
Figure 6
Figure 6
3-D rendering of ANN1-GFP distribution in A. thaliana primary root stably expressing proANN1::ANN1:GFP construct. Data were obtained by Luxendo MuVI SPIM and after post-processing 3-D reconstruction was made by Arivis. (A) Overview of the elongation and differentiation zone of the primary root with root hairs (arrowheads) in different stages of their development. (B) Clipping of the 3-D model against z-plane revealed the highest fluorescence intensity of ANN1-GFP (red in pseudocolored intensity scale) in trichoblast cell files (t). (C–E) Clipping of the 3-D model against y-plane, where in (C) the lowest plane shows root cross-section at the elongation zone with a different distribution of ANN1-GFP in trichoblasts (t) and atrichoblasts (a). (D, E) 3-D projections displaying root cross-sections at the differentiation zone, arrowhead indicates growing root hair, whereas y-clipping along its longitudinal plane point to ANN1-GFP accumulation in root hair tip. (F) Heat map presents ANN1-GFP fluorescence intensity in pseudocolors with the lowest fluorescence intensity corresponding to black and highest fluorescence intensity corresponding to red color. Arrowheads point root hair tips, (t) points trichoblasts, and (a) atrichoblasts.
Figure 7
Figure 7
Subcellular localization of ANN1-GFP in trichoblasts using Airyscan CLSM (A, B) and lattice LSFM (C–E). (A) Accumulation of ANN1-GFP around the nucleus, close to the nuclear envelope (white arrowheads) in trichoblast (t) cell within meristematic root zone. Note the absence of ANN1-GFP fluorescence in the nucleus indicated by the yellow arrowhead. (B) Fluorescence intensity profile of ANN1-GFP distribution was measured along a dotted arrow in (A) and normalized. Note that arrowheads indicate maximum of measured fluorescence intensity corresponding to ANN1-GFP accumulation around the nuclear envelope. (C–E) In vivo time-lapse imaging of ANN1-GFP localization in trichoblasts using lattice LSFM. (C) Higher fluorescence intensity of ANN1-GFP at the basal end of trichoblast (t) and its accumulation in the cortical cytoplasm of the established bulge (white arrowhead). (D) Accumulation of ANN1-GFP around the nucleus (n), close to the nuclear envelope in elongating trichoblast (t). (E) Magnified boxed area in (D) showing selected stills of vesicular dynamic movement (arrows) around the nucleus (n) of elongating trichoblast. Scale bars = 10 μm.
Figure 8
Figure 8
Relocation of ANN1-GFP in plasmolyzed root epidermal cells to the FM4-64-labeled plasma membranes after salt stress as revealed by high-resolution Airyscan CLSM. (A) Root epidermal cells in the elongation root zone carrying ANN1-GFP and co-labeled with FM4-64 (red) for detection of the plasma membrane under control conditions. Fluorescence intensity profiles measured along the dotted white lines 1 and 2 in (A) showing distinctly separated ANN1-GFP and FM4-64 peaks, suggesting no obvious colocalization. (B) Salt stress causes relocation of ANN1-GFP to FM4-64 labeled plasma membranes in plasmolyzed root epidermal cells of elongation root zone. Fluorescence intensity profiles measured along the dotted white lines 1 and 2 in (B) showing a strong overlap of FM4-64 and ANN1-GFP peaks, suggesting their colocalization. Scale bars = 10 μm.
Figure 9
Figure 9
In vivo time-lapse imaging of subcellular localization of ANN1-GFP during cell division in transgenic A. thaliana expressing proANN1::ANN1:GFP construct using LSFM. (A) Redistribution of ANN1-GFP in dividing root epidermal cell. At the initial stage (2 min), ANN1-GFP was present at the pre-prophase band of microtubules (yellow arrow). Later on (5 min), ANN1-GFP was enriched around the nucleus before and at the time of mitotic spindle formation (14 min). Next, it relocated to early (22 and 28 min) and late phragmoplast (44 min). (C) The analogous pattern of ANN1-GFP relocation and association with mitotic and cytokinetic microtubule arrays was recorded in dividing lateral root cap cell. (B, D) Fluorescence intensity profiles of ANN1-GFP distribution were measured along indicated dotted arrows at respective cell division stages. Arrowheads [white in (A, C) and black-bordered in (B, D)] indicate a maximum of measured fluorescence intensities. Scale bars = 10 μm.
Figure 10
Figure 10
Whole-mount immunofluorescence colocalization study of microtubules (red) and ANN1-GFP (green) in dividing lateral root cap cells made by Airyscan CLSM. Nuclei are labeled with DAPI (blue), while individual division stages (indicated by white arrows) are depicted as merged images: (A) Preprophase band (PPB), (B) mitotic spindle, (C) early phragmoplast, and (D) late phragmoplast. Yellow arrowheads indicate the association of ANN1-GFP with microtubules, white arrowheads point to the association of spots containing ANN1-GFP with microtubules. Individual images of microtubules in red, ANN1-GFP in green, and DNA in blue corresponding to merged images (A–D) are shown in Figure S10. (E) Fluorescence intensity profiles of ANN1-GFP distribution were measured in indicated cell division stages along dotted arrows depicted in (A–D) and normalized. Green lines represent ANN1-GFP, red microtubules, and blue DAPI. (F) Frontal view of lateral root cap cell (3-D rendered) showing late phragmoplast. (G) Detail of ANN1-GFP spot-like localization pattern (white arrowheads) closely associated with phragmoplast microtubules of dotted boxed area in (F). Scale bars = 2 µm.

Similar articles

Cited by

References

    1. Andrawis A., Solomon M., Delmer D. P. (1993). Cotton fiber annexins: a potential role in the regulation of callose synthase. Plant J. 3, 763–772. 10.1111/j.1365-313X.1993.00763.x - DOI - PubMed
    1. Baucher M., Pérez-Morga D., Jaziri M. E. (2012). Insight into plant annexin function. Plant Signal. Behav. 7, 524–528. 10.4161/psb.19647 - DOI - PMC - PubMed
    1. Blackbourn H. D., Battey N. H. (1993). Annexin-mediated secretory vesicle aggregation in plants. Physiol. Plant 89, 27–32. 10.1111/j.1399-3054.1993.tb01782.x - DOI
    1. Blackbourn H. D., Barker P. J., Huskisson N. S., Battey N. H. (1992). Properties and partial protein sequence of plant annexins. Plant Physiol. 99, 864–871. 10.1104/pp.99.3.864 - DOI - PMC - PubMed
    1. Brown R. M. (2004). Cellulose structure and biosynthesis: What is in store for the 21st century? J. Polym. Sci. A Polym. Chem. 42, 487–495. 10.1002/pola.10877 - DOI