Review
. 2020 Aug 7:11:1226.
doi: 10.3389/fpls.2020.01226. eCollection 2020.

Principles and Applications of Vibrational Spectroscopic Imaging in Plant Science: A Review

Affiliations
Review

Principles and Applications of Vibrational Spectroscopic Imaging in Plant Science: A Review

Krzysztof B Beć et al. Front Plant Sci. .

Abstract

Detailed knowledge about plant chemical constituents and their distributions from organ level to sub-cellular level is of critical interest to basic and applied sciences. Spectral imaging techniques offer unparalleled advantages in that regard. The core advantage of these technologies is that they acquire spatially distributed semi-quantitative information of high specificity towards chemical constituents of plants. This forms invaluable asset in the studies on plant biochemical and structural features. In certain applications, non-invasive analysis is possible. The information harvested through spectral imaging can be used for exploration of plant biochemistry, physiology, metabolism, classification, and phenotyping among others, with significant gains for basic and applied research. This article aims to present a general perspective about vibrational spectral imaging/micro-spectroscopy in the context of plant research. Within the scope of this review are infrared (IR), near-infrared (NIR) and Raman imaging techniques. To better expose the potential and limitations of these techniques, fluorescence imaging is briefly overviewed as a method relatively less flexible but particularly powerful for the investigation of photosynthesis. Included is a brief introduction to the physical, instrumental, and data-analytical background essential for the applications of imaging techniques. The applications are discussed on the basis of recent literature.

Keywords: FT-IR; Raman; hyperspectral; imaging; multispectral; near-infrared; plant; vibrational spectroscopy.


Figures

Figure 1
Figure 1
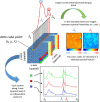
Simplified scheme presenting fundamental principles of a spectral data hypercube and visualization based on the most straightforward spectral information available, spectral intensity. Reproduced with permission from Elsevier (Beć et al., 2020).
Figure 2
Figure 2
The typical sample presentation modes used in spectroscopic imaging instrumentation.
Figure 3
Figure 3
Block diagram of an FT-IR microspectrometer equipped with MCT detector and CCD camera.
Figure 4
Figure 4
Images of hand-dissected wheat kernel tissues (Consort), shown as false-color principal component analysis (PCA) images, with example spectra provided for regions of interest: (A) pericarp-testa; (B) aleurone; (C) germ; and (D) endosperm. Scale bars: 50 μm. Reproduced in compliance with CC BY 4.0 license from Warren et al., 2015.
Figure 5
Figure 5
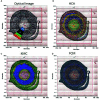
(A) Section through the caulis of St. John’s wort (H. perforatum) with marked regions (2) obtained by Huck-Pezzei et al., 2012. (e) epidermis, (s) sclerenchyma, (p) phloem, (Px) protoxylem, and (x) xylem. (B) FTIR imaging result shown in false color representation. Colors reflect intensities of the selected absorption at 1084 cm−1, which is commonly attributed to nucleic acids. (C) FTIR imaging result shown in false color representation. Colors reflect intensities of the selected absorption at 1,515 cm−1, which is commonly attributed to lignin. (D) FTIR imaging result in false color representation. Colors reflect intensities of the selected absorption at 2,956 cm−1, which is commonly attributed to lipids, proteins, carbohydrates, and nucleic acids. Reproduced with permission (Springer) from Huck-Pezzei et al., 2012.
Figure 6
Figure 6
The significance of spectral image processing method for elucidating the chemical information from plant specimen. (A) section through the caulis of St. John’s wort (H. perforatum) with marked regions; (B) hierarchical cluster analysis; (C) k-means clustering image; (D) spectroscopic image of the fuzzy c-means clustering. Reproduced with permission (Springer) from Huck-Pezzei et al., 2012.
Figure 7
Figure 7
Principal component analysis (PCA) score image (t1) of Echinacea sp. leaf powders based on color amplitudes (A). The corresponding score plot (PC1 vs. PC3) shows minimal separation of the pixel clusters (B). (EAL—E. angustifolia leaf, EPL—E. purpurea leaf, EPaL—E. pallida leaf). Reproduced in compliance with CC BY-NC-SA 3.0 license from Sandasi et al., 2014.
Figure 8
Figure 8
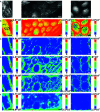
Raman chemical images of three exemplary mapping data sets of cross sections of cucumber (Cucumis sativus) stem xylem. (A) Bright field images; (B) Integral intensity in the region 1,550–1,700 cm−1, obtained after baseline correction; (C) Product of the intensities of the cellulose bands at 1,092 cm−1 and 1,337 cm−1, respectively, cf. (D, E); (D) Intensity at 1,092 cm−1 (baseline corrected in the range 1070–1108 cm−1); (E) Intensity at 1337 cm−1 (baseline corrected in the range 1,313–1,358 cm−1); (F) Intensity integrated over the full spectral range 600–2,000 cm−1. lm, lumen; phl, phloem; scw, secondary cell wall, pcw: primary cell wall; isp, intercellular space. Scale bars: 10 μm, mapping step size: 1 μm, excitation wavelength: 532 nm, excitation intensity: 1.7 × 10⁶ W/cm2, accumulation time: 1 s. Reproduced in compliance with CC-BY 4.0 license from Zeise et al., 2018.
Figure 9
Figure 9
Workflow of using chlorophyll fluorescence imaging (CFI) technique to dynamically monitor photosynthetic fingerprints caused by salt overly sensitive genes under drought condition. LDA, linear discriminant analysis; KNN, k-nearest neighbor classifier; NB, Gaussian naive Bayes; SVM, support vector machine. Reproduced in compliance with CC-BY 4.0 license from Sun D. et al. (2019).
Figure 10
Figure 10
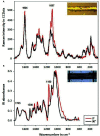
Baseline corrected Raman (A) and Infrared spectra (B) acquired on mechanically isolated single spruce wood fibers (microfibril angle < 10°) with the incident polarization direction parallel to the fiber (0°, red spectra) and perpendicular to the fiber (90°, black spectra). Reproduced in compliance with CC BY-NC-ND 4.0 license from Gierlinger, 2018.
Figure 11
Figure 11
Distribution of Raman signal-to-baseline intensity of the carotenoid v 1(C=C) band in leaves of Chenopodium album as unveiled by Vítek et al., 2020. The area around the herbicide application was scanned 1–3 days after application. The 3D plots represent a visualization of 2D spatial information, with z-axis representing the Raman intensity of the v 1(C=C) band. Reproduced in compliance with CC-BY 4.0 license from Vítek et al., 2020.
Figure 12
Figure 12
Sequence of chlorophyll fluorescence and thermal imaging of leaves in the span 0–96 h after application as unraveled by Vítek et al., 2020. (A) The maximum quantum efficiency of PSII (F v/F m). (B) Non-photochemical quenching (NPQ). (C) Probability that a trapped exciton moves an electron into the electron transport chain beyond primary quinone electron acceptors of PSII (1-V j). (D) Temperature increase in comparison to untreated control. Points represent means and error bars standard deviations (n=5). Reproduced in compliance with CC-BY 4.0 license from Vítek et al., 2020.

References

    1. Agarwal U. P. (2014). 1064 nm FT-Raman spectroscopy for investigations of plant cell walls and other biomass materials. Front. Plant Sci. 5:490:490. 10.3389/fpls.2014.00490 - DOI - PMC - PubMed
    1. Albani J. R. (2004). Structure and dynamics of macromolecules: absorption and fluorescence studies (Amsterdam, Netherlands: Elsevier Science; ).
    1. Aneece I., Thenkabail P. (2018). Accuracies achieved in classifying five leading world crop types and their growth stages using optimal Earth observing-1 hyperion hyperspectral narrowbands on Google Earth engine. Remote Sens. 10, 2027. 10.3390/rs10122027 - DOI
    1. Arnold T., Leitner R., Bodner G. (2016). Application of NIR hyperspectral imaging for water distribution measurements in plant roots and soil, 2016 IEEE SENSORS (Orlando, FL: IEEE SENSORS; ), 1–3. 10.1109/ICSENS.2016.7808534 - DOI
    1. Barańska M., Schulz H., Barański R., Nothnagel T., Christensen L. P. (2005). In situ simultaneous analysis of polyacetylenes, carotenoids and polysaccharides in carrot roots. J. Agri. Food Chem. 53, 6565–6571. 10.1021/jf0510440 - DOI - PubMed